

Healthcare Market Segmentation
Healthcare By Treatment Type (USD Billion, 2025-2035)
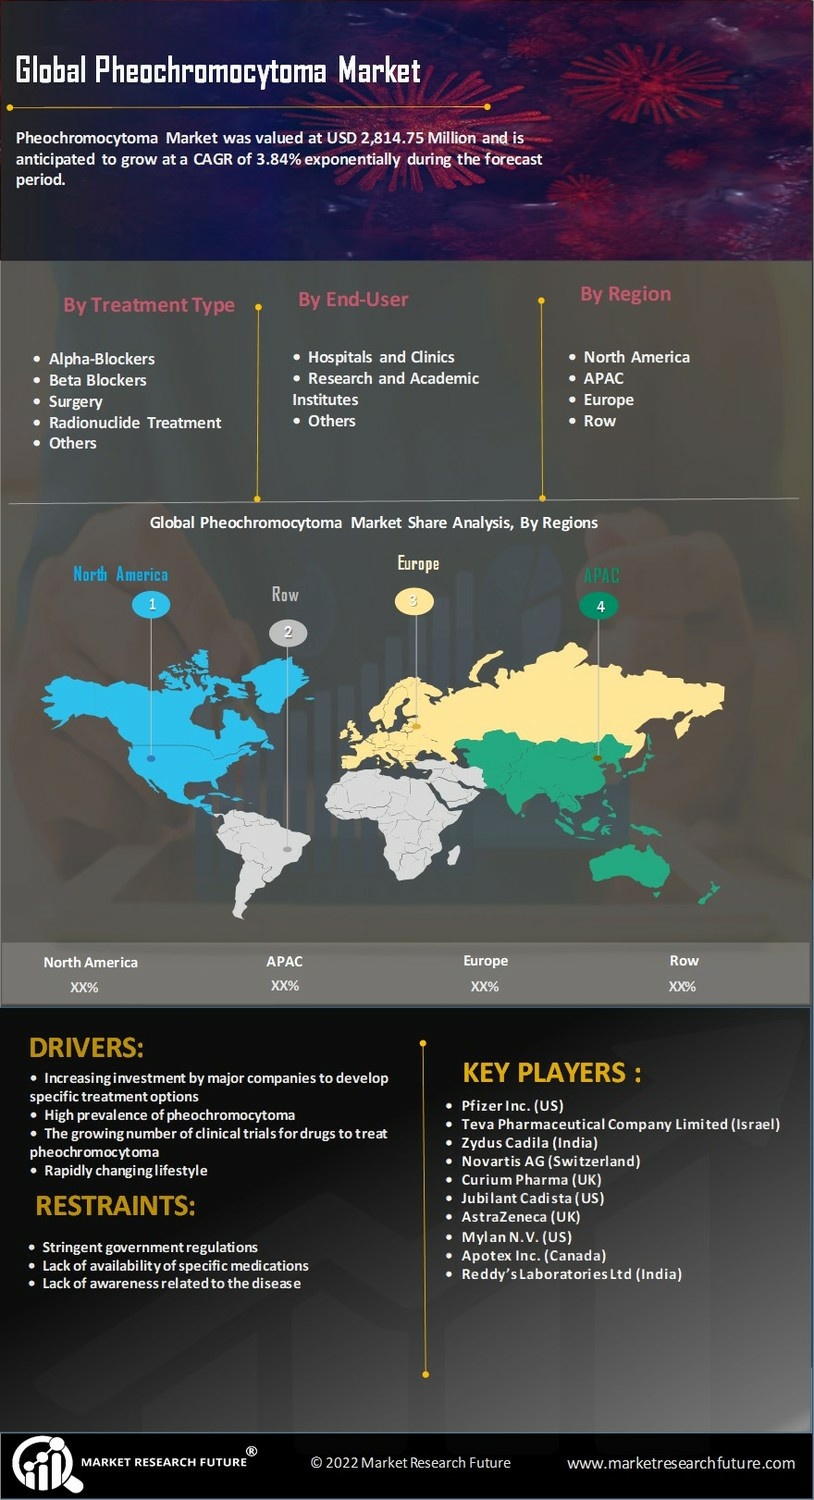
- Alpha-Blockers
- Beta Blockers
- Surgery
- Radionuclide Treatment
- Others
Healthcare By End-User (USD Billion, 2025-2035)
- Hospitals and Clinics
- Research and Academic Institutes
- Others


