ID: MRFR/MED/5535-HCR | February 2021 | Region: Global | 85 pages
Market Scenario:
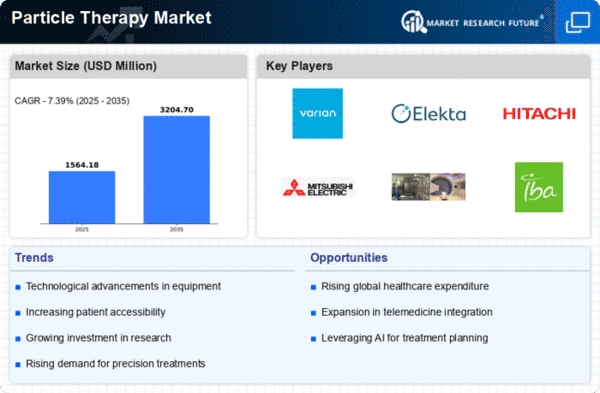
The Global Particle Therapy Market is accounted for USD 790.45 million in 2017 and expected to register 9.1% CAGR during the forecast period (2018–2023). Particle therapy is one of the world's most advanced areas of external beam radiation therapy applied to oncology. This technique saves healthier radiation tissue better than conventional photon therapy. These particles have more favorable physical intrinsic properties that reduce the intake dose to approximately 50% of the dose in a clinically relevant target.
The rising prevalence of cancer population, low risk of treatment induced disorders, potential for retreatment owing to low radiation dose, and rising number of particle therapy centers across the world are expected to drive the growth of the market. Moreover, rising R&D spending and aggressive strategies adopted by the top players such as new product launches are contributing to the growth of the market. For instance, in December 2017, Advanced Oncotherapy plc announced that it secures the fresh funding of USD 46.75 million from which USD 37.5 million of funds coming from a new Chinese investor. The lack of adequate reimbursement policy and high costs involved in the establishment of these centers may hamper the growth of the market during the assessment period.
Segmentation:
The Global Particle Therapy Market has been segmented on the basis of type, product & service, cancer type, system, and application.On the basis of type, the market has been classified as proton therapy and heavy ion therapy. The market, by product and services, has been segmented into products and services. Products are further segmented into cyclotrons, synchrotrons, and synchrocyclotrons. Based on cancer type, the market has been segmented into prostate cancer, lung cancer, pediatric cancer, head and neck cancer, breast cancer, and others. The market, by system, has been segmented into multi-room systems and single-room systems. On the basis of application, the market has been classified as treatment applications and research applications. The pediatric cancer segment is expected to hold the largest market share of the particle therapy market, by cancer type, during the forecast period. Also, research applications to register the highest CAGR in the global particle therapy market during the forecast period.
The market has been segmented, by region, into the Americas, Europe, Asia-Pacific, and the Middle East & Africa. The particle therapy market in the Americas has further been segmented into North America and South America, with the North American market divided into the US and Canada. The European particle therapy market has been segmented into Western Europe and Eastern Europe. Western Europe has further been classified as Germany, France, the UK, Italy, Spain, and the rest of Western Europe. The particle therapy market in Asia-Pacific has been segmented into Japan, China, India, South Korea, Australia, and the rest of Asia-Pacific. The particle therapy market in the Middle East & Africa has been segmented into the Middle East and Africa.
Regional Market Summary
Global Particle Therapy Market Share, by Region, 2017 (%)
Source: MRFR Analysis
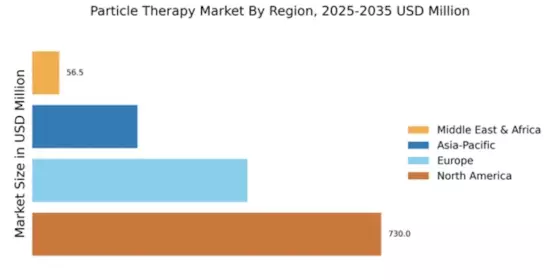
The Americas are likely to dominate the global particle therapy market owing to the rising prevalence of cancer patient, increasing funding & investments by manufacturer, and government focused for establishment of centers for treatment. According to the U.S. Department of Health and Human Services, in 2018, around 1,735,350 new cases of cancer will be diagnosed in the United States and 609,640 people will die from the disease.
The European market is expected to be the second-largest Particle Therapy market. The market growth in this region can be attributed to government funding and support of the healthcare sector coupled with increasing research and development. Moreover, favorable reimbursement policies in European countries are contributing to the growth of the market in this region.
Asia-Pacific is expected to be the fastest-growing particle therapy market during the forecast period owing to the increasing prevalence of cancer, rising investments in healthcare and expansions by market players in the region. Also, country such as India and China are considering fastest growing region due to the presence of huge patient population. Moreover, the government of these countries are open to adopt new technology, and best treatment option from a developed country. According to the International Agency for Research on Cancer, in 2018, India has a prevalence of 173.5 cancer patients per 100,000 population. Moreover, in China, the prevalence rate of cancer was 377.6 patients per 100,000 population in 2018.
The market in the Middle East & Africa is expected to account for the smallest share of the global Particle Therapy market due to an underdeveloped healthcare sector, lack of technical knowledge, and poor medical facilities.
Key Players
Some of the key players in the global particle therapy market are Advanced Oncotherapy PLC., Danfysik A/S, Hitachi, Ltd., Ion Beam Applications Sa (IBA), Mevion Medical Systems, Inc., Optivus Proton Therapy, Inc., Protom International, Inc., Provision Healthcare, LLC, Sumitomo Heavy Industries, Ltd., Varian Medical Systems, Inc.
Global Particle Therapy Market, by Type:
Global Particle Therapy Market, by Product & Service:
Global Particle Therapy Market, by Cancer Type:
Global Particle Therapy Market, by System:
Global Particle Therapy Market, by Application:
Global Particle Therapy Market, by Region:
Company Profiles:
Intended Audience:
Frequently Asked Questions (FAQ) :
The latest valuation of the particle therapy market in 2017 was USD 790.45 million.
The forecasted CAGR for the particle therapy market is 9.1% for the duration of 2018 to 2023.
The particle therapy market would be driven by factors like rising cases of cancer, an increasing number of particle therapy center, low risk of treatment, and potential retreatment opportunity can trigger better market growth.
The pediatric cancer segment has the opportunity to register the highest growth in the particle therapy market.
The Americas has the setup to continue their domination of the particle therapy market.
Table of Contents:
Chapter 1. Report Prologue
Chapter 2. Market Introduction
2.1 Definition
2.2 Scope of the Study
2.2.1 Research Objective
2.2.2 Assumptions
2.2.3 Limitations
Chapter 3. Research Methodology
3.1 Introduction
3.2 Primary Research
3.3 Secondary Research
3.4 Market Size Estimation
Chapter 4. Market Dynamics
4.1 Drivers
4.2 Restraints
4.3 Opportunities
4.4 Challenges
4.5 Macroeconomic Indicators
4.6 Technology Trends & Assessment
Chapter 5. Market Factor Analysis
5.1 Porter’s Five Forces Analysis
5.1.1 Bargaining Power of Suppliers
5.1.2 Bargaining Power of Buyers
5.1.3 Threat of New Entrants
5.1.4 Threat of Substitutes
5.1.5 Intensity of Rivalry
5.2 Value Chain Analysis
5.3 Investment Feasibility Analysis
5.4 Pricing Analysis
Chapter 6. Global Particle Therapy Market, by Type
6.1 Introduction
6.2 Proton Therapy
Market Estimates & Forecast, by Region, 2020-2027
Market Estimates & Forecast, by Country, 2020-2027
6.3 Heavy Ion Therapy
Market Estimates & Forecast, by Region, 2020-2027
Market Estimates & Forecast, by Country, 2020-2027
Chapter 7. Global Particle Therapy Market, by Product & Service
7.1 Introduction
7.2 Products
7.2.1 Cyclotrons
Market Estimates & Forecast, by Region, 2020-2027
Market Estimates & Forecast, by Country, 2020-2027
7.2.2 Synchrotrons
Market Estimates & Forecast, by Region, 2020-2027
Market Estimates & Forecast, by Country, 2020-2027
7.2.3 Synchrocyclotrons
Market Estimates & Forecast, by Region, 2020-2027
Market Estimates & Forecast, by Country, 2020-2027
7.3 Services
Market Estimates & Forecast, by Region, 2020-2027
Market Estimates & Forecast, by Country, 2020-2027
Chapter 8. Global Particle Therapy Market, by Cancer Type
8.1 Introduction
8.2 Prostate Cancer
Market Estimates & Forecast, by Region, 2020-2027
Market Estimates & Forecast, by Country, 2020-2027
8.3 Lung Cancer
Market Estimates & Forecast, by Region, 2020-2027
Market Estimates & Forecast, by Country, 2020-2027
8.4 Pediatric Cancer
Market Estimates & Forecast, by Region, 2020-2027
Market Estimates & Forecast, by Country, 2020-2027
8.5 Head and Neck Cancer
Market Estimates & Forecast, by Region, 2020-2027
Market Estimates & Forecast, by Country, 2020-2027
8.6 Breast Cancer
Market Estimates & Forecast, by Region, 2020-2027
Market Estimates & Forecast, by Country, 2020-2027
8.7 Others
Market Estimates & Forecast, by Region, 2020-2027
Market Estimates & Forecast, by Country, 2020-2027
Chapter 9. Global Particle Therapy Market, by System
9.1 Introduction
9.2 Multi-Room Systems
Market Estimates & Forecast, by Region, 2020-2027
Market Estimates & Forecast, by Country, 2020-2027
9.3 Single-Room Systems
Market Estimates & Forecast, by Region, 2020-2027
Market Estimates & Forecast, by Country, 2020-2027
Chapter 10. Global Particle Therapy Market, by Application
10.1 Introduction
10.2 Treatment Applications
Market Estimates & Forecast, by Region, 2020-2027
Market Estimates & Forecast, by Country, 2020-2027
10.3 Research Applications
Market Estimates & Forecast, by Region, 2020-2027
Market Estimates & Forecast, by Country, 2020-2027
Chapter 11. Global Particle Therapy Market, by Region
11.1 Introduction
11.2 Americas
11.2.1 North America
11.2.1.1 US
11.2.1.2 Canada
11.2.2 South America
11.3 Europe
11.3.1 Western Europe
11.3.1.1 Germany
11.3.1.2 France
11.3.1.3 Italy
11.3.1.4 Spain
11.3.1.5 UK
11.3.1.6 Rest of Western Europe
11.3.2 Eastern Europe
11.4 Asia-Pacific
11.4.1 Japan
11.4.2 China
11.4.3 India
11.4.4 Australia
11.4.5 South Korea
11.4.6 Rest of Asia-Pacific
11.5 Middle East & Africa
11.5.1 Middle East
11.5.2 Africa
Chapter 12. Company Landscape
12.1 Introduction
12.2 Market Share Analysis
12.3 Key Development & Strategies
Chapter 13. Company Profiles
13.1 Advanced Oncotherapy PLC.
13.1.1 Company Overview
13.1.2 Product Overview
13.1.3 Financials Overview
13.1.4 Key Developments
13.1.5 SWOT Analysis
13.2 Danfysik A/S
13.2.1 Company Overview
13.2.2 Product Overview
13.2.3 Financial Overview
13.2.4 Key Developments
13.2.5 SWOT Analysis
13.3 Hitachi, Ltd.
13.3.1 Company Overview
13.3.2 Product Overview
13.3.3 Financial Overview
13.3.4 Key Development
13.3.5 SWOT Analysis
13.4 Ion Beam Applications Sa (IBA)
13.4.1 Company Overview
13.4.2 Technologys/Business Segment Overview
13.4.3 Financial Overview
13.4.4 Key Development
13.4.5 SWOT Analysis
13.5 Mevion Medical Systems, Inc.
13.5.1 Company Overview
13.5.2 Product Overview
13.5.3 Financial overview
13.5.4 Key Developments
13.5.5 SWOT Analysis
13.6 Optivus Proton Therapy, Inc.
13.6.1 Company Overview
13.6.2 Product Overview
13.6.3 Financial Overview
13.6.4 Key Developments
13.6.5 SWOT Analysis
13.7 Protom International, Inc.
13.7.1 Overview
13.7.2 Product Overview
13.7.3 Financial Overview
13.7.4 Key Developments
13.7.5 SWOT Analysis
13.8 Provision Healthcare, LLC
13.8.1 Overview
13.8.2 Product/ Technology Overview
13.8.3 Financials
13.8.4 Key Developments
13.8.5 SWOT Analysis
13.9 Sumitomo Heavy Industries, Ltd.
13.9.1 Overview
13.9.2 Product Overview
13.9.3 Financials
13.9.4 Key Developments
13.9.5 SWOT Analysis
13.10 Varian Medical Systems, Inc.
13.10.1 Overview
13.10.2 Product Overview
13.10.3 Financials
13.10.4 Key Developments
13.10.5 SWOT Analysis
13.11 Others
Chapter 14. MRFR Conclusion
14.1 Key Findings
14.1.1 From CEO’s Viewpoint
14.1.2 Unmet Needs of the Market
14.2 Key Companies to Watch
14.3 Predictions for the Particle Therapy Industry
Chapter 15. Appendix
LIST OF TABLES
Table 1 Global Particle Therapy Market Synopsis, 2020-2027
Table 2 Global Particle Therapy Market Estimates and Forecast, 2020-2027 (USD Million)
Table 3 Global Particle Therapy Market, by Region, 2020-2027 (USD Million)
Table 4 Global Particle Therapy Market, by Type, 2020-2027 (USD Million)
Table 5 Global Particle Therapy Market, by Product & Service, 2020-2027 (USD Million)
Table 6 Global Particle Therapy Market, by Cancer Type, 2020-2027 (USD Million)
Table 7 Global Particle Therapy Market, by System, 2020-2027 (USD Million)
Table 8 Global Particle Therapy Market, by Application, 2020-2027 (USD Million)
Table 9 North America: Particle Therapy Market, by Type, 2020-2027 (USD Million)
Table 10 North America: Particle Therapy Market, by Product & Service, 2020-2027 (USD Million)
Table 11 North America: Particle Therapy Market, by Cancer Type, 2020-2027 (USD Million)
Table 12 North America: Particle Therapy Market, by System, 2020-2027 (USD Million)
Table 13 Table 9 North America: Particle Therapy Market, by Application, 2020-2027 (USD Million)
Table 14 US: Particle Therapy Market, by Type, 2020-2027 (USD Million)
Table 15 US: Particle Therapy Market, by Product & Service, 2020-2027 (USD Million)
Table 16 US: Particle Therapy Market, by Cancer Type, 2020-2027 (USD Million)
Table 17 US: Particle Therapy Market, by System, 2020-2027 (USD Million)
Table 18 US: Particle Therapy Market, by Application, 2020-2027 (USD Million)
Table 19 Canada: Particle Therapy Market,by Type, 2020-2027 (USD Million)
Table 20 Canada: Particle Therapy Market, by Product & Service, 2020-2027 (USD Million)
Table 21 Canada: Particle Therapy Market, by Cancer Type, 2020-2027 (USD Million)
Table 22 Canada: Particle Therapy Market, by System, 2020-2027 (USD Million)
Table 23 Canada: Particle Therapy Market, by Application, 2020-2027 (USD Million)
Table 24 South America: Particle Therapy Market, by Type, 2020-2027 (USD Million)
Table 25 South America: Particle Therapy Market, by Product & Service, 2020-2027 (USD Million)
Table 26 South America: Particle Therapy Market, by Cancer Type, 2020-2027 (USD Million)
Table 27 South America: Particle Therapy Market, by System, 2020-2027 (USD Million)
Table 28 South America: Particle Therapy Market, by Application, 2020-2027 (USD Million)
Table 29 Europe: Particle Therapy Market, by Type, 2020-2027 (USD Million)
Table 30 Europe: Particle Therapy Market, by Product & Service, 2020-2027 (USD Million)
Table 31 Europe: Particle Therapy Market, by Cancer Type, 2020-2027 (USD Million)
Table 32 Europe: Particle Therapy Market, by System, 2020-2027 (USD Million)
Table 33 Europe: Particle Therapy Market, by Application, 2020-2027 (USD Million)
Table 34 Western Europe: Particle Therapy Market, by Type, 2020-2027 (USD Million)
Table 35 Western Europe: Particle Therapy Market, by Product & Service, 2020-2027 (USD Million)
Table 36 Western Europe: Particle Therapy Market, by Cancer Type, 2020-2027 (USD Million)
Table 37 Western Europe: Particle Therapy Market, by System, 2020-2027 (USD Million)
Table 38 Western Europe: Particle Therapy Market, by Application, 2020-2027 (USD Million)
Table 39 Eastern Europe: Particle Therapy Market, by Type, 2020-2027 (USD Million)
Table 40 Eastern Europe: Particle Therapy Market, by Product & Service, 2020-2027 (USD Million)
Table 41 Eastern Europe: Particle Therapy Market, by Cancer Type, 2020-2027 (USD Million)
Table 42 Eastern Europe: Particle Therapy Market, by System, 2020-2027 (USD Million)
Table 43 Eastern Europe: Particle Therapy Market, by Application, 2020-2027 (USD Million)
Table 44 Asia-Pacific: Particle Therapy Market, by Type, 2020-2027 (USD Million)
Table 45 Asia-Pacific: Particle Therapy Market, by Product & Service, 2020-2027 (USD Million)
Table 46 Asia-Pacific: Particle Therapy Market, by Cancer Type, 2020-2027 (USD Million)
Table 47 Asia-Pacific: Particle Therapy Market, by System, 2020-2027 (USD Million)
Table 48 Asia-Pacific: Particle Therapy Market, by Application, 2020-2027 (USD Million)
Table 49 Middle East & Africa: Particle Therapy Market, by Type, 2020-2027 (USD Million)
Table 50 Middle East & Africa: Particle Therapy Market, by Product & Service, 2020-2027 (USD Million)
Table 51 Middle East & Africa: Particle Therapy Market, by Cancer Type, 2020-2027 (USD Million)
Table 52 Middle East & Africa: Particle Therapy Market, by System, 2020-2027 (USD Million)
Table 53 Middle East & Africa: Particle Therapy Market, by Application, 2020-2027 (USD Million)
LIST OF FIGURES
Figure 1 Research Process
Figure 2 Segmentation for Global Particle Therapy Market
Figure 3 Segmentation Market Dynamics for Global Particle Therapy Market
Figure 4 Global Particle Therapy Market Share, by Type, 2020
Figure 5 Global Particle Therapy Market Share, by Product & Service, 2020
Figure 6 Global Particle Therapy Market Share, by Cancer Type, 2020
Figure 7 Global Particle Therapy Market Share, by System, 2020
Figure 8 Global Particle Therapy Market Share, by Application, 2020
Figure 9 Global Particle Therapy Market Share, by Region, 2020
Figure 10 North America: Particle Therapy Market Share, by Country, 2020
Figure 11 Europe: Particle Therapy Market Share, by Country, 2020
Figure 12 Asia-Pacific: Particle Therapy Market Share, by Country, 2020
Figure 13 Middle East & Africa: Particle Therapy Market Share, by Region, 2020
Figure 14 Global Particle Therapy Market: Company Share Analysis, 2020 (%)
Figure 15 Advanced Oncotherapy PLC.: Key Financials
Figure 16 Advanced Oncotherapy PLC.: Segmental Revenue
Figure 17 Advanced Oncotherapy PLC.: Geographical Revenue
Figure 18 Danfysik A/S: Key Financials
Figure 19 Danfysik A/S: Segmental Revenue
Figure 20 Danfysik A/S: Geographical Revenue
Figure 21 Hitachi, Ltd.: Key Financials
Figure 22 Hitachi, Ltd.: Segmental Revenue
Figure 23 Hitachi, Ltd.: Geographical Revenue
Figure 24 Ion Beam Applications Sa (IBA): Key Financials
Figure 25 Ion Beam Applications Sa (IBA): Segmental Revenue
Figure 26 Ion Beam Applications Sa (IBA): Geographical Revenue
Figure 27 Mevion Medical Systems, Inc.: Key Financials
Figure 28 Mevion Medical Systems, Inc.: Segmental Revenue
Figure 29 Mevion Medical Systems, Inc.: Geographical Revenue
Figure 30 Optivus Proton Therapy, Inc.: Key Financials
Figure 31 Optivus Proton Therapy, Inc.: Segmental Revenue
Figure 32 Optivus Proton Therapy, Inc.: Geographical Revenue
Figure 33 Protom International, Inc.: Key Financials
Figure 34 Protom International, Inc.: Segmental Revenue
Figure 35 Protom International, Inc.: Geographical Revenue
Figure 36 Provision Healthcare, LLC: Key Financials
Figure 37 Provision Healthcare, LLC: Segmental Revenue
Figure 38 Provision Healthcare, LLC: Geographical Revenue
Figure 39 Sumitomo Heavy Industries, Ltd.: Key Financials
Figure 40 Sumitomo Heavy Industries, Ltd.: Segmental Revenue
Figure 41 Sumitomo Heavy Industries, Ltd.: Geographical Revenue
Figure 42 Varian Medical Systems, Inc.: Key Financials
Figure 43 Varian Medical Systems, Inc.: Segmental Revenue
Figure 44 Varian Medical Systems, Inc.: Geographical Revenue