Parenteral Nutrition Market (2026 - 2035)

ID: MRFR/HC/41726-HCR 111 Pages Rahul Gotadki Last Updated: September 17, 2026
Parenteral Nutrition Market Research Report: Size, Share, Trend Analysis By Product Type (Total Parenteral Nutrition, Partial Parenteral Nutrition, Intravenous Fat Emulsions, Amino Acid Solutions, Carbohydrates Solutions), By Route of Administration (Central Venous Catheter, Peripheral Venous Catheter, Implantable Port), By End Users (Hospitals, Homecare Settings, Ambulatory Surgical Centers, Nursing Facilities), By Component (Amino Acids, Dextrose, Lipids, Vitamins, Electrolytes) andBy Regional (North America, Europe, South America, Asia Pacific, Middle East and Africa) - Growth Outlook & Industry Forecast 2025 To 2035
Parenteral Nutrition Market
Market Size
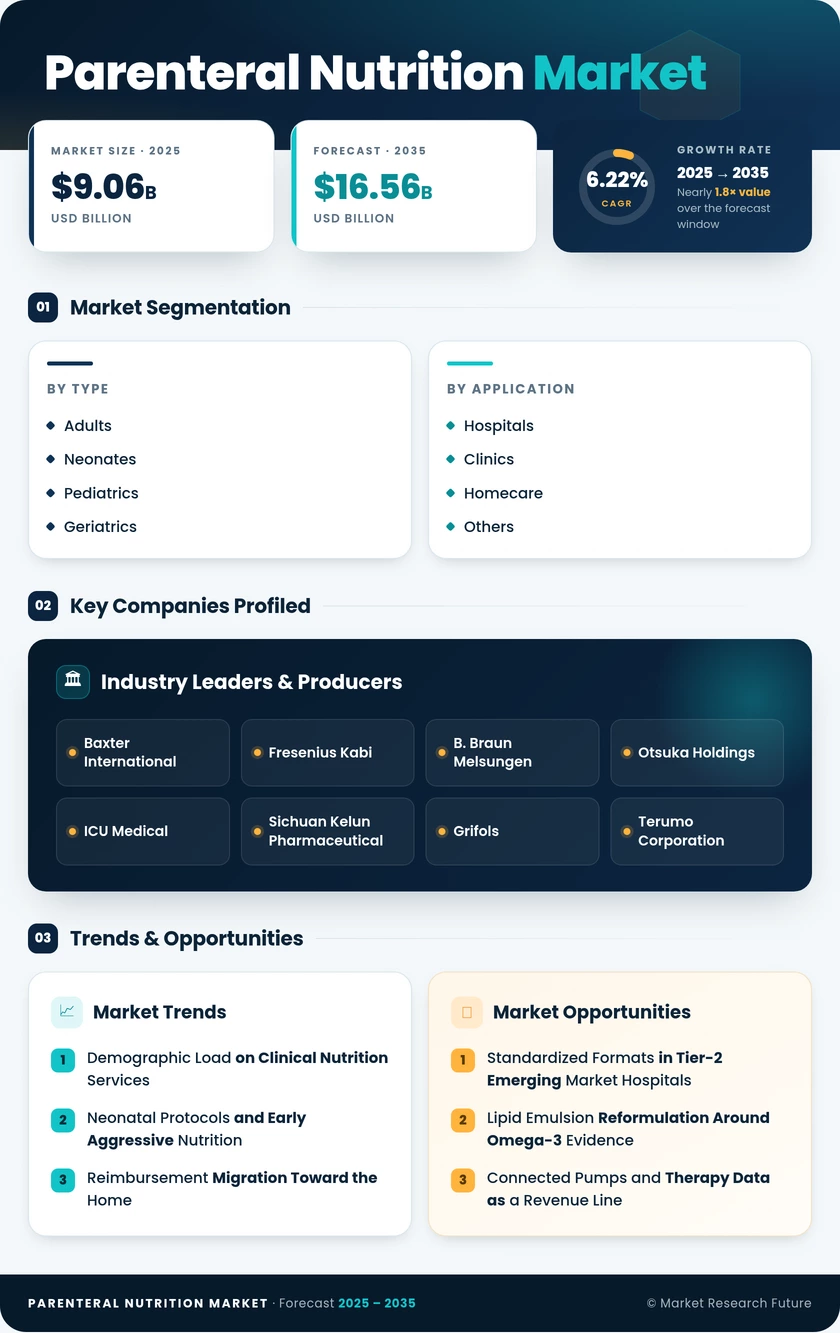
Forecast Period2026-2035
CAGR (2026-2035)6.22%
2025 Market SizeUSD 9.06 Billion
2035 Market SizeUSD 16.56 Billion
Key Players
Baxter International
Fresenius Kabi
B. Braun Melsungen
Otsuka Holdings
ICU Medical
Sichuan Kelun Pharmaceutical
Opportunities
  • Standardized Formats in Tier-2 Emerging Market Hospitals
  • Lipid Emulsion Reformulation Around Omega-3 Evidence
  • Connected Pumps and Therapy Data as a Revenue Line
  1. 1 Market Overview |
    1. 1.1 Study Assumptions & Market Definition |
    2. 1.2 Scope of the Study |
    3. 1.3 Research Methodology |
    4. 1.4 Market Summary
  2. 2 Key Report Takeaways |
    1. 2.1 By Nutrition Type |
    2. 2.2 By Patient Type and End-User |
    3. 2.3 By Region
  3. 3 Market Size & Forecast (2021–2035) |
    1. 3.1 Historical Market Size (2021–2024) |
    2. 3.2 Base Year Analysis (2025) |
    3. 3.3 Current & Forecast Market Size (2026–2035) |
    4. 3.4 Year-over-Year Growth Analysis
  4. 4 Market Drivers Analysis |
    1. 4.1 Demographic Load on Clinical Nutrition Services |
    2. 4.2 Neonatal Protocols and Early Aggressive Nutrition |
    3. 4.3 Reimbursement Migration Toward the Home |
    4. 4.4 Format Standardisation and Pharmacy Economics
  5. 5 Market Restraints Analysis |
    1. 5.1 Infection Risk as a Structural Ceiling |
    2. 5.2 Input Concentration and Price Volatility |
    3. 5.3 The Enteral-First Reflex
  6. 6 Market Opportunity Analysis |
    1. 6.1 Standardized Formats in Tier-2 Emerging Market Hospitals |
    2. 6.2 Lipid Emulsion Reformulation Around Omega-3 Evidence |
    3. 6.3 Connected Pumps and Therapy Data as a Revenue Line |
    4. 6.4 Intestinal Failure Centres of Excellence |
    5. 6.5 Compounding Automation for Mid-Sized Systems |
    6. 6.6 Industry Value Chain Analysis |
    7. 6.7 Porter's Five Forces Analysis
  7. 7 Regional Analysis |
    1. 7.1 North America | |
      1. 7.1.1 United States | |
      2. 7.1.2 Canada | |
      3. 7.1.3 Mexico |
    2. 7.2 Europe | |
      1. 7.2.1 Germany | |
      2. 7.2.2 United Kingdom | |
      3. 7.2.3 France | |
      4. 7.2.4 Italy | |
      5. 7.2.5 Spain | |
      6. 7.2.6 Nordic Countries | |
      7. 7.2.7 Russia | |
      8. 7.2.8 Rest of Europe |
    3. 7.3 Asia-Pacific | |
      1. 7.3.1 China | |
      2. 7.3.2 India | |
      3. 7.3.3 Japan | |
      4. 7.3.4 South Korea | |
      5. 7.3.5 ASEAN | |
      6. 7.3.6 Rest of Asia-Pacific |
    4. 7.4 South America | |
      1. 7.4.1 Brazil | |
      2. 7.4.2 Argentina | |
      3. 7.4.3 Rest of South America |
    5. 7.5 Middle East & Africa | |
      1. 7.5.1 Saudi Arabia | |
      2. 7.5.2 UAE | |
      3. 7.5.3 South Africa | |
      4. 7.5.4 Egypt | |
      5. 7.5.5 Rest of Middle East & Africa
  8. 8 Future Outlook (2026–2035) |
    1. 8.1 Algorithmic Prescribing and Closed-Loop Monitoring |
    2. 8.2 Platform Economics in Outsourced Compounding |
    3. 8.3 Supply Sovereignty and Dual Sourcing |
    4. 8.4 Sustainability Pressure on Packaging and Cold Chain
  9. 9 Market Segmentation Analysis |
    1. 9.1 By Nutrition Type | |
      1. 9.1.1 Carbohydrates | |
      2. 9.1.2 Parenteral Lipid Emulsion | |
      3. 9.1.3 Single Dose Amino Acid Solution | |
      4. 9.1.4 Multi-Dose Amino Acid Solution | |
      5. 9.1.5 Trace Elements | |
      6. 9.1.6 Vitamins & Minerals | |
      7. 9.1.7 Electrolytes | |
      8. 9.1.8 Others |
    2. 9.2 By Patient Type | |
      1. 9.2.1 Neonates | |
      2. 9.2.2 Pediatrics | |
      3. 9.2.3 Adults | |
      4. 9.2.4 Geriatrics |
    3. 9.3 By End-User | |
      1. 9.3.1 Hospitals | |
      2. 9.3.2 Clinics | |
      3. 9.3.3 Homecare | |
      4. 9.3.4 Others
  10. 10 Competitive Landscape |
    1. 10.1 Market Concentration Analysis (2026) |
    2. 10.2 Competitive Benchmarking Matrix |
    3. 10.3 Company Profiles | |
      1. 10.3.1 Baxter International | |
      2. 10.3.2 Fresenius Kabi | |
      3. 10.3.3 B. Braun Melsungen | |
      4. 10.3.4 Otsuka Holdings | |
      5. 10.3.5 ICU Medical | |
      6. 10.3.6 Sichuan Kelun Pharmaceutical | |
      7. 10.3.7 Grifols | |
      8. 10.3.8 Terumo Corporation | |
      9. 10.3.9 Nestlé Health Science | |
      10. 10.3.10 Pfizer (Hospira) | |
      11. 10.3.11 CSL Vifor
  11. 11 Recent Developments & News
  12. 12 Report Scope & Methodology |
    1. 12.1 Study Period & Base Year |
    2. 12.2 Valuation Currency & Assumptions |
    3. 12.3 Abbreviations
  13. 13 Detailed Sources & Citations
  14. 14 Frequently Asked Questions
  15. 15 LIST OF TABLES |
  16. TABLE 1 Global Parenteral Nutrition Market Size & Forecast, by Revenue (USD Billion), 2021–2035 |
  17. TABLE 2 Global Parenteral Nutrition Market – Year-over-Year Growth Analysis, 2021–2035 |
  18. TABLE 3 Driver Impact Analysis – Global Parenteral Nutrition Market, 2026–2035 |
  19. TABLE 4 Restraint Impact Analysis – Global Parenteral Nutrition Market, 2026–2035 |
  20. TABLE 5 Global Parenteral Nutrition Market Size, by Region, 2021–2035 (USD Billion) |
  21. TABLE 6 North America Parenteral Nutrition Market Size, by Country, 2021–2035 (USD Billion) |
  22. TABLE 7 Europe Parenteral Nutrition Market Size, by Country, 2021–2035 (USD Billion) |
  23. TABLE 8 Asia-Pacific Parenteral Nutrition Market Size, by Country, 2021–2035 (USD Billion) |
  24. TABLE 9 South America Parenteral Nutrition Market Size, by Country, 2021–2035 (USD Billion) |
  25. TABLE 10 Middle East & Africa Parenteral Nutrition Market Size, by Country, 2021–2035 (USD Billion) |
  26. TABLE 11 Global Parenteral Nutrition Market Size, by Nutrition Type, 2021–2035 (USD Billion) |
  27. TABLE 12 Global Parenteral Nutrition Market Size, by Patient Type, 2021–2035 (USD Billion) |
  28. TABLE 13 Global Parenteral Nutrition Market Size, by End-User, 2021–2035 (USD Billion) |
  29. TABLE 14 North America Parenteral Nutrition Market Size, by Nutrition Type, 2021–2035 (USD Billion) |
  30. TABLE 15 North America Parenteral Nutrition Market Size, by Patient Type, 2021–2035 (USD Billion) |
  31. TABLE 16 North America Parenteral Nutrition Market Size, by End-User, 2021–2035 (USD Billion) |
  32. TABLE 17 Europe Parenteral Nutrition Market Size, by Nutrition Type, 2021–2035 (USD Billion) |
  33. TABLE 18 Europe Parenteral Nutrition Market Size, by Patient Type, 2021–2035 (USD Billion) |
  34. TABLE 19 Europe Parenteral Nutrition Market Size, by End-User, 2021–2035 (USD Billion) |
  35. TABLE 20 Asia-Pacific Parenteral Nutrition Market Size, by Nutrition Type, 2021–2035 (USD Billion) |
  36. TABLE 21 Asia-Pacific Parenteral Nutrition Market Size, by Patient Type, 2021–2035 (USD Billion) |
  37. TABLE 22 Asia-Pacific Parenteral Nutrition Market Size, by End-User, 2021–2035 (USD Billion) |
  38. TABLE 23 South America Parenteral Nutrition Market Size, by Nutrition Type, 2021–2035 (USD Billion) |
  39. TABLE 24 South America Parenteral Nutrition Market Size, by End-User, 2021–2035 (USD Billion) |
  40. TABLE 25 Middle East & Africa Parenteral Nutrition Market Size, by Nutrition Type, 2021–2035 (USD Billion) |
  41. TABLE 26 Middle East & Africa Parenteral Nutrition Market Size, by End-User, 2021–2035 (USD Billion) |
  42. TABLE 27 United States Parenteral Nutrition Market Size, by End-User, 2021–2035 (USD Billion) |
  43. TABLE 28 China Parenteral Nutrition Market Size, by Nutrition Type, 2021–2035 (USD Billion) |
  44. TABLE 29 India Parenteral Nutrition Market Size, by Patient Type, 2021–2035 (USD Billion) |
  45. TABLE 30 Germany Parenteral Nutrition Market Size, by End-User, 2021–2035 (USD Billion) |
  46. TABLE 31 Competitive Benchmarking Matrix – Global Parenteral Nutrition Market, 2026 |
  47. TABLE 32 Company Profiles – Key Players, Global Parenteral Nutrition Market |
  48. TABLE 33 Recent Developments & Strategic Announcements, 2023–2025 |
  49. TABLE 34 Report Scope & Methodology Summary |
  50. TABLE 35 Detailed Sources & Citations Index
  51. 16 LIST OF FIGURES |
  52. FIGURE 1 Global Parenteral Nutrition Market – Market Dynamics Overview (Drivers, Restraints, Opportunities) |
  53. FIGURE 2 Industry Value Chain Analysis – Raw Materials to Patient Delivery |
  54. FIGURE 3 Porter's Five Forces Analysis – Global Parenteral Nutrition Market |
  55. FIGURE 4 Global Market Size Trend Line, 2021–2035 (USD Billion) |
  56. FIGURE 5 Year-over-Year Growth Rate Curve, 2022–2035 (%) |
  57. FIGURE 6 Market Share by Nutrition Type, 2025 vs 2035 (%) |
  58. FIGURE 7 Market Share by Patient Type, 2025 vs 2035 (%) |
  59. FIGURE 8 Market Share by End-User, 2025 vs 2035 (%) |
  60. FIGURE 9 Regional Revenue Share Distribution, 2025 (%) |
  61. FIGURE 10 Regional CAGR Comparison, 2026–2035 (%) |
  62. FIGURE 11 North America Country-Level Revenue Split, 2025 (%) |
  63. FIGURE 12 Europe Country-Level Revenue Split, 2025 (%) |
  64. FIGURE 13 Asia-Pacific Country-Level Revenue Split, 2025 (%) |
  65. FIGURE 14 Competitive Landscape – Estimated Revenue Share Bands, 2026 (%) |
  66. FIGURE 15 Competitive Positioning Matrix – Portfolio Breadth vs Geographic Reach |
  67. FIGURE 16 Hospital vs Homecare Delivery Mix Shift, 2025–2035 (%) |
  68. FIGURE 17 Driver Impact Weighting Chart, 2026–2035 |
  69. FIGURE 18 Restraint Impact Weighting Chart, 2026–2035

Segmentation Quick Reference

DimensionSub-SegmentsDominant SegmentFastest Growing Segment
By Nutrition TypeCarbohydrates; Parenteral Lipid Emulsion; Single Dose Amino Acid Solution; Multi-Dose Amino Acid Solution; Trace Elements; Vitamins & Minerals; OthersSingle Dose Amino Acid SolutionParenteral Lipid Emulsion
By Patient TypeNeonates; Pediatrics; Adults; GeriatricsAdultsNeonates
By End-UserHospitals; Clinics; Homecare; OthersHospitalsHomecare
By RegionNorth America; Europe; Asia-Pacific; South America; Middle East & AfricaNorth AmericaAsia-Pacific


Market Segmentation Overview

By Nutrition Type

Sub-SegmentKey Trend
CarbohydratesDextrose concentration standardisation reduces compounding variability across formularies.
Parenteral Lipid EmulsionFish-oil and olive-oil blends displace pure soybean-oil formulations on outcome evidence.
Single Dose Amino Acid SolutionContamination-risk avoidance sustains premium over multi-dose presentations.
Multi-Dose Amino Acid SolutionRetained in high-throughput tertiary pharmacies where batch economics dominate
Trace ElementsLong-duration therapy guidelines mandate routine supplementation, lifting attach rates.
Vitamins & MineralsSingle-vial multivitamin formats simplify additive workflow and cut spiking errors.
OthersSpecialty electrolyte concentrates grow with renal- and hepatic-adjusted regimens.


Product mix, not volume, drives most of the value growth in this dimension. Amino acid solutions hold the largest revenue pool, while lipid emulsions deliver the steepest growth as reformulated blends command materially higher pricing per gram of delivered lipid.

By Patient Type

Sub-SegmentKey Trend
NeonatesEarly aggressive amino acid protocols raise per-patient consumption in Level III units.
PediatricsCongenital GI conditions and paediatric oncology sustain specialised formulation demand.
AdultsOncology and gastrointestinal surgery remain the dominant initiation pathways.
GeriatricsPost-surgical malnutrition and frailty extend average therapy duration.


Adults anchor absolute demand, but the neonatal cohort sets the growth pace because protocol adoption raises consumption independently of birth rates. Geriatric demand rises steadily as populations age across Japan, Italy, and Germany.

By End-User

Sub-SegmentKey Trend
HospitalsMulti-chamber bag conversion redirects pharmacy labour toward clinical verification.
ClinicsDay-oncology and ambulatory infusion centres absorb short-duration regimens.
HomecarePortable pumps and reimbursed professional services enable long-duration therapy outside acute wards.
OthersLong-term care and rehabilitation settings adopt simplified premixed formats.


Hospitals will retain majority share throughout the forecast, yet the structural story is migration outward. Homecare grows fastest wherever payers fund the professional services layer alongside the product itself.

By Region

Sub-SegmentKey Trend
North AmericaMature home infusion infrastructure plus onshoring of amino acid inputs
EuropeGuideline harmonisation and EU-preference procurement reshape tender scoring.
Asia-PacificVolume-based procurement compresses pricing while access expansion lifts volumes.
South AmericaLicensed third-party compounding centres consolidate SUS oncology demand.
Middle East & AfricaGulf hospital construction and Egyptian insurance rollout widen the base.


Regional divergence follows reimbursement design more than disease prevalence. Systems paying for home delivery compound faster; systems paying only for inpatient episodes grow at hospital-admission rates.




Download PDF ×

We do not share your information with anyone. However, we may send you emails based on your report interest from time to time. You may contact us at any time to opt-out.