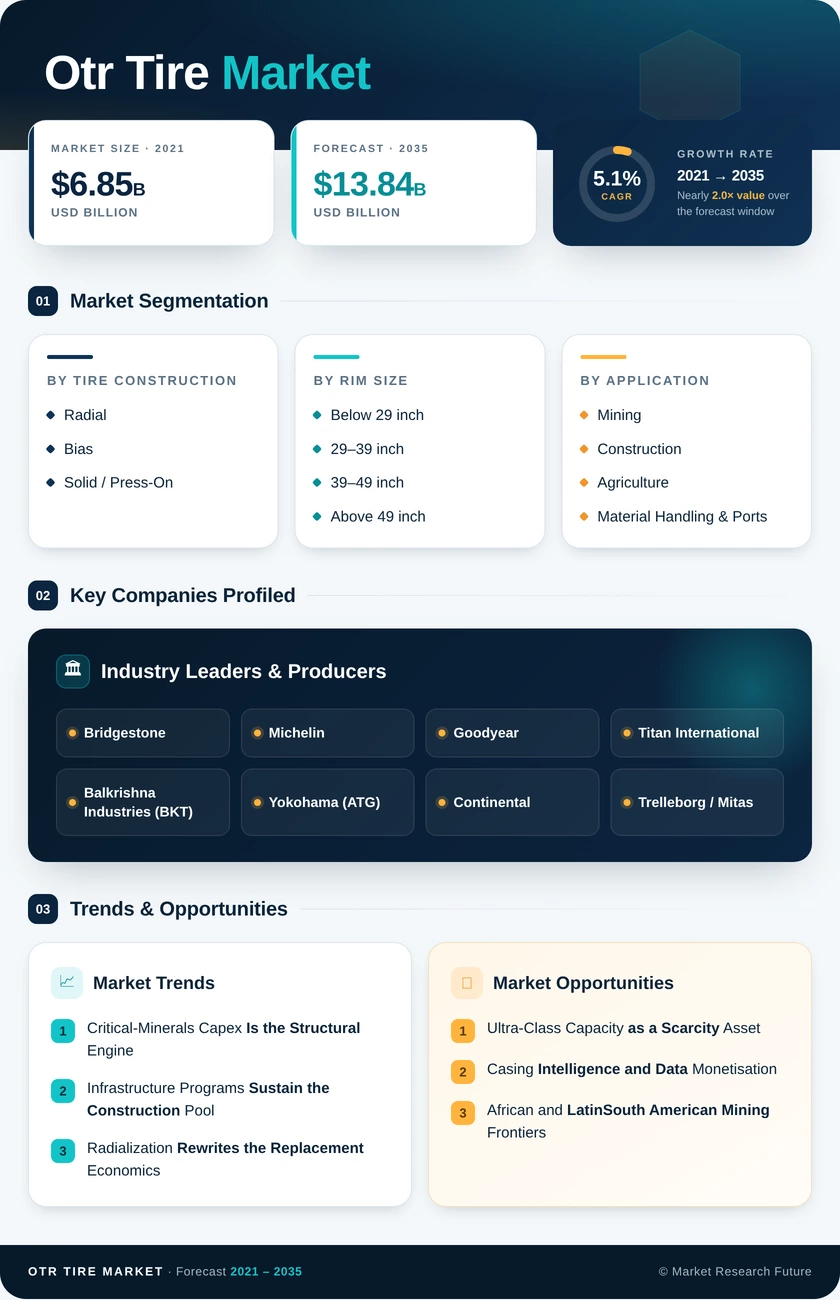
OTR Tire Market (2026 - 2035)

ID: MRFR/AT/25555-HCR 100 Pages Shubham Munde Last Updated: October 16, 2026
OTR Tire Market Research Report By Tire Construction (Radial, Bias, Solid / Press-On), By Rim Size (Below 29 inch, 29–39 inch, 39–49 inch, Above 49 inch (Ultra-Class)), By Application (Mining, Construction, Agriculture, Material Handling & Ports), By Sales Channel (OEM Fitment, Replacement / Aftermarket) and By Regional (North America, Europe, South America, Asia Pacific, Middle East and Africa) - Forecast to 2035
OTR Tire Market
Market Size
Forecast Period2026-2035
CAGR (2026-2035)5.1%
2025 Market SizeUSD 8.42 Billion
2035 Market SizeUSD 13.84 billion
Key Players
Bridgestone
Michelin
Goodyear
Titan International
Balkrishna Industries
Yokohama
Opportunities
  • Ultra-Class Capacity as a Scarcity Asset
  • Casing Intelligence and Data Monetisation
  • African and South American Mining Frontiers
  1. 1 Market Overview |
    1. 1.1 Study Assumptions & Market Definition |
    2. 1.2 Scope of the Study |
    3. 1.3 Research Methodology
  2. 2 Market Summary & Key Report Takeaways |
    1. 2.1 By Tire Construction |
    2. 2.2 By Application |
    3. 2.3 By Region
  3. 3 Global Market Size & Forecast (2021–2035) |
    1. 3.1 Historical Market Size (2021–2025) |
    2. 3.2 Current & Forecast Market Size (2026–2035) |
    3. 3.3 Market Size by Revenue (USD Billion) |
    4. 3.4 Year-over-Year Growth Analysis
  4. 4 Market Drivers Analysis |
    1. 4.1 Critical-Minerals Capex & Mining Investment |
    2. 4.2 Infrastructure & Construction Spending Programs |
    3. 4.3 Radialization of Emerging-Market Fleets |
    4. 4.4 Replacement-Cycle Density & Aftermarket Depth |
    5. 4.5 Autonomous & Electrified Haulage Adoption
  5. 5 Market Restraints Analysis |
    1. 5.1 Natural Rubber Price Volatility |
    2. 5.2 Retreading & Casing Life-Extension Substitution |
    3. 5.3 Commodity Downcycles & Mine Deferrals |
    4. 5.4 Ultra-Class Capacity & Lead-Time Constraints |
    5. 5.5 Traceability & Circularity Compliance Cost
  6. 6 Market Opportunity Analysis |
    1. 6.1 Ultra-Class Capacity as a Scarcity Asset |
    2. 6.2 Casing Intelligence & Data Monetisation |
    3. 6.3 African & South American Mining Frontiers |
    4. 6.4 Circularity & Recovered Materials |
    5. 6.5 Electrified Haulage Load Profiles |
    6. 6.6 Industry Value Chain Analysis |
    7. 6.7 Porter's Five Forces Analysis
  7. 7 Regional Analysis |
    1. 7.1 North America | |
      1. 7.1.1 United States | |
      2. 7.1.2 Canada | |
      3. 7.1.3 Mexico |
    2. 7.2 Europe | |
      1. 7.2.1 Germany | |
      2. 7.2.2 France | |
      3. 7.2.3 United Kingdom | |
      4. 7.2.4 Rest of Europe |
    3. 7.3 Asia-Pacific | |
      1. 7.3.1 China | |
      2. 7.3.2 India | |
      3. 7.3.3 Australia | |
      4. 7.3.4 Japan | |
      5. 7.3.5 Rest of Asia-Pacific |
    4. 7.4 South America | |
      1. 7.4.1 Brazil | |
      2. 7.4.2 Chile | |
      3. 7.4.3 Peru | |
      4. 7.4.4 Rest of South America |
    5. 7.5 Middle East & Africa | |
      1. 7.5.1 South Africa | |
      2. 7.5.2 Saudi Arabia | |
      3. 7.5.3 Zambia & DRC | |
      4. 7.5.4 Rest of Middle East & Africa
  8. 8 Future Outlook (2026–2035) |
    1. 8.1 Autonomous Operations & Wear Modelling |
    2. 8.2 Service Economics Over Product Economics |
    3. 8.3 Electrification Supercycle |
    4. 8.4 Disclosure as a Purchasing Criterion
  9. 9 Segmentation Analysis |
    1. 9.1 By Tire Construction | |
      1. 9.1.1 Radial | |
      2. 9.1.2 Bias | |
      3. 9.1.3 Solid / Press-On |
    2. 9.2 By Rim Size | |
      1. 9.2.1 Below 29 inch | |
      2. 9.2.2 29–39 inch | |
      3. 9.2.3 39–49 inch | |
      4. 9.2.4 Above 49 inch (Ultra-Class) |
    3. 9.3 By Application | |
      1. 9.3.1 Mining | |
      2. 9.3.2 Construction | |
      3. 9.3.3 Agriculture | |
      4. 9.3.4 Material Handling & Ports |
    4. 9.4 By Sales Channel | |
      1. 9.4.1 OEM Fitment | |
      2. 9.4.2 Replacement / Aftermarket
  10. 10 Competitive Landscape |
    1. 10.1 Market Share Analysis (2026) |
    2. 10.2 Competitive Benchmarking Matrix |
    3. 10.3 Company Profiles | |
      1. 10.3.1 Bridgestone | |
      2. 10.3.2 Michelin | |
      3. 10.3.3 Goodyear | |
      4. 10.3.4 Titan International | |
      5. 10.3.5 Balkrishna Industries (BKT) | |
      6. 10.3.6 Yokohama (ATG) | |
      7. 10.3.7 Continental | |
      8. 10.3.8 Trelleborg | |
      9. 10.3.9 Aeolus (Double Coin) | |
      10. 10.3.10 Techking
  11. 11 Recent Developments & News (2023–2025)
  12. 12 Report Scope & Methodology |
    1. 12.1 Study Period & Base Year |
    2. 12.2 Data Sources & Citations |
    3. 12.3 Abbreviations
  13. 13 Detailed Sources & Citations
  14. 14 Frequently Asked Questions (FAQs)
  15. 15 LIST OF TABLES
  16. 16 LIST OF FIGURES

Segmentation Quick Reference

DimensionSub-SegmentsDominant SegmentFastest Growing Segment
By Tire ConstructionRadial; Bias; Solid / Press-OnRadialRadial
By Rim SizeBelow 29 inch; 29–39 inch; 39–49 inch; Above 49 inch29–39 inchAbove 49 inch (Ultra-Class)
By ApplicationMining; Construction; Agriculture; Material Handling & PortsMiningConstruction
By Sales ChannelOEM Fitment; Replacement / AftermarketReplacement / AftermarketReplacement / Aftermarket
By RegionNorth America; Europe; Asia-Pacific; South America; Middle East & AfricaAsia-PacificMiddle East & Africa


Market Segmentation Overview

By Tire Construction

Sub-SegmentKey Trend
RadialSteel-belted casings expand share as fleets buy cost-per-hour rather than unit price
BiasRetains relevance in capital-constrained agricultural and light industrial fleets
Solid / Press-OnGrows with automated warehouse and container terminal handling equipment


Construction type increasingly acts as a proxy for buyer sophistication. Operators with digital fleet-management systems overwhelmingly specify radial; those without default to acquisition cost, which sustains bias volumes in South Asia, Africa and parts of South America well into the 2030s.

By Rim Size

Sub-SegmentKey Trend
Below 29 inchTracks agricultural mechanisation and compact equipment rental growth
29–39 inchHighest unit volumes; most exposed to value-tier price competition
39–49 inchBenefits from mid-tier quarry and contract mining fleet renewal
Above 49 inchCapacity-constrained premium band tied to ultra-class haul truck deliveries


Rim band effectively determines margin structure. The ultra-class band trades on qualified capacity scarcity, while mid-band products face the sharpest competitive pressure from export-oriented Asian producers.

By Application

Sub-SegmentKey Trend
MiningCritical-minerals demand sustains haul tonnage and replacement intervals
ConstructionPublic infrastructure disbursement drives short-cycle aftermarket demand
AgricultureMechanisation and radial conversion lift average selling prices
Material Handling & PortsTerminal automation raises specification standards and uptime requirements


Application mix explains why regional growth rates diverge so widely. Mining-weighted regions track commodity cycles; construction-weighted regions track fiscal policy, and the two rarely peak together.

By Sales Channel

Sub-SegmentKey Trend
OEM FitmentTendered on price; treated as an investment in future replacement share
Replacement / AftermarketCarries superior margin and expands with fleet utilisation hours


Channel economics reward patience. Manufacturers accept thin OEM margins to secure fitment position, then recover value across two or three replacement cycles supported by service and monitoring contracts.




Download PDF ×

We do not share your information with anyone. However, we may send you emails based on your report interest from time to time. You may contact us at any time to opt-out.