Optical Coherence Tomography Market (2026 - 2035)

ID: MRFR/HC/0820-CR 115 Pages Nidhi Mandole Last Updated: September 15, 2026
Optical Coherence Tomography Market Research Report Information By Technology (Sd-Oct and Swept-Source Oct), By Application (Cardiology, Ophthalmology, and Dermatology), By Type of Devices (Handheld, Tabletop, and Catheter-Based Oct Devices), And By Region (North America, Europe, Asia-Pacific, And Rest Of The World) - Growth & Industry Forecast 2025 To 2035
Optical Coherence Tomography Market
Market Size
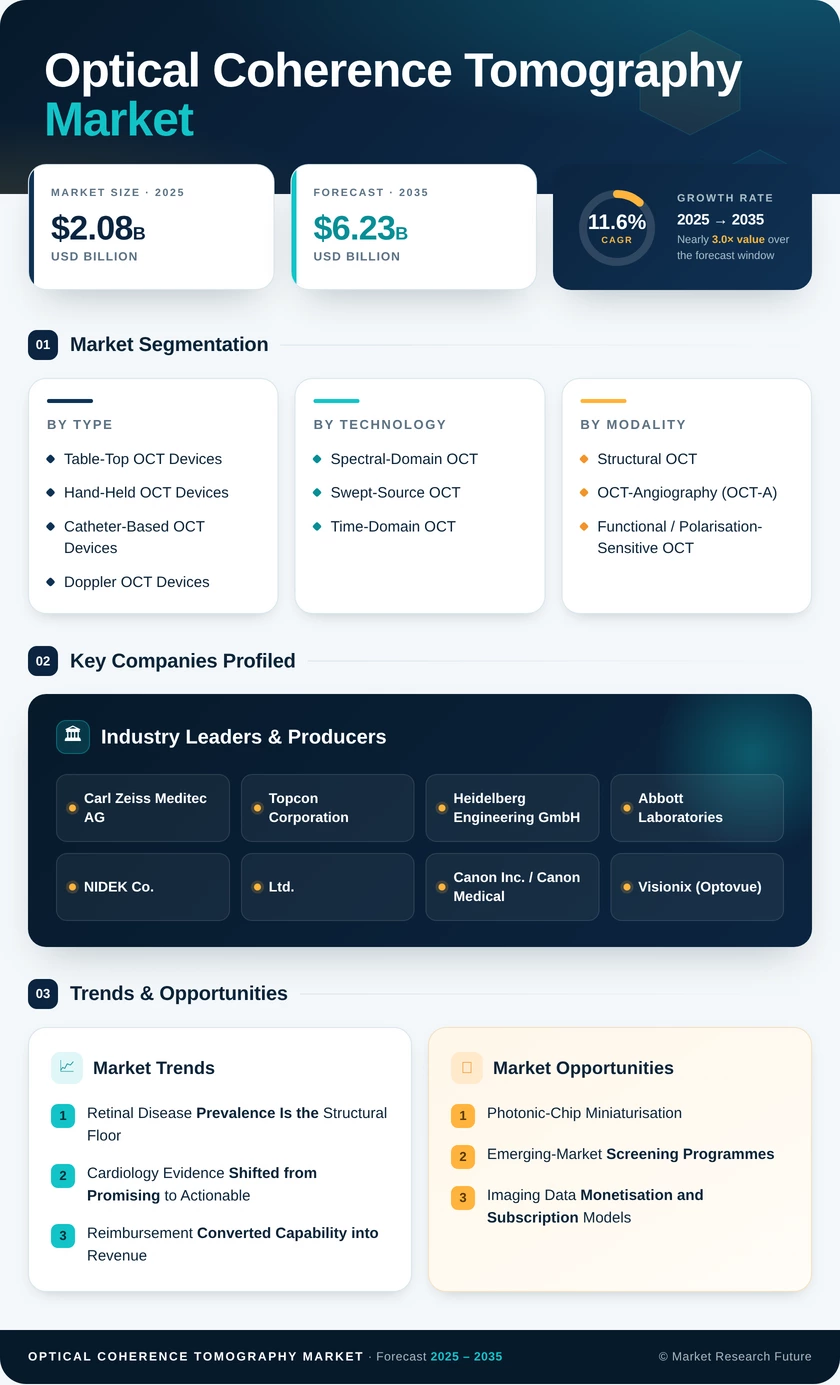
Forecast Period2026-2035
CAGR (2026-2035)11.6%
2025 Market SizeUSD 2.08 Billion
2035 Market SizeUSD 6.23 Billion
Key Players
Carl Zeiss Meditec AG
Topcon Corporation
Heidelberg Engineering GmbH
Abbott Laboratories
NIDEK Co., Ltd.
Canon Inc. / Canon Medical
Opportunities
  • Photonic-Chip Miniaturisation
  • Emerging-Market Screening Programmes
  • Imaging Data Monetisation and Subscription Models
  1. 1 Market Overview |
    1. 1.1 Study Assumptions & Market Definition |
    2. 1.2 Scope of the Study |
    3. 1.3 Research Methodology
  2. 2 Market Summary & Key Takeaways
  3. 3 Market Size & Forecast (2021–2035) |
    1. 3.1 Historical Market Size (2021–2025) |
    2. 3.2 Current & Forecast Market Size (2026–2035) |
    3. 3.3 Market Size by Revenue (USD Billion) |
    4. 3.4 Year-over-Year Growth Analysis
  4. 4 Market Drivers Analysis |
    1. 4.1 Rising Retinal Disease Burden |
    2. 4.2 Intravascular Imaging Evidence in Complex PCI |
    3. 4.3 Reimbursement Pathway Expansion |
    4. 4.4 AI-Enabled Interpretation & Workflow Automation |
    5. 4.5 Swept-Source & High-Speed Platform Transition |
    6. 4.6 Community Optometry & Primary-Care Deployment |
    7. 4.7 Handheld & Point-of-Care Form Factors
  5. 5 Market Restraints Analysis |
    1. 5.1 Capital Cost Barriers in Emerging Markets |
    2. 5.2 Reimbursement Gaps Outside Ophthalmology |
    3. 5.3 Slow Catheter-Lab Adoption |
    4. 5.4 Trained Interpretation Capacity Shortfall |
    5. 5.5 Cybersecurity & Imaging Data Governance
  6. 6 Market Opportunity Analysis |
    1. 6.1 Photonic-Chip Miniaturisation |
    2. 6.2 Emerging-Market Screening Programmes |
    3. 6.3 Imaging Data Monetisation & Subscription Models |
    4. 6.4 Non-Destructive Industrial Inspection |
    5. 6.5 Home Monitoring for Chronic Retinal Disease |
    6. 6.6 Industry Value Chain Analysis |
    7. 6.7 Porter's Five Forces Analysis
  7. 7 Regional Analysis |
    1. 7.1 North America | |
      1. 7.1.1 US | |
      2. 7.1.2 Canada | |
      3. 7.1.3 Mexico |
    2. 7.2 Europe | |
      1. 7.2.1 Germany | |
      2. 7.2.2 UK | |
      3. 7.2.3 France | |
      4. 7.2.4 Italy | |
      5. 7.2.5 Spain | |
      6. 7.2.6 Nordic Countries | |
      7. 7.2.7 Russia | |
      8. 7.2.8 Rest of Europe |
    3. 7.3 Asia-Pacific | |
      1. 7.3.1 China | |
      2. 7.3.2 India | |
      3. 7.3.3 Japan | |
      4. 7.3.4 South Korea | |
      5. 7.3.5 ASEAN | |
      6. 7.3.6 Rest of Asia-Pacific |
    4. 7.4 South America | |
      1. 7.4.1 Brazil | |
      2. 7.4.2 Argentina | |
      3. 7.4.3 Rest of South America |
    5. 7.5 Middle East & Africa | |
      1. 7.5.1 Saudi Arabia | |
      2. 7.5.2 UAE | |
      3. 7.5.3 South Africa | |
      4. 7.5.4 Egypt | |
      5. 7.5.5 Rest of Middle East & Africa
  8. 8 Future Outlook (2026–2035) |
    1. 8.1 Autonomous Interpretation at Clinical Scale |
    2. 8.2 Platform Economics & Recurring Revenue |
    3. 8.3 Multimodal Convergence in Cardiology |
    4. 8.4 Cost Curve & Access Inversion
  9. 9 Segmentation Analysis |
    1. 9.1 By Device Type | |
      1. 9.1.1 Hand-Held OCT Devices | |
      2. 9.1.2 Table-Top OCT Devices | |
      3. 9.1.3 Catheter-Based OCT Devices | |
      4. 9.1.4 Doppler OCT Devices |
    2. 9.2 By Technology | |
      1. 9.2.1 Time-Domain OCT | |
      2. 9.2.2 Spectral-Domain OCT | |
      3. 9.2.3 Swept-Source OCT |
    3. 9.3 By Modality | |
      1. 9.3.1 Structural OCT | |
      2. 9.3.2 OCT-Angiography (OCT-A) | |
      3. 9.3.3 Functional / Polarisation-Sensitive OCT |
    4. 9.4 By End-User | |
      1. 9.4.1 Hospitals & Tertiary Care Centres | |
      2. 9.4.2 Specialty Clinics & Ambulatory Surgery Centres | |
      3. 9.4.3 Research & Academic Institutes | |
      4. 9.4.4 Others |
    5. 9.5 By Sales Channel | |
      1. 9.5.1 Direct Sales | |
      2. 9.5.2 Distributors / Third-Party
  10. 10 Competitive Landscape |
    1. 10.1 Market Share Analysis (2026) |
    2. 10.2 Competitive Benchmarking Matrix |
    3. 10.3 Company Profiles | |
      1. 10.3.1 Carl Zeiss Meditec AG | |
      2. 10.3.2 Topcon Corporation | |
      3. 10.3.3 Heidelberg Engineering GmbH | |
      4. 10.3.4 Abbott Laboratories | |
      5. 10.3.5 NIDEK Co., Ltd. | |
      6. 10.3.6 Canon Inc. / Canon Medical Systems | |
      7. 10.3.7 Visionix (Optovue) | |
      8. 10.3.8 Nikon Corporation (Optos plc) | |
      9. 10.3.9 Leica Microsystems (Danaher) | |
      10. 10.3.10 Terumo Corporation | |
      11. 10.3.11 Thorlabs Inc. | |
      12. 10.3.12 OPTOPOL Technology S.A.
  11. 11 Recent Developments & News
  12. 12 Report Scope & Methodology |
    1. 12.1 Study Period & Base Year |
    2. 12.2 Data Sources & Citations |
    3. 12.3 Abbreviations
  13. 13 Detailed Sources & Citations
  14. 14 Frequently Asked Questions
  15. 15 LIST OF TABLES |
  16. TABLE 1 Global Optical Coherence Tomography Market Size & Forecast, by Revenue (USD Billion), 2021–2035 |
  17. TABLE 2 Global Optical Coherence Tomography Market – Year-over-Year Growth Analysis, 2021–2035 |
  18. TABLE 3 Driver Impact Analysis – Global Optical Coherence Tomography Market |
  19. TABLE 4 Restraint Impact Analysis – Global Optical Coherence Tomography Market |
  20. TABLE 5 Global Market Size, by Device Type, 2021–2035 (USD Billion) |
  21. TABLE 6 Global Market Size, by Technology, 2021–2035 (USD Billion) |
  22. TABLE 7 Global Market Size, by Modality, 2021–2035 (USD Billion) |
  23. TABLE 8 Global Market Size, by End-User, 2021–2035 (USD Billion) |
  24. TABLE 9 Global Market Size, by Sales Channel, 2021–2035 (USD Billion) |
  25. TABLE 10 Global Market Size, by Region, 2021–2035 (USD Billion) |
  26. TABLE 11 North America Market Size, by Country, 2021–2035 (USD Billion) |
  27. TABLE 12 Europe Market Size, by Country, 2021–2035 (USD Billion) |
  28. TABLE 13 Asia-Pacific Market Size, by Country, 2021–2035 (USD Billion) |
  29. TABLE 14 South America Market Size, by Country, 2021–2035 (USD Billion) |
  30. TABLE 15 Middle East & Africa Market Size, by Country, 2021–2035 (USD Billion) |
  31. TABLE 16 North America Market Size, by Device Type, 2021–2035 (USD Billion) |
  32. TABLE 17 North America Market Size, by Technology, 2021–2035 (USD Billion) |
  33. TABLE 18 North America Market Size, by Modality, 2021–2035 (USD Billion) |
  34. TABLE 19 North America Market Size, by End-User, 2021–2035 (USD Billion) |
  35. TABLE 20 Europe Market Size, by Device Type, 2021–2035 (USD Billion) |
  36. TABLE 21 Europe Market Size, by Technology, 2021–2035 (USD Billion) |
  37. TABLE 22 Europe Market Size, by Modality, 2021–2035 (USD Billion) |
  38. TABLE 23 Europe Market Size, by End-User, 2021–2035 (USD Billion) |
  39. TABLE 24 Asia-Pacific Market Size, by Device Type, 2021–2035 (USD Billion) |
  40. TABLE 25 Asia-Pacific Market Size, by Technology, 2021–2035 (USD Billion) |
  41. TABLE 26 Asia-Pacific Market Size, by Modality, 2021–2035 (USD Billion) |
  42. TABLE 27 Asia-Pacific Market Size, by End-User, 2021–2035 (USD Billion) |
  43. TABLE 28 South America Market Size, by Device Type, 2021–2035 (USD Billion) |
  44. TABLE 29 South America Market Size, by Technology, 2021–2035 (USD Billion) |
  45. TABLE 30 South America Market Size, by End-User, 2021–2035 (USD Billion) |
  46. TABLE 31 Middle East & Africa Market Size, by Device Type, 2021–2035 (USD Billion) |
  47. TABLE 32 Middle East & Africa Market Size, by Technology, 2021–2035 (USD Billion) |
  48. TABLE 33 Middle East & Africa Market Size, by End-User, 2021–2035 (USD Billion) |
  49. TABLE 34 United States Market Size, by Technology, 2021–2035 (USD Billion) |
  50. TABLE 35 United States Market Size, by End-User, 2021–2035 (USD Billion) |
  51. TABLE 36 China Market Size, by Technology, 2021–2035 (USD Billion) |
  52. TABLE 37 China Market Size, by End-User, 2021–2035 (USD Billion) |
  53. TABLE 38 India Market Size, by Technology, 2021–2035 (USD Billion) |
  54. TABLE 39 Japan Market Size, by Technology, 2021–2035 (USD Billion) |
  55. TABLE 40 Germany Market Size, by Technology, 2021–2035 (USD Billion) |
  56. TABLE 41 UK Market Size, by Technology, 2021–2035 (USD Billion) |
  57. TABLE 42 Competitive Benchmarking Matrix – Global Optical Coherence Tomography Market, 2026 |
  58. TABLE 43 Company Profiles – Key Players, Global Optical Coherence Tomography Market |
  59. TABLE 44 Recent Developments & Strategic Announcements, 2023–2026 |
  60. TABLE 45 Report Scope & Methodology Summary |
  61. TABLE 46 Detailed Sources & Citations
  62. 16 LIST OF FIGURES |
  63. FIGURE 1 Global Optical Coherence Tomography Market – Market Dynamics Overview |
  64. FIGURE 2 Industry Value Chain Analysis |
  65. FIGURE 3 Porter's Five Forces Analysis |
  66. FIGURE 4 Global Market Size Trend, 2021–2035 (USD Billion) |
  67. FIGURE 5 Year-over-Year Growth Rate Trend, 2022–2035 (%) |
  68. FIGURE 6 Driver Impact Weighting – Relative Contribution |
  69. FIGURE 7 Restraint Impact Weighting – Relative Drag |
  70. FIGURE 8 Market Share by Device Type, 2025 vs 2035 (%) |
  71. FIGURE 9 Market Share by Technology, 2025 vs 2035 (%) |
  72. FIGURE 10 Market Share by Modality, 2025 vs 2035 (%) |
  73. FIGURE 11 Market Share by End-User, 2025 (%) |
  74. FIGURE 12 Market Share by Sales Channel, 2025 (%) |
  75. FIGURE 13 Regional Market Share, 2025 (%) |
  76. FIGURE 14 Regional Market Share, 2035 (%) |
  77. FIGURE 15 Regional CAGR Comparison, 2026–2035 (%) |
  78. FIGURE 16 North America Country-Level Share, 2025 (%) |
  79. FIGURE 17 Europe Country-Level Share, 2025 (%) |
  80. FIGURE 18 Asia-Pacific Country-Level Share, 2025 (%) |
  81. FIGURE 19 Competitive Landscape – Estimated Revenue Share Bands, 2026 |
  82. FIGURE 20 Competitive Positioning Matrix – Capability vs Geographic Reach |
  83. FIGURE 21 Technology Transition Roadmap, 2026–2035

Segmentation Quick Reference

DimensionSub-SegmentsDominant SegmentFastest Growing Segment
By Device TypeHand-Held OCT Devices, Table-Top OCT Devices, Catheter-Based OCT Devices, Doppler OCT DevicesTable-Top OCT DevicesHand-Held OCT Devices
By TechnologyTime-Domain OCT, Spectral-Domain OCT, Swept-Source OCTSpectral-Domain OCTSwept-Source OCT
By ModalityStructural OCT, OCT-Angiography (OCT-A), Functional / Polarisation-Sensitive OCTStructural OCTOCT-Angiography (OCT-A)
By End-UserHospitals & Tertiary Care Centres, Specialty Clinics & Ambulatory Surgery Centres, Research & Academic Institutes, OthersHospitals & Tertiary Care CentresSpecialty Clinics & Ambulatory Surgery Centres
By Sales ChannelDirect Sales, Distributors / Third-PartyDirect SalesDistributors / Third-Party
By GeographyNorth America, Europe, Asia-Pacific, South America, Middle East & AfricaNorth AmericaAsia-Pacific


Market Segmentation Overview

By Device Type

Sub-SegmentKey Trend
Hand-Held OCT DevicesExpanding into neonatal, paediatric, and intraoperative settings inaccessible to chinrest platforms
Table-Top OCT DevicesRemains the specialist standard; differentiation shifting to software modules and normative databases
Catheter-Based OCT DevicesGrowing on complex-PCI evidence; per-procedure disposable economics dominate lifetime cost.
Doppler OCT DevicesConfined largely to research and specialty flow-assessment applications


Form factor is becoming a market-segmentation variable rather than a specification detail. Tabletop systems defend revenue through module attachment, while handheld devices are opening geographies and care settings that were structurally unaddressable a decade ago.

By Technology

Sub-SegmentKey Trend
Time-Domain OCTLegacy installed base in structural decline; replacement cycles favour successors
Spectral-Domain OCTLargest installed base; workhorse across retina, glaucoma, and anterior-segment workflows
Swept-Source OCTLonger-wavelength penetration and faster acquisition driving new-purchase preference


Scan speed has become the headline competitive metric, with cleared platforms now reaching 250 kHz for angiography acquisition. Faster capture reduces motion artefact and chair time simultaneously, which is why the technology transition is proceeding faster than pure image-quality arguments would predict.

By Modality

Sub-SegmentKey Trend
Structural OCTCore cross-sectional layer measurement; foundation of every clinical workflow
OCT-Angiography (OCT-A)Dye-free vascular visualisation; reimbursement recognition removed the last commercial barrier
Functional / Polarisation-Sensitive OCTEarly-stage tissue characterisation, largely research-confined today.


Angiography is the modality doing the most to reset purchase criteria, since it substitutes for an invasive dye-based procedure with meaningful patient risk. Acquisition-time reductions of roughly half have converted it from an occasional specialty test into a routine clinic capability.

By End-User

Sub-SegmentKey Trend
Hospitals & Tertiary Care CentresMultimodal platform requirements plus cardiology catheter-lab demand
Specialty Clinics & Ambulatory Surgery CentresHigh-throughput retina and glaucoma practice; strongest attachment to angiography modules
Research & Academic InstitutesNovel modality development and clinical-trial imaging endpoints
OthersOptometry, industrial inspection, and veterinary applications


Buying behaviour diverges sharply between hospital procurement — committee-driven, multi-year, service-contract sensitive — and specialty clinics, where a practice owner can approve a purchase against a modelled payback period. Vendors increasingly maintain separate commercial motions for each.

By Sales Channel

Sub-SegmentKey Trend
Direct SalesDominant in developed markets; enables service contract and software licensing attachment.
Distributors / Third-PartyPrimary route into emerging markets and mid-tier price segments


Direct coverage protects the recurring-revenue attachment that increasingly defines vendor economics, but it cannot reach the fragmented clinic base across South and Southeast Asia at acceptable cost. Distributor networks fill that gap, at the price of thinner margin and weaker data-ecosystem lock-in.




Download PDF ×

We do not share your information with anyone. However, we may send you emails based on your report interest from time to time. You may contact us at any time to opt-out.