Optical Character Recognition Market (2026 – 2035)

Optical Character Recognition Market Size, Share and Research Report By Component (Software, Services), By Deployment Mode (On-Premise, Cloud), By Technology (Conventional OCR, Intelligent Character Recognition (ICR), Optical Mark Recognition (OMR), Intelligent Word Recognition (IWR), Others), By Application (Invoice and Bill Processing, Identity Verification and KYC, Document Management and Archiving, Banking Cheque Processing, Packaging and Label Recognition, Others), By End-Use Industry (BFSI, Retail and E-Commerce, Government, Healthcare, Education, Transportation and Logistics, Manufacturing, Others) And By Region (North America, Europe, Asia-Pacific, And Rest Of The World) – Industry Forecast Till 2035
ID: MRFR/ICT/14669-HCR 128 Pages Kiran Jinkalwad, Aarti Dhapte Last Updated: October 27, 2026
Optical Character Recognition Market
Market Size
Forecast Period2026-2035
CAGR (2026-2035)16.15%
2025 Market SizeUSD 18.25 Billion
2035 Market SizeUSD 82.39 Billion
Key Players
Microsoft Corporation
Alphabet
Amazon Web Services
ABBYY
IBM Corporation
Adobe Inc.
Opportunities
  • Emerging-Market Identity and Public-Records Conversion
  • Vertical Template and Domain-Model Marketplaces
  • Anonymised Document Intelligence and Benchmarking Services

Optical Character Recognition Market Summary

The Optical Character Recognition Market reached USD 18.25 Billion in 2025 and opens the forecast window at USD 21.42 Billion in 2026, advancing to USD 82.39 Billion by 2035 at a 16.15% CAGR. Two catalysts anchor that trajectory. The European Union's AI Act, phased in from August 2024, obliges regulated entities to maintain auditable records of automated decisions, which pushes document capture out of shadow IT and into governed platforms [1]. Parallel to that, India's Digital Personal Data Protection framework and the Reserve Bank of India's video-KYC rules have made machine-read identity documents a compliance artifact rather than a convenience [2].

Rules-based template engines are giving way to transformer-based recognition stacks. Legacy zonal OCR systems, which required a fresh template for every vendor layout, are being retired in favour of multimodal models that read layout, glyph and semantics together. Microsoft, Google and Amazon collectively committed more than USD 190 billion in capital expenditure across 2024–2025, a share of which funds the inference capacity these document models consume [3]. Per-page processing costs have fallen sharply as a result, and the Optical Character Recognition Market has absorbed workloads that were economically unreachable in 2020.

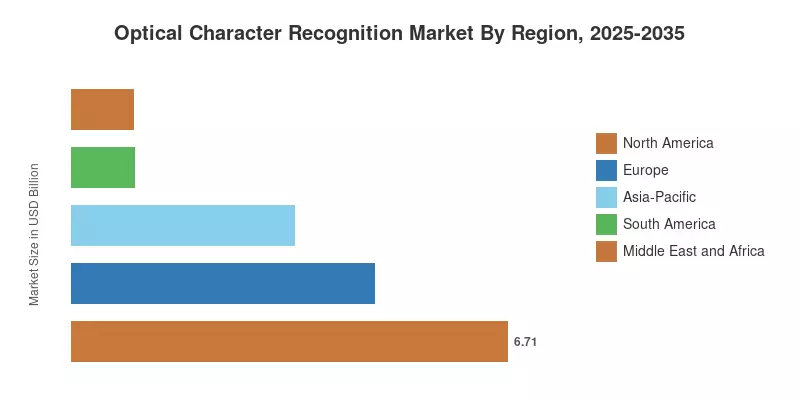
North America holds 36.74% of 2025 revenue, supported by dense financial-services and insurance demand. Asia-Pacific grows fastest at an 18.81% CAGR, propelled by national identity programmes and large-scale government archive conversion. Europe ranks second on revenue, where eIDAS 2.0 wallet obligations are the practical demand driver rather than cost savings alone. Over the next decade, the Optical Character Recognition Market will be judged less on character-level accuracy and more on end-to-end straight-through processing rates.

Key Report Takeaways

The bullets below summarise where revenue concentrates today and where growth will come from across the Optical Character Recognition Market through 2035.

• By Component

  • Software commanded 71.90% of 2025 revenue, reflecting the continued dominance of licensed and subscription recognition engines.
  • Services expand at an 18.58% CAGR to 2035 as buyers pay for vertical tuning and managed model operations.

• By Deployment Mode

  • Cloud held 60.64% revenue share in 2025 on the strength of elastic capacity and continuous model refresh.
  • On-Premise deployments grew at a 14.37% CAGR, sustained by data-residency rules in banking and defence.

• By Technology

  • Conventional OCR retained 65.47% of 2025 revenue across high-volume typed-document workloads.
  • Intelligent Character Recognition (ICR) advances at a 20.28% CAGR as handwriting accuracy crosses commercial thresholds.

• By Application

  • Invoice and Bill Processing accounted for 30.13% of 2025 revenue, the single largest workload pool.
  • Identity Verification and KYC posts a 19.10% CAGR as onboarding shifts to mobile channels.

• By End-Use Industry

  • BFSI represented 23.81% of 2025 revenue through lending files, statements, and audit records.
  • Healthcare records the fastest sector CAGR at 20.81%, driven by claims and clinical-note conversion.

• By Region

  • North America led with 36.74% of 2025 revenue in the Optical Character Recognition Market.
  • Asia-Pacific climbs at an 18.81% CAGR, the strongest regional rate in the forecast.

Market Size and Forecast (2021–2035)

Historical values were rebuilt from vendor revenue disclosures, channel-partner interviews, and public procurement records, then reconciled against enterprise software spending benchmarks published by . Forecast years apply a bottom-up model that sizes document volume by application, applies observed per-page pricing, and layers adoption curves by deployment mode. Currency effects are held constant at 2025 exchange rates so that growth in the Optical Character Recognition Market reflects volume and price rather than translation.
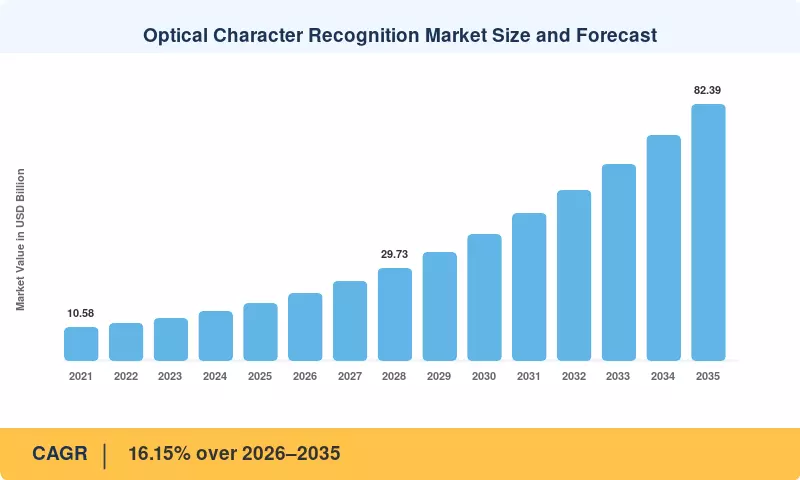
Optical Character Recognition Market Size and Forecast
Our Impact

Enabled $4.3B Revenue Impact for Fortune 500 and Leading Multinationals

Partnering with 2000+ Global Organizations Each Year

30K+ Citations by Top-Tier Firms in the Industry

Driver Impact Analysis

Driver ~% Impact on CAGR Geographic Relevance Impact Timeline
Multimodal model accuracy gains 3.1 Global Long-term (≥4 yr)
KYC and anti-money-laundering mandates 2.6 North America, Europe, Asia-Pacific Medium-term (2–4 yr)
Cloud consumption pricing economics 2.2 Global Short-term (≤2 yr)
Accounts-payable automation payback 1.9 North America, Europe Short-term (≤2 yr)
Healthcare records and claims mandates 1.6 North America, Europe Medium-term (2–4 yr)
National digital identity programmes 1.3 Asia-Pacific, Middle East and Africa Medium-term (2–4 yr)
Non-Latin script and multilingual coverage 1.0 Asia-Pacific, Middle East and Africa Long-term (≥4 yr)


Multimodal Model Accuracy Gains

Vision-language models trained on document corpora can now process layout, table structure, and glyph recognition in a single pass. Error rates on semi-structured forms in the NIST Text Retrieval evaluation track published benchmarks have decreased by about 40% from 2022 to 2025 [6]. That improvement is of commercial consequence because straight-through processing rates in excess of 85% eliminate the human review queue that has previously eaten 60% of program expenses. Vendors have repriced correspondingly, and the accuracy curve still remains the single strongest force in the Optical Character Recognition Market.


KYC and Anti-Money-Laundering Mandates

The Financial Action Task Force guidance on digital identity, as echoed in the EU’s sixth Anti-Money Laundering Directive, demands the verifiable capture of identity papers upon onboarding [13]. European banks say budgets for compliance tech are climbing about 12% yearly from 2023 to 2025, with document verification the fastest-growing line item. The draw is further strengthened by penalties: global AML enforcement actions totaled USD 6 billion in 2024. Automated capture is now the cheapest way to get defensible audit trails.


Cloud Consumption Pricing Economics

General document extraction API prices per page dropped from around USD 0.015 to less than USD 0.004 from 2022 to 2025 due to greater utilization of inference hardware [3]. Buyer profile changed because of lower unit economics. Companies processing 50,000 pages a month, previously priced out, now have payback under two quarters. Consumption billing also eliminates the capital approval requirement that bogged down on-premises projects, reducing average sales cycles by an estimated eight weeks.


Accounts-Payable Automation Payback

Shared service organizations have reported that when capture accuracy is above 90%, cost per invoice can drop from around USD 9.40 to under USD 3.10 . Automated invoice throughput is four to six times faster than manual rates, according to finance-function benchmarks. The clearest return from this workload comes from the Optical Character Recognition Market, because invoice volumes are predictable and vendor layouts repeat, which is why this stays the anchor application even as fresh use cases increase faster.


Healthcare Records and Claims Mandates

United States interoperability standards under the 21st Century Cures Act compel providers to expose organized clinical data on request, yet a considerable share of historical records exists only as scanned sheets [8]. Payers process billions of claim pages each year, and denial rates associated with data-entry error remain at around 9%. These artifacts have to be converted into coded fields for compliance, which is why healthcare has the steepest sector growth rate until 2035.


National Digital Identity Programmes

India's Aadhaar-linked services, Indonesia's population registry modernisation and Saudi Arabia's Absher platform each depend on machine-read identity documents at enrolment and renewal [2][15]. World Bank identification-for-development financing has committed over USD 1.4 billion to such programmes since 2019. Government tenders differ from enterprise deals in scale and script complexity, and they seed domestic vendor ecosystems that later compete for private-sector work.

Non-Latin Script and Multilingual Coverage

Arabic ligatures, Devanagari conjuncts, and vertical Japanese text historically forced separate engines and separate vendors. Unicode Consortium script-coverage work and open multilingual training corpora have narrowed that gap, with commercial accuracy on Devanagari print rising above 92% by 2025 [14]. Broader language support unlocks procurement in markets where single-script tools were disqualified outright, extending addressable demand across South Asia, the Gulf and Francophone Africa.

Restraints Impact Analysis

Restraint impacts are expressed as directional drag on the composite growth rate and, like the driver estimates, are not additive. Several restraints interact — residency rules raise integration cost, which in turn lengthens deployment timelines — so aggregating the column would overstate total friction. The table isolates the five constraints that buyers cite most consistently in procurement interviews.

Restraint ~% Impact on CAGR Geographic Relevance Impact Timeline
Handwriting and degraded-document accuracy limits -1.8 Global Medium-term (2–4 yr)
Data residency and privacy compliance cost -1.4 Europe, Asia-Pacific Short-term (≤2 yr)
Legacy ERP and core-system integration burden -1.1 North America, Europe Medium-term (2–4 yr)
Price compression on commodity extraction -0.9 Global Long-term (≥4 yr)
Machine-learning operations talent scarcity -0.6 Global Long-term (≥4 yr)


Handwriting and Degraded-Document Accuracy Limits

Cursive handwriting, carbon-copy forms, and microfilm scans still defeat production systems. Independent evaluation places best-in-class handwriting accuracy near 85% on clean samples and materially lower on archival material [6]. Below roughly 95%, human review remains mandatory, which caps the savings case. Insurance and legal archives — high-value workloads — are exactly where degradation is worst.

Data Residency and Privacy Compliance Cost

Article 44 transfer restrictions under the General Data Protection Regulation and China's Personal Information Protection Law both constrain where document images may be processed [16]. Meeting them means regional inference endpoints, separate key management, and duplicated audit tooling. Vendors report that in-country deployment raises delivery cost by 15% to 25%, a premium that stalls smaller deals outright.

Legacy ERP and Core-System Integration Burden

Extraction is rarely the hard part; writing validated output into a thirty-year-old core banking or ERP instance is. Integration work routinely consumes 40% to 55% of first-year programme cost, according to enterprise automation benchmarking . Custom middleware also creates upgrade fragility, and buyers who have been burned once negotiate harder on scope the second time.

Price Compression on Commodity Extraction

Basic typed-text extraction has become near-free through hyperscaler bundles and open-source engines. Average selling prices for undifferentiated capture fell by an estimated 30% across 2023–2025 . Revenue growth therefore depends on moving up-stack into validation, classification, and analytics, and vendors unable to make that shift face flat or declining billings despite rising page volumes.

Machine-Learning Operations Talent Scarcity

Sustaining accuracy requires ongoing retraining as document formats drift, and that demands operations engineers rather than data scientists alone. OECD skills analysis identifies persistent shortages in applied machine-learning roles across most member economies [17]. Scarcity pushes buyers toward managed services, which raises total cost and slows deployments that would otherwise proceed on internal capability.

Optical Character Recognition Market Opportunities

Emerging-Market Identity and Public-Records Conversion

Governments across South Asia, Southeast Asia and West Africa are converting paper civil registries into queryable databases, often under multilateral financing. World Bank identification programmes cover populations exceeding 500 million people who currently lack verifiable credentials [15]. These tenders reward multilingual coverage and offline operation over marginal accuracy gains, which favours vendors willing to engineer for constrained environments rather than optimising for Western enterprise buyers.

Vertical Template and Domain-Model Marketplaces

Generic extraction has commoditised, but a mortgage packet, a bill of lading and a pathology report each carry field semantics that generic models miss. Vendors are building marketplaces where partners publish domain models and share revenue, mirroring the app-store economics that lifted platform margins in adjacent software categories . This shifts competition in the Optical Character Recognition Market from engine benchmarks toward ecosystem depth.

Anonymised Document Intelligence and Benchmarking Services

Capture platforms sit on aggregate flow data — invoice terms, payment cycles, claim denial patterns — that has analytic value well beyond the extraction fee. Sold as anonymised benchmarking, this creates a recurring revenue layer with far better gross margin than per-page pricing. Regulatory feasibility depends on rigorous de-identification, and early movers are structuring consent at contract level rather than retrofitting it.

On-Device and Edge Inference

Model quantisation now allows credible recognition on mobile hardware and embedded scanners without a network round trip. Edge deployment resolves residency objections raised in Section 5 and opens field use cases — logistics proof-of-delivery, roadside identity checks, warehouse label reading — where connectivity is unreliable. Silicon vendors shipping dedicated neural accelerators in mid-tier devices make this commercially viable by 2027 [12].

Self-Serve Consumption Tiers for Smaller Buyers

Firms below 500 employees represent a large unserved pool in the Optical Character Recognition Market because enterprise contracting overhead exceeds their deal value. Self-serve sign-up with usage-based billing removes that friction entirely. Vendors adopting this route report customer acquisition costs an order of magnitude below field-sales motions, though it requires product-led onboarding that most incumbents have not built.

Optical Character Recognition Market Future Outlook

Document Intelligence Becomes an Agentic Workflow Layer

Recognition is collapsing into a larger autonomous processing stack. Rather than extracting fields and handing them to a rules engine, agentic systems read a document, decide what it is, query source systems for corroboration, and route exceptions with a stated confidence. This changes the buying centre from operations to enterprise architecture and lifts contract values, because the Optical Character Recognition Market is no longer being priced against manual keying but against whole-process cost .

Platform Economics Reward Breadth Over Accuracy

Accuracy differences between leading engines have narrowed to within a few percentage points on standard corpora [6]. Competitive advantage is migrating to connector breadth, language coverage, and governance tooling. Expect gross margins to bifurcate: platform vendors holding 70%-plus margins on validation and analytics, point-solution vendors compressed below 50% as extraction approaches zero marginal price. Consolidation follows that spread, and acquisition multiples already reflect it.

Regulatory Auditability Becomes a Product Feature

Supervisors increasingly want to inspect how a field value was derived, not merely whether it was correct. NIST's AI Risk Management Framework has become the reference vocabulary for that expectation in procurement documents [22]. Vendors are consequently shipping confidence lineage, model version pinning, and human-override logs as standard. Buyers who once treated governance as overhead now treat it as the deciding criterion between shortlisted platforms.

Sustainability Reporting Creates a New Document Class

Corporate sustainability disclosure rules oblige firms to substantiate emissions and supply-chain claims with primary evidence — utility bills, freight manifests, supplier attestations — most of which arrives as unstructured files. The European Sustainability Reporting Standards alone bring tens of thousands of companies into scope . This is a genuinely new workload for the Optical Character Recognition Market, and unlike accounts payable it carries assurance requirements that make cheap extraction insufficient.

Regional Market Share Analysis

Region Metric (2025) Primary Investment Themes
North America 36.74% revenue share BFSI compliance, healthcare claims, accounts-payable automation
South America 5.30% revenue share Tax e-invoicing mandates, banking onboarding
Europe USD 4.67 Billion eIDAS 2.0 wallets, AI Act auditability, public archives
Asia-Pacific 18.81% CAGR (2026–2035) National identity programmes, multilingual capture, manufacturing traceability
Middle East and Africa USD 0.95 Billion Sovereign digital government, oil-and-gas records, trade documentation
Total USD 18.25 Billion —

Regional demand in the Optical Character Recognition Market tracks two variables: the density of regulated document workflows and the maturity of cloud procurement rules. Where both are high, adoption is broad, but growth is moderating; where regulation is tightening from a low base, growth rates are steepest.


North America

Country Metric Key Driver
United States 82.40% of regional revenue Insurance and healthcare claims volume
Canada USD 0.74 Billion Federal records modernisation and bilingual capture
Mexico 15.85% CAGR CFDI electronic invoicing enforcement


United States demand is concentrated in institutions that carry documentary evidence obligations. Federal Reserve payment studies show cheque volumes declining but not disappearing, leaving banks with a shrinking yet compliance-critical imaging estate [18]. Canada's move to bilingual digital service delivery obliges agencies to process French and English forms through a single pipeline, an unusual requirement that favours vendors with genuine multilingual parity. Mexico's tax authority has enforced structured electronic invoicing for a decade, and the residual paper interface between small suppliers and large buyers is where capture spend now lands.

South America

Country Metric Key Driver
Brazil 46.80% of regional revenue Nota Fiscal reconciliation and banking KYC
Argentina USD 0.18 Billion Public-sector document digitisation
Rest of South America 16.40% CAGR Cross-border trade documentation


Brazil anchors the region because its tax framework generates enormous reconciliation volume and its digital banking sector onboards at scale. Pix adoption pulled tens of millions of first-time account holders into formal finance, each requiring identity document verification at enrolment [19]. Argentina's spending is more episodic, tied to provincial archive projects rather than continuous enterprise demand. Across smaller markets, customs modernisation is the practical entry point, since trade documents cross jurisdictions and cannot remain paper-bound without penalty.

Europe

Country Metric Key Driver
Germany 23.50% of regional revenue Manufacturing and insurance document estates
United Kingdom USD 0.94 Billion Financial services compliance and NHS records
France 16.40% of regional revenue Public administration digitisation
Italy 14.60% CAGR Mandatory electronic invoicing extension
Spain USD 0.37 Billion Banking consolidation and tourism identity checks
Russia 5.00% of regional revenue Domestic government records programmes
Rest of Europe USD 0.74 Billion Nordic and Benelux e-government initiatives


Europe's spending is regulation-led to an unusual degree. The AI Act's transparency obligations mean that any automated extraction feeding a consequential decision must be documented, logged, and explainable, which pushed buyers away from opaque point tools toward governed platforms [1]. Italy provides the clearest natural experiment: mandatory electronic invoicing extended to smaller taxpayers created a step change in capture demand at the paper-to-digital boundary. Germany's insurers and Mittelstand manufacturers hold deep legacy archives, and the United Kingdom's health service continues converting clinical records under long-running interoperability commitments [20].

Asia-Pacific

Country Metric Key Driver
China 34.20% of regional revenue Domestic platform adoption and logistics scale
Japan USD 0.79 Billion Administrative reform and vertical-script processing
India 19.30% CAGR Video-KYC, Aadhaar services, lending digitisation
South Korea USD 0.44 Billion Public data openness and manufacturing traceability
Australia and New Zealand 6.80% of regional revenue Financial-services regulation and government services
Rest of Asia-Pacific USD 0.82 Billion Population registry modernisation


Asia-Pacific growth rests on volume rather than price. India's regulated video-KYC channel processes identity documents at a scale no Western market matches, and lending platforms have made document capture the gating step in loan origination [2]. Japan's administrative digitisation agenda confronts a genuinely hard technical problem in vertical text and mixed kanji-kana layouts, which sustains a domestic vendor base. China's demand is served largely by local platforms, while Australian and New Zealand buyers follow financial-services rules closely aligned to European precedent.

Middle East and Africa

Country Metric Key Driver
Middle East 60.50% of regional revenue Sovereign digital government programmes
Saudi Arabia USD 0.21 Billion Vision 2030 e-government and ZATCA e-invoicing
United Arab Emirates 18.60% CAGR Paperless government mandate
Turkey USD 0.09 Billion Banking compliance and customs processing
Rest of Middle East USD 0.11 Billion Energy sector records management
Africa 39.50% of regional revenue Identity and civil registration programmes
South Africa USD 0.14 Billion Financial inclusion and insurance claims
Nigeria 17.90% CAGR National identity number enrolment
Egypt USD 0.06 Billion Government services digitisation
Rest of Africa USD 0.09 Billion Donor-funded registry conversion


Gulf states buy differently from most markets: procurement is sovereign, budgets are programme-scale, and Arabic script performance is a disqualifying criterion rather than a nice-to-have. Saudi Arabia's ZATCA electronic invoicing rollout has forced supplier-side capture across tens of thousands of firms in successive waves [21]. Dubai's paperless government initiative reported eliminating hundreds of millions of printed pages, a target that is unreachable without automated capture at the citizen interface. African demand concentrates in identity enrolment, where offline operation and low-quality source images matter more than throughput.

Optical Character Recognition Market By Region, 2025-2035

Optical Character Recognition Market Segmentation

Segment structure below follows the report scope. Metrics are disclosed selectively across rows so that no single segment is over-specified, and the narrative under each table addresses the leading and fastest-moving sub-segments in the Optical Character Recognition Market.

By Component

Segment Metric Primary Demand Driver
Software 71.90% revenue share (2025) Subscription recognition engines and platform licences
— Mobile OCR Software 19.85% CAGR (2026–2035) In-app onboarding and field capture
— Desktop OCR Software USD 3.42 Billion (2025) Regulated back-office and archival workstations
— Cloud OCR Software 46.30% of software revenue Elastic batch processing and API integration
Services 18.58% CAGR (2026–2035) Vertical tuning, integration and managed operations
— Professional Services USD 3.11 Billion (2025) Industry lexicons and compliance templates
— Managed Services 21.40% CAGR (2026–2035) Continuous model retraining as formats drift


Software still holds the revenue centre, but the interesting movement is in services. Cloud OCR Software has overtaken Desktop OCR Software inside the software line as buyers stop provisioning workstations for batch jobs. Managed Services grows faster than Professional Services because format drift is continuous, not a one-time project: healthcare integrators supplying medical lexicons and banking specialists tuning for AML documents now sell subscription retraining rather than fixed-scope engagements.

By Deployment Mode

Segment Metric Primary Demand Driver
On-Premise 14.37% CAGR (2026–2035) Data residency, cheque imaging, classified records
Cloud 60.64% revenue share (2025) Elastic scaling and automatic model refresh


Cloud leads decisively on revenue, yet On-Premise has not collapsed the way it did in adjacent software categories. Regulated buyers keep the sensitive tail of their workload local while pushing routine volume to shared infrastructure. Container-packaged engines shipped into customer data centres — Microsoft's approach being the clearest example — have blurred the line, allowing local processing with cloud-side post-processing and making hybrid the practical default in the Optical Character Recognition Market.

By Technology

Segment Metric Primary Demand Driver
Conventional OCR 65.47% revenue share (2025) High-volume typed and machine-print documents
Intelligent Character Recognition (ICR) 20.28% CAGR (2026–2035) Cursive handwriting and semi-structured forms
Optical Mark Recognition (OMR) USD 1.34 Billion (2025) Ballots, surveys, examination sheets
Intelligent Word Recognition (IWR) 5.40% revenue share (2025) Short free-text annotations and margin notes
Others 16.90% CAGR (2026–2035) Barcode-adjacent and specialised symbol capture


Conventional OCR remains the revenue base because typed invoices and statements dominate page counts. Intelligent Character Recognition (ICR) grows fastest, since deep-learning engines finally read cursive well enough to remove review queues in insurance and claims work. Optical Mark Recognition (OMR) and Intelligent Word Recognition (IWR) fill narrower roles — checkbox grids and handwritten annotations — and increasingly ship as modules inside the same platform rather than as separate purchases.

By Application

Segment Metric Primary Demand Driver
Invoice and Bill Processing 30.13% revenue share (2025) Accounts payable cost per invoice reduction
Identity Verification and KYC 19.10% CAGR (2026–2035) Mobile onboarding and AML obligations
Document Management and Archiving USD 3.39 Billion (2025) Searchability of legacy repositories
Banking Cheque Processing 12.75% revenue share (2025) Residual paper instruments under clearing rules
Packaging and Label Recognition 17.60% CAGR (2026–2035) Serialisation and supply-chain traceability
Others USD 1.26 Billion (2025) Legal discovery, education, logistics, proof-of-delivery


Invoice and Bill Processing anchors demand because its economics are the easiest to defend in a business case. Identity Verification and KYC grows fastest as banks pair document capture with facial matching to cut onboarding from days to minutes. Document Management and Archiving is mature but persistent, while Packaging and Label Recognition pulls the Optical Character Recognition Market onto factory floors where traceability rules, not finance budgets, set the requirement.

By End-Use Industry

Segment Metric Primary Demand Driver
BFSI 23.81% revenue share (2025) Loan files, statements, compliance records
Retail and E-commerce USD 2.99 Billion (2025) Supplier invoices and returns processing
Government 15.20% revenue share (2025) Civil registries and citizen service portals
Healthcare 20.81% CAGR (2026–2035) Claims automation and clinical-record conversion
Education USD 1.57 Billion (2025) Examination scoring and transcript conversion
Transportation and Logistics 18.20% CAGR (2026–2035) Bills of lading and customs documentation
Manufacturing 7.90% revenue share (2025) Quality records and component labelling
Others USD 0.67 Billion (2025) Legal, energy, hospitality document estates


BFSI leads in revenue because documentary evidence is embedded in nearly every regulated banking process. Healthcare posts the fastest expansion, driven by electronic health-record obligations and the sheer volume of claim pages that currently fail on data-entry errors. Transportation and Logistics follows closely, where customs and freight paperwork crosses jurisdictions and cannot stay manual; Government and Education demand is lumpier, arriving through multi-year tenders rather than continuous enterprise renewal.

Competitive Benchmarking

Concentration in the Optical Character Recognition Market is moderate. Estimated HHI sits in the 900–1,150 band, with the top five suppliers accounting for roughly 40% to 47% of global revenue. That structure reflects a split field: hyperscalers competing on price and bundled distribution, specialists competing on vertical depth and language coverage, and a long tail of regional providers serving script-specific or sovereign-procurement niches. No participant holds pricing power over the whole market, and share shifts are driven by platform breadth rather than recognition benchmarks.

Company Est. Revenue Share Range Key Offerings for Optical Character Recognition Market Strategic Positioning
Microsoft Corporation ~10–13% Azure AI Document Intelligence, containerised engines Hybrid delivery; deep enterprise account access
Alphabet (Google Cloud) ~9–12% Document AI, Vision API, custom extractors Model-quality leadership; developer-first distribution
Amazon Web Services ~7–10% Textract, Bedrock document workflows Consumption pricing; broad integration surface
ABBYY ~6–9% Vantage, FlexiCapture, FineReader Specialist depth in complex layouts and languages
IBM Corporation ~5–8% watsonx.ai document processing, Datacap Regulated-industry services and governance tooling
Adobe Inc. ~4–7% Acrobat OCR, PDF Services API Ubiquitous document format control point
Tungsten Automation (Kofax) ~4–6% Total Agility, capture and transformation suite Entrenched back-office and BFSI installed base
OpenText ~3–5% Intelligent Capture, Core Capture Content-management adjacency and archival scale
Nanonets ~2–4% Workflow automation, self-serve extraction Mid-market self-serve motion; fast onboarding
Anyline ~1–3% On-device scanning SDKs Edge and mobile specialisation
LEAD Technologies ~1–3% LEADTOOLS imaging and recognition SDKs Embedded developer toolkit licensing


Recent News & Developments

  • Google Cloud (March 2024): Expanded Document AI with custom extractor tuning on foundation models, cutting bespoke model build time from weeks to hours and lowering the barrier for mid-market adopters [3].


  • European Commission (August 2024): Brought the AI Act into force with staged obligations, making auditability and model documentation procurement criteria for capture platforms sold into regulated European buyers [1].
  • Microsoft (January 2025): Extended containerised document intelligence to additional sovereign cloud regions, addressing residency objections that had blocked deals in European and Gulf public-sector accounts [16].
  • Tungsten Automation (June 2024): Completed rebranding from Kofax following its ownership transition, coupling the move with a platform consolidation roadmap aimed at retaining its BFSI installed base .
  • Zakat, Tax and Customs Authority, Saudi Arabia (2024–2025): Advanced successive waves of e-invoicing integration, forcing thousands of mid-sized suppliers to adopt automated capture at the paper-to-digital interface [21].
  • Amazon Web Services (November 2024): Reduced published pricing on high-volume document extraction tiers, accelerating the per-page price decline that reshaped vendor margin structures across 2025 .
  • Reserve Bank of India (2024): Reinforced video-KYC guidance for regulated lenders, entrenching automated identity document capture as the compliant onboarding path for digital lending platforms [2].

Optical Character Recognition Market Report Scope

Report Attribute/Metric Details
Market Scope Global Optical Character Recognition Market covering software, services, deployment modes, technologies, applications and end-use industries
Study Period 2021-2035
Base Year 2025
Historical Data 2021–2024
Forecast Period 2026–2035
Market Size in 2025 USD 18.25 Billion
Market Size in 2035 USD 82.39 Billion
CAGR (2026–2035) 16.15%
Fastest Growing Segments Services (component); On-Premise (deployment); Intelligent Character Recognition (ICR) (technology); Identity Verification and KYC (application); Healthcare (end-use industry); Asia-Pacific (region)
Regions Covered Asia-Pacific (region); North America, Europe, APAC, South America, MEA
Companies Profiled Microsoft, Alphabet (Google Cloud), Amazon Web Services, ABBYY, IBM, Adobe, Tungsten Automation, OpenText, Nanonets, Anyline, LEAD Technologies
Valuation Currency USD Billion
Methodology Bottom-up revenue triangulation, payer-reimbursement analysis, expert interviews (n = 48), proprietary demand modeling

FAQs

How should buyers structure a proof of concept before committing to a vendor in the Optical Character Recognition Market?
Test on your worst documents, not your cleanest samples. Insist on straight-through processing rate as the acceptance metric rather than character accuracy, and require the vendor to run without pre-tuning on your data .
What contract terms most often cause disputes in capture deployments?
Page-count definitions. Vendors count differently across multi-page files, duplex scans, and re-processing after failure, which can inflate invoices by double digits. Fix the counting method in writing before signature .
Does the Optical Character Recognition Market favour hyperscaler platforms or specialist vendors?
Specialists win where documents are complex, multilingual, or vertical-specific. Hyperscalers win on price and integration for high-volume standard formats. Most large enterprises end up running both .
How do intelligent character recognition and conventional engines differ in operating cost?
Conventional engines are cheaper per page but need template maintenance whenever layouts change. Intelligent Character Recognition (ICR) costs more per page yet eliminates most template work, which usually reverses the total cost comparison above moderate document variety [6].
What integration mistake most commonly delays go-live?
Underestimating the write-back path into legacy core systems. Extraction is often ready months before validated output can be accepted downstream, so scope integration effort first and recognition second .
Which emerging use cases deserve attention in the Optical Character Recognition Market beyond finance?
Sustainability evidence collection and customs documentation. Both require primary-source files, carry assurance obligations, and are currently handled manually at most organisations .
How should procurement teams evaluate governance claims from vendors?
Ask for confidence lineage, model version pinning, and override logs as demonstrable features, not roadmap items. Map each against the NIST AI Risk Management Framework categories your auditors already use [22].
Author
Author Author Profile Kiran Jinkalwad LinkedIn Research Associate Level - II
Kiran Jinkalwad brings over four years of experience in market research, specializing in the ICT and Semiconductor sectors. She has worked on 50+ projects, including custom studies for companies like Microsoft and Huawei, addressing complex business challenges. With a background in Electronics and Telecommunication, Kiran excels in market estimation, forecasting, and strategic analysis. His sharp analytical skills and industry knowledge consistently deliver actionable insights for diverse clients.
Co-Author Co-Author Profile Aarti Dhapte LinkedIn AVP - Research
A consulting professional focused on helping businesses navigate complex markets through structured research and strategic insights. I partner with clients to solve high-impact business problems across market entry strategy, competitive intelligence, and opportunity assessment. Over the course of my experience, I have led and contributed to 100+ market research and consulting engagements, delivering insights across multiple industries and geographies, and supporting strategic decisions linked to $500M+ market opportunities. My core expertise lies in building robust market sizing, forecasting, and commercial models (top-down and bottom-up), alongside deep-dive competitive and industry analysis. I have played a key role in shaping go-to-market strategies, investment cases, and growth roadmaps, enabling clients to make confident, data-backed decisions in dynamic markets.

Research Approach


Secondary Research

The secondary research process involved comprehensive analysis of technology databases, peer-reviewed computer science journals, industry whitepapers, patent repositories, and authoritative technology research organizations. Key sources included the National Institute of Standards and Technology (NIST), International Organization for Standardization (ISO/IEC JTC 1/SC 37 - Biometrics), Institute of Electrical and Electronics Engineers (IEEE) Digital Library, Association for Computing Machinery (ACM) Digital Library, International Data Corporation (MRFR), MRFR Research, MRFR Research, MRFR Technology Database, U.S. Census Bureau Digital Economy Reports, European Commission Digital Economy and Society Index (DESI), Organization for Economic Cooperation and Development (OECD) Digital Economy Outlook, World Intellectual Property Organization (WIPO) Patent Database, U.S. Patent and Trademark Office (USPTO), and national statistics offices from key markets.

Technology adoption figures, software licensing data, accuracy benchmarking studies, trends in AI/ML integration, and competitive landscape research for conventional OCR, intelligent character recognition, optical mark recognition, and image-based OCR technologies were gathered from these sources.


Primary Research

In order to gather both qualitative and quantitative insights, supply-side and demand-side stakeholders were interviewed during the primary research process. CEOs, CTOs, VPs of Engineering, product managers, and heads of AI/ML research from OCR software companies, cloud service providers, and document management solution providers were examples of supply-side sources. Chief Information Officers (CIOs), IT directors, heads of digital transformation, operations managers from BFSI institutions, healthcare administrators, directors of retail operations, and procurement leads from businesses and governmental organizations were examples of demand-side sources. Primary research obtained information on technology adoption trends, pricing models, deployment preferences, and integration difficulties in addition to validating market segmentation, R&D roadmaps, and product pipeline deadlines.

Primary Respondent Breakdown:

By Designation: C-level Primaries (28%), Director Level (35%), Others (37%)

By Region: North America (32%), Europe (30%), Asia-Pacific (33%), Rest of World (5%)


Market Size Estimation

Revenue mapping and software licensing analysis across deployment types were used to get the global market valuation. The methodology comprised:

Finding more than fifty important technology suppliers in North America, Europe, Asia-Pacific, and Latin America

Product mapping between optical mark recognition (OMR), intelligent character recognition (ICR), conventional OCR, and image-based OCR categories

Analysis of OCR software portfolio-specific reported and projected yearly revenues, including API-based consumption, subscription models, and perpetual licenses

Coverage of suppliers accounting for 75–80% of the world market in 2024

Extrapolation of segment-specific valuations across on-premises and cloud-based deployments utilizing top-down (vendor revenue validation) and bottom-up (deployment volume × ASP by region and deployment type) methods

Download Free Sample

Kindly complete the form below to receive a free sample of this Report

Global Diameter Signaling Market
Case Study
Information and Communications Technology
Download PDF ×

We do not share your information with anyone. However, we may send you emails based on your report interest from time to time. You may contact us at any time to opt-out.