×
  • Cat-intel
  • MedIntelliX
  • Resources
  • About Us
  • Request Free Sample ×

    Kindly complete the form below to receive a free sample of this Report

    Leading companies partner with us for data-driven Insights

    clients tt-cursor
    Hero Background

    Online Diagram Editor Market

    ID: MRFR/ICT/38446-HCR
    100 Pages
    Aarti Dhapte
    October 2025

    Online Diagram Editor Market Research Report By Application (Flowchart Creation, Mind Mapping, Network Diagramming, Organizational Charting, UML Diagramming), By Deployment Mode (Web-Based, Cloud-Based, On-Premises), By End User (Educational Institutions, Small and Medium Enterprises, Large Enterprises, Freelancers, Government Organizations), By Integration (API Integration, Third-Party Applications, Collaboration Tools) and By Regional (North America, Europe, South America, Asia Pacific, Middle East and Africa) - Forecast to 2035

    Share:
    Download PDF ×

    We do not share your information with anyone. However, we may send you emails based on your report interest from time to time. You may contact us at any time to opt-out.

    Online Diagram Editor Market Infographic
    Purchase Options

    Online Diagram Editor Market Summary

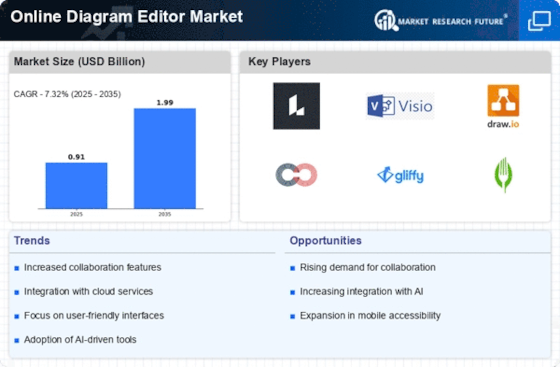
    As per MRFR analysis, the Online Diagram Editor Market Size was estimated at 0.9147 USD Billion in 2024. The Online Diagram Editor industry is projected to grow from 0.9817 in 2025 to 1.99 by 2035, exhibiting a compound annual growth rate (CAGR) of 7.32 during the forecast period 2025 - 2035.

    Key Market Trends & Highlights

    The Online Diagram Editor Market is experiencing robust growth driven by technological advancements and increasing demand for visual communication.

    • The market is witnessing increased adoption in remote work, particularly in North America, which remains the largest market.
    • Integration of advanced technologies is becoming prevalent, especially in the Asia-Pacific region, recognized as the fastest-growing area.
    • Flowchart creation continues to dominate as the largest segment, while mind mapping is emerging as the fastest-growing segment.
    • Rising demand for visual communication and an increased focus on collaboration tools are key drivers propelling market expansion.

    Market Size & Forecast

    2024 Market Size 0.9147 (USD Billion)
    2035 Market Size 1.99 (USD Billion)
    CAGR (2025 - 2035) 7.32%

    Major Players

    Lucidchart (US), Microsoft Visio (US), Draw.io (DE), Creately (AU), Gliffy (US), Cacoo (JP), SmartDraw (US), Miro (RU), EdrawMax (CN)

    Online Diagram Editor Market Trends

    The Online Diagram Editor Market is currently experiencing a notable evolution, driven by the increasing demand for visual communication tools across various sectors. Organizations are recognizing the value of diagramming software in enhancing collaboration and streamlining workflows. This trend appears to be fueled by the growing need for remote work solutions, as teams seek effective ways to visualize complex ideas and processes. Furthermore, the integration of advanced technologies such as artificial intelligence and cloud computing is likely to enhance the functionality and accessibility of these tools, making them more appealing to a broader audience. In addition, the Online Diagram Editor Market seems to be influenced by the rising popularity of educational platforms that incorporate visual learning methodologies. As educational institutions and corporate training programs adopt these tools, the market may witness an expansion in user demographics. This shift indicates a potential for innovation, as developers strive to create user-friendly interfaces and diverse templates that cater to various industries. Overall, the Online Diagram Editor Market is poised for growth, with evolving user needs and technological advancements shaping its future landscape.

    Increased Adoption in Remote Work

    The Online Diagram Editor Market is witnessing a surge in usage as organizations adapt to remote work environments. Teams are increasingly relying on diagramming tools to facilitate collaboration and communication, enabling them to visualize ideas and processes effectively.

    Integration of Advanced Technologies

    The incorporation of artificial intelligence and cloud computing into diagramming software is transforming the Online Diagram Editor Market. These technologies enhance functionality, allowing users to create more sophisticated diagrams and access tools from various devices.

    Expansion in Educational Sectors

    Educational institutions are increasingly adopting online diagram editors to support visual learning. This trend suggests a growing market segment as schools and training programs recognize the benefits of visual aids in enhancing comprehension and engagement.

    Online Diagram Editor Market Drivers

    Expansion of Educational Technology

    The Online Diagram Editor Market is benefiting from the expansion of educational technology. As educational institutions increasingly adopt digital tools for teaching and learning, the demand for diagram editors is on the rise. These tools facilitate interactive learning experiences, allowing students to create visual representations of concepts, which enhances understanding and retention. Recent studies indicate that the use of visual aids in education can lead to a 25% improvement in student performance. This trend is particularly evident in online learning environments, where engagement is crucial. Consequently, the Online Diagram Editor Market is expected to grow as educational institutions invest in tools that support innovative teaching methods and enhance student engagement.

    Integration of Cloud-Based Solutions

    The Online Diagram Editor Market is witnessing a shift towards cloud-based solutions, which offer flexibility and accessibility. Cloud technology enables users to access diagram editing tools from any location, facilitating remote work and collaboration. This transition is supported by data indicating that cloud-based applications are expected to account for over 70% of software usage in the coming years. The convenience of cloud solutions allows for seamless updates and integration with other software, enhancing user experience. As organizations increasingly adopt cloud technologies, the Online Diagram Editor Market is likely to expand, driven by the demand for tools that support modern work environments and enhance operational efficiency.

    Increased Focus on Collaboration Tools

    The Online Diagram Editor Market is significantly influenced by the growing emphasis on collaboration tools. As teams become more distributed, the need for effective collaboration solutions has intensified. Diagram editors facilitate real-time collaboration, allowing multiple users to work on a single diagram simultaneously, which enhances productivity and creativity. Recent statistics indicate that organizations utilizing collaborative tools report a 30% increase in project completion rates. This trend is particularly relevant in industries such as software development and design, where visual collaboration is essential for brainstorming and problem-solving. Consequently, the Online Diagram Editor Market is poised for growth as companies invest in tools that foster teamwork and streamline workflows.

    Rising Demand for Visual Communication

    The Online Diagram Editor Market experiences a notable increase in demand for visual communication tools. Organizations are increasingly recognizing the importance of visual aids in conveying complex information effectively. This trend is particularly pronounced in sectors such as marketing, education, and project management, where clarity and engagement are paramount. According to recent data, the market for visual communication tools is projected to grow at a compound annual growth rate of approximately 10% over the next five years. This growth is driven by the need for enhanced collaboration and the ability to present ideas visually, which is becoming a critical component of successful communication strategies. As a result, the Online Diagram Editor Market is likely to see a surge in user adoption, as businesses seek to leverage these tools to improve their operational efficiency and stakeholder engagement.

    Growing Importance of Data Visualization

    The Online Diagram Editor Market is significantly impacted by the rising importance of data visualization. As organizations generate vast amounts of data, the ability to present this information visually becomes crucial for decision-making. Diagram editors provide essential tools for creating infographics, flowcharts, and other visual representations of data, which aid in understanding complex datasets. Research suggests that effective data visualization can improve comprehension by up to 80%, making it a vital component in business intelligence strategies. This trend is particularly relevant in sectors such as finance and healthcare, where data-driven decisions are critical. Therefore, the Online Diagram Editor Market is likely to experience growth as businesses seek to enhance their data presentation capabilities.

    Market Segment Insights

    By Application: Flowchart Creation (Largest) vs. Mind Mapping (Fastest-Growing)

    The application segment of the Online Diagram Editor Market showcases a diverse distribution of market share across various functionalities. Flowchart Creation has emerged as the largest application, driven by its extensive use in business process mapping, educational tools, and project management. Meanwhile, Mind Mapping has gained significant traction, especially among educators and creatives, appealing to users seeking innovative ways to organize thoughts and ideas visually. This breadth of application reflects the versatility of online diagramming tools in catering to multiple user needs. Growth trends in the Online Diagram Editor Market are being heavily influenced by the increasing adoption of digital tools for collaboration and productivity. Businesses and educational institutions are seeking efficient ways to visualize complex information, with Flowchart Creation leading due to its foundational role in many workflows. Mind Mapping is considered the fastest-growing application, fueled by a growing emphasis on brainstorming sessions and visual thinking techniques that enhance creativity and innovation. Overall, the segment is poised for considerable expansion as user preferences continue to shift toward interactive and user-friendly diagramming solutions.

    Flowchart Creation (Dominant) vs. UML Diagramming (Emerging)

    Flowchart Creation remains the dominant application in the Online Diagram Editor Market, known for its straightforward and effective approach to illustrating processes and workflows. It serves a wide range of industries, including IT, finance, and education, where clarity in communication is essential. In contrast, UML Diagramming, while relatively newer in terms of widespread adoption, is rapidly gaining interest, especially among software development teams. It allows professionals to create standardized models that assist in system design, showcasing the growing interest in tools that support agile methodologies and complex project developments. Together, these applications highlight the balance between established diagramming practices and evolving user demands in a fast-paced digital environment.

    By Deployment Mode: Web-Based (Largest) vs. Cloud-Based (Fastest-Growing)

    In the Online Diagram Editor Market, the distribution of market share among deployment modes highlights a clear preference for Web-Based solutions. This segment captures the largest share, as it aligns well with users seeking easy access, collaborative features, and seamless integration with other online tools. Conversely, Cloud-Based solutions are emerging rapidly, appealing to users who prioritize flexibility and scalability, resulting in a growing user base and market presence. Growth trends reveal that the Cloud-Based segment is fueled by increasing demand for remote work solutions and real-time collaboration tools. As organizations adopt digital transformation strategies, the appeal of Cloud-Based deployment continues to rise. Meanwhile, Web-Based solutions maintain their dominance by offering established functionalities that enhance productivity and streamline workflow, thus securing a substantial user base in this competitive landscape.

    Web-Based (Dominant) vs. Cloud-Based (Emerging)

    Web-Based deployment represents the dominant mode in the Online Diagram Editor Market, offering users immediate access through browsers with no need for installation, making it user-friendly and cost-effective. It is heavily favored in collaborative environments, as it enables multiple users to work simultaneously on diagrams from different locations. On the other hand, Cloud-Based deployment is emerging rapidly. It offers advantages such as on-demand resources, scalability, and enhanced performance. This segment is gaining traction among businesses that require flexible access to software and data, as well as the ability to implement updates and backups seamlessly. Together, these segments illustrate the shifting preferences of users toward flexibility and collaborative capabilities in diagramming tools.

    By End User: Educational Institutions (Largest) vs. Freelancers (Fastest-Growing)

    The Online Diagram Editor Market exhibits a diverse distribution of end users, with educational institutions commanding the largest share. This segment benefits from the integration of these tools into curricula, fostering collaborative projects and enhancing learning experiences. On the other hand, freelancers are emerging rapidly, attracted by the flexibility and affordability of online diagram editors as effective tools for client projects and presentations. Growth trends within the Online Diagram Editor Market show that educational institutions continue to invest in digital tools, aiming to enrich remote learning. Additionally, freelancers are embracing these platforms due to increasing demand for visual communication. The rise of remote work and gig economy trends is further propelling freelancers toward adopting these user-friendly tools for efficient project delivery.

    Educational Institutions: Dominant vs. Freelancers: Emerging

    Educational institutions play a dominant role in the Online Diagram Editor Market, leveraging these tools for creating interactive content and facilitating group projects. This segment values functionality and user-friendliness, enabling educators and students to collaborate seamlessly. Conversely, freelancers represent an emerging segment, drawn by the need for cost-effective, versatile solutions for various client projects. They appreciate the cloud-based nature of these editors, which allows for easy access across devices. Despite their differing market positions, both segments are crucial, as educational institutions foster the foundational skills necessary for future professionals, while freelancers contribute to immediate, dynamic project demands in diverse industries.

    By Integration: API Integration (Largest) vs. Third-Party Applications (Fastest-Growing)

    In the Online Diagram Editor Market, the integration segment showcases a diversity of offerings, with API Integration leading the market share. It allows seamless connectivity with existing systems, making it essential for businesses that require fluid interactions with their digital tools. Third-Party Applications, while in a smaller share, are rapidly gaining traction, appealing to users seeking enhanced functionality without heavy investments in custom solutions. Their ease of use and accessibility is attracting a new user base.

    API Integration (Dominant) vs. Collaboration Tools (Emerging)

    API Integration dominates the online diagram editor market by providing robust interconnectivity with various software and services, enabling users to work efficiently across multiple platforms. This integration ensures that users can incorporate diagrams into broader workflows, enhancing productivity and collaboration. In contrast, Collaboration Tools are emerging as pivotal in ensuring that teams can work together in real-time, despite geographical barriers. This segment is characterized by features that enable sharing, commenting, and team-based editing, making it particularly appealing in an increasingly remote work environment as organizations prioritize collaborative functions.

    Get more detailed insights about Online Diagram Editor Market

    Regional Insights

    North America : Innovation and Market Leadership

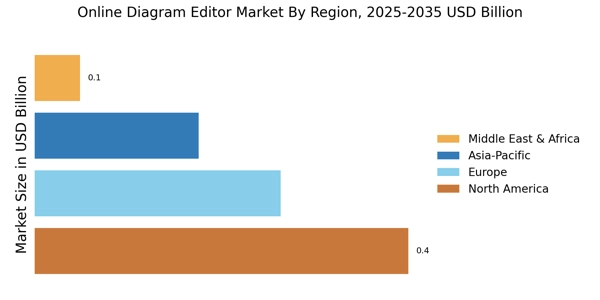
    North America is the largest market for online diagram editors, holding approximately 45% of the global market share. The region's growth is driven by the increasing adoption of cloud-based solutions and the rising demand for collaborative tools in various sectors, including education and business. Regulatory support for digital transformation initiatives further catalyzes market expansion, making it a hub for innovation. The competitive landscape in North America is robust, featuring key players like Lucidchart, Microsoft Visio, and Gliffy. These companies leverage advanced technologies to enhance user experience and functionality. The presence of established tech firms and startups fosters a dynamic environment, ensuring continuous improvement and adaptation to market needs. This region's focus on user-centric design and integration capabilities positions it as a leader in the online diagram editor market.

    Europe : Growing Demand and Innovation

    Europe is witnessing significant growth in the online diagram editor market, accounting for approximately 30% of the global share. The demand is fueled by the increasing need for visual collaboration tools in remote work environments and educational institutions. Regulatory frameworks promoting digital literacy and innovation are also contributing to market growth, making Europe a key player in this sector. Leading countries in this region include Germany, the UK, and France, where companies like Draw.io and Creately are making substantial impacts. The competitive landscape is characterized by a mix of established players and innovative startups, driving advancements in features and user experience. The emphasis on data privacy and compliance with regulations like GDPR further shapes the market dynamics, ensuring that solutions meet stringent standards.

    Asia-Pacific : Rapid Growth and Adoption

    Asia-Pacific is rapidly emerging as a significant market for online diagram editors, holding about 20% of the global market share. The region's growth is driven by the increasing digitalization of businesses and the rising demand for collaborative tools in education and corporate sectors. Government initiatives promoting technology adoption and digital skills development are key catalysts for this growth, positioning Asia-Pacific as a future powerhouse in the market. Countries like Japan, China, and Australia are leading the charge, with players such as Cacoo and EdrawMax gaining traction. The competitive landscape is diverse, featuring both local and international companies. The focus on innovation and user-friendly interfaces is crucial for capturing the growing user base, as organizations seek efficient solutions for visual communication and project management.

    Middle East and Africa : Emerging Market with Potential

    The Middle East and Africa region is gradually emerging in the online diagram editor market, currently holding about 5% of the global share. The growth is primarily driven by increasing internet penetration and the rising demand for digital collaboration tools across various sectors. Government initiatives aimed at enhancing digital infrastructure and promoting technology adoption are pivotal in shaping the market landscape, indicating potential for future expansion. Leading countries in this region include South Africa and the UAE, where local players are beginning to establish a foothold. The competitive landscape is still developing, with opportunities for both established and new entrants to innovate and cater to the unique needs of the market. As businesses increasingly recognize the value of visual communication, the demand for online diagram editors is expected to rise significantly in the coming years.

    Key Players and Competitive Insights

    The Online Diagram Editor Market is characterized by a dynamic competitive landscape where companies strive to deliver innovative solutions that enhance user experience and functionality. This market comprises various players offering tools that enable users to create, modify, and share diagrams easily, facilitating communication and collaboration across different sectors. The growing demand for remote work solutions and digital collaboration tools has fueled the expansion of this market, prompting companies to focus on developing advanced features such as real-time collaboration, cloud integration, and extensive template libraries.

    As businesses increasingly seek cost-effective and user-friendly diagramming tools, understanding the competitive strengths of key players becomes vital for gaining insights into market trends and consumer preferences.Moqups has established a significant presence in the Online Diagram Editor Market with its versatile platform designed for seamless diagram creation and collaboration. Its strengths lie in the intuitive user interface that allows both novice and experienced users to design professionally-looking diagrams effortlessly. Moqups emphasizes a comprehensive approach by integrating a wide range of features, including wireframing, prototyping, and mockup capabilities, which appeal to diverse segments such as product designers and educators. 

    Furthermore, the platform's cloud-based nature enables real-time collaboration among teams, thus fostering efficient workflows. Moqups' commitment to regular software updates and user feedback incorporation further solidifies its competitive edge, ensuring that it meets the evolving demands of its customer base.Lucidchart is another prominent player in the Online Diagram Editor Market, recognized for its powerful diagramming capabilities and user-friendly design. One of Lucidchart's standout strengths is its robust integration with various third-party applications, which enhances productivity by allowing users to seamlessly embed diagrams in their existing workflows.

    The platform supports real-time collaboration, making it an ideal choice for teams working on complex projects across different locations. Lucidchart's extensive library of templates and shapes serves to simplify the design process, catering to users from various industries, including education, engineering, and business management. Additionally, Lucidchart's emphasis on customer support and user engagement contributes to its reputation as a dependable choice in the market, enabling it to maintain a loyal customer base while attracting new users.

    Key Companies in the Online Diagram Editor Market market include

    Industry Developments

    Recent developments in the Online Diagram Editor Market have showcased significant growth, with leading companies like Lucidchart, Miro, and Canva expanding their service offerings and increasing user engagement. Lucidchart has been actively enhancing its features to cater to a broader range of users, from educators to corporate teams, while Miro is focusing on integrating AI to streamline the diagram creation process.

    Companies such as Gliffy and Draw.io have also introduced innovative templates and collaborative features, attracting a growing user base. Current affairs reveal an increasing demand for cloud-based solutions, prompting firms like SmartDraw and Visio to refine their tools to cater to remote work trends. In terms of M&A activity, there have been no major reported mergers or acquisitions among the specific companies in this segment recently.

    This sector is witnessing a surge in valuation as organizations strive for more efficient visual communication tools, and the shift towards digital collaboration platforms continues to drive market momentum, positioning companies like Creately and Cacoo for future opportunities. The competitive landscape remains dynamic, with continuous innovations aimed at improving user experience and functionality.

    Future Outlook

    Online Diagram Editor Market Future Outlook

    The Online Diagram Editor Market is projected to grow at a 7.32% CAGR from 2024 to 2035, driven by increasing digital collaboration, demand for visual communication, and integration with cloud technologies.

    New opportunities lie in:

    • Expansion into mobile platforms for enhanced accessibility and user engagement.
    • Development of AI-driven features for automated diagram generation and customization.
    • Partnerships with educational institutions to integrate diagram tools into curricula.

    By 2035, the market is expected to be robust, reflecting substantial growth and innovation.

    Market Segmentation

    Online Diagram Editor Market End User Outlook

    • API Integration
    • Third-Party Applications
    • Collaboration Tools

    Online Diagram Editor Market Application Outlook

    • Flowchart Creation
    • Mind Mapping
    • Network Diagramming
    • Organizational Charting
    • UML Diagramming

    Online Diagram Editor Market Integration Outlook

    • North America
    • Europe
    • South America
    • Asia Pacific
    • Middle East and Africa

    Online Diagram Editor Market Deployment Mode Outlook

    • Web-Based
    • Cloud-Based
    • On-Premises

    Report Scope

    MARKET SIZE 20240.9147(USD Billion)
    MARKET SIZE 20250.9817(USD Billion)
    MARKET SIZE 20351.99(USD Billion)
    COMPOUND ANNUAL GROWTH RATE (CAGR)7.32% (2024 - 2035)
    REPORT COVERAGERevenue Forecast, Competitive Landscape, Growth Factors, and Trends
    BASE YEAR2024
    Market Forecast Period2025 - 2035
    Historical Data2019 - 2024
    Market Forecast UnitsUSD Billion
    Key Companies ProfiledMarket analysis in progress
    Segments CoveredMarket segmentation analysis in progress
    Key Market OpportunitiesIntegration of artificial intelligence enhances user experience in the Online Diagram Editor Market.
    Key Market DynamicsRising demand for collaborative tools drives innovation and competition in the Online Diagram Editor Market.
    Countries CoveredNorth America, Europe, APAC, South America, MEA

    Leave a Comment

    FAQs

    What is the current valuation of the Online Diagram Editor Market as of 2024?

    The Online Diagram Editor Market was valued at approximately 0.9147 USD Billion in 2024.

    What is the projected market size for the Online Diagram Editor Market by 2035?

    The market is projected to reach approximately 1.99 USD Billion by 2035.

    What is the expected CAGR for the Online Diagram Editor Market during the forecast period 2025 - 2035?

    The expected CAGR for the Online Diagram Editor Market during the forecast period 2025 - 2035 is 7.32%.

    Which segment of the Online Diagram Editor Market is expected to grow the most in terms of application?

    Flowchart Creation is anticipated to grow from 0.3 USD Billion to 0.65 USD Billion, indicating strong demand.

    How does the deployment mode impact the Online Diagram Editor Market?

    Web-Based deployment is projected to increase from 0.4 USD Billion to 0.9 USD Billion, reflecting a shift towards online solutions.

    What are the key end-user segments driving the Online Diagram Editor Market?

    Large Enterprises are expected to lead the market, growing from 0.3 USD Billion to 0.65 USD Billion.

    Which companies are considered key players in the Online Diagram Editor Market?

    Key players include Lucidchart, Microsoft Visio, Draw.io, and Creately, among others.

    What role does API integration play in the Online Diagram Editor Market?

    API Integration is projected to grow from 0.3 USD Billion to 0.65 USD Billion, highlighting its importance in enhancing functionality.

    How are collaboration tools influencing the Online Diagram Editor Market?

    Collaboration Tools are expected to increase from 0.3647 USD Billion to 0.69 USD Billion, indicating a trend towards integrated solutions.

    What is the growth outlook for small and medium enterprises in the Online Diagram Editor Market?

    Small and Medium Enterprises are projected to grow from 0.25 USD Billion to 0.55 USD Billion, showcasing their increasing adoption of diagramming tools.

    Download Free Sample

    Kindly complete the form below to receive a free sample of this Report

    Case Study
    Chemicals and Materials

    Compare Licence

    ×
    Features License Type
    Single User Multiuser License Enterprise User
    Price $4,950 $5,950 $7,250
    Maximum User Access Limit 1 User Upto 10 Users Unrestricted Access Throughout the Organization
    Free Customization
    Direct Access to Analyst
    Deliverable Format
    Platform Access
    Discount on Next Purchase 10% 15% 15%
    Printable Versions