• Cat-intel
  • MedIntelliX
  • Resources
  • About Us
  • Hero Background
    English
    Chinese
    French
    Japanese
    Korean
    German
    Spanish

    Non Metallurgical Alumina Market Size

    ID: MRFR/CnM/10310-CR
    128 Pages
    Anshula Mandaokar
    June 2023

    Non-Metallurgical Alumina Market Research Report Information By Type (Calcined Alumina and Alumina Trihydrate), By Application (Refractories, Abrasives, Ceramics, Aluminum Sulphate, ATH Fire Retardant, And Others), and By Region (North America, Europe, Asia-Pacific, and Rest of the World) - Forecast Till 2035

    Share:
    Download PDF ×

    We do not share your information with anyone. However, we may send you emails based on your report interest from time to time. You may contact us at any time to opt-out.

    Non Metallurgical Alumina Market Infographic
    $ 4,950.0
    $ 5,950.0
    $ 7,250.0

    Non Metallurgical Alumina Size

    Non Metallurgical Alumina Market Growth Projections and Opportunities

    The non-metallurgical alumina market is poised for significant growth, with an anticipated Compound Annual Growth Rate (CAGR) of 6.72% during the forecast period spanning from 2022 to 2030. Various sectors, including refractories, abrasives, cement, and chemicals, are the primary contributors to the expansion of non-metallurgical alumina applications. However, these consumer industries have witnessed diverse trajectories in recent times. While certain segments, like chemicals utilizing alumina trihydrate (ATH) for water treatment, have maintained stability, others such as refractories and abrasives faced notable contractions, albeit showing signs of recovery.

    In 2021, the global non-metallurgical alumina market held a valuation of USD 1,885.00 million, and it is anticipated to soar to USD 3,380.43 million by 2030, reflecting a robust CAGR of 6.72% throughout the forecast duration. The geographical distribution of this market showcases Asia Pacific as the frontrunner, accounting for the largest market share at 50.23%, followed by North America with a share of 21.64%, and Europe contributing 18.68%. Moreover, in terms of expected growth rates, Asia Pacific is forecasted to lead with the highest CAGR of 7.06%, trailed by North America at 6.70%, spanning the period from 2022 to 2030.

    The application landscape of non-metallurgical alumina is diverse, with its utilization across refractories, abrasives, cement, and chemicals sectors. Refractories and abrasives, in particular, have faced challenges, experiencing a notable reduction in their markets, yet signs of recovery are evident. The alumina trihydrate (ATH)-based chemicals used in water treatment, on the other hand, have demonstrated relative stability in their market performance.

    Looking ahead, the non-metallurgical alumina market is poised for substantial expansion, driven by diverse applications and recovering sectors. The refractories and abrasives segments, which encountered contractions, are anticipated to rebound, contributing to the overall growth trajectory of non-metallurgical alumina. As industries stabilize and resume growth, the demand for alumina in various applications is expected to witness an upswing, further propelling the market.

    Non Metallurgical Alumina Market Size Graph

    Market Summary

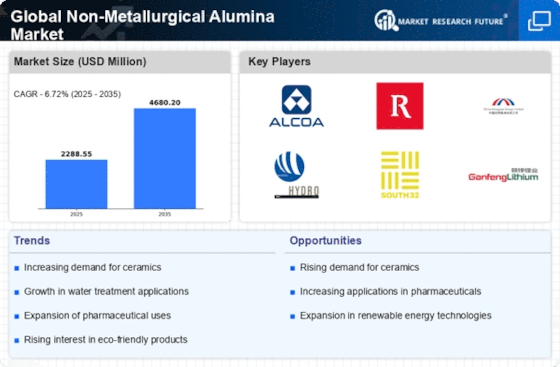
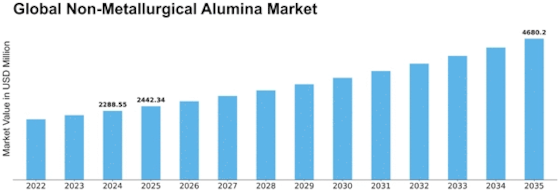
    The Global Non-Metallurgical Alumina Market is projected to grow from 2.24 USD Billion in 2024 to 4.68 USD Billion by 2035, indicating robust growth potential.

    Key Market Trends & Highlights

    Global Non-Metallurgical Alumina Key Trends and Highlights

    • The market is expected to achieve a compound annual growth rate (CAGR) of 6.92 percent from 2025 to 2035.
    • By 2035, the market valuation is anticipated to reach 4.68 USD Billion, reflecting a significant increase from 2.24 USD Billion in 2024.
    • The growth trajectory suggests a strong demand for non-metallurgical alumina across various industries.
    • Growing adoption of advanced manufacturing processes due to increased industrialization is a major market driver.

    Market Size & Forecast

    2024 Market Size 2.24 (USD Million)
    2035 Market Size 4.68 (USD Million)
    CAGR (2025-2035) 6.92%
    Largest Regional Market Share in 2024 latin_america)

    Major Players

    Alcoa Corporation, Almatis GMBH, Alteo Alumina, Alumina D.O.O – Zvornik, Dadco Alumina and Chemicals Limited, Hindalco Industries Ltd, Aluminum Corporation of China Limited, Atlantic Alumina Company (ATALCO), RUSAL, PT Indonesia Chemical Alumina (ICA)

    Market Trends

    Growing demand for non-metallurgical alumina in the end-use industry represents one of the major factors boosting market growth globally.

    Over the next few years, it is anticipated that the ceramic proppants industry will grow to be a significant market for non-metallurgical bauxite. More than 20% of the entire non-metallurgical bauxite was used in refractories, both directly and through brown fused alumina. As North America and China aim to increase the exploitation of unconventional oil and gas reservoirs, the need for calcined bauxite in the production of ceramic proppants is anticipated to increase significantly.

    The majority of proppants are made from naturally occurring, rounded quartz sands. Ceramic proppants are more suited to high-pressure drilling scenarios than natural sand proppants because they have a higher crush strength. Consumption of ceramic proppant is projected to rise, especially in China and North America, where unorthodox gas reserves are currently being developed, including the Sulige tight sandstone gas field in Inner Mongolia. Although the non-metallurgical markets for bauxite and alumina are sizable in and of themselves, they are frequently mentioned in relation to the considerably larger industry of aluminum feedstock.

    This is true despite the fact that non-metallurgical grades are frequently far more specialized and expensive goods.

    Further, the rise in construction activity with the growing population is increasing the demand for construction materials such as cement, glass, ceramics, metal, and others. Thus, the rising consumption of non-metallurgical in various end-use industries is expected to increase the growth of the non-metallurgical alumina market revenue over the forthcoming years.

    The demand for non-metallurgical alumina is poised to expand as industries increasingly prioritize sustainable practices and seek alternatives to traditional materials.

    U.S. Geological Survey

    Non Metallurgical Alumina Market Market Drivers

    Rising Demand from the Chemical Industry

    The Global Non-Metallurgical Alumina Market Industry experiences a notable surge in demand driven by the chemical sector. Non-metallurgical alumina serves as a crucial raw material in the production of various chemicals, including aluminum hydroxide and sodium aluminate. As industries increasingly prioritize sustainable practices, the demand for high-purity alumina is expected to rise. In 2024, the market is projected to reach 2.24 USD Billion, reflecting the growing reliance on non-metallurgical alumina in chemical applications. This trend suggests a robust growth trajectory, with the market likely to expand further as the chemical industry evolves.

    Market Segment Insights

    Non-Metallurgical Alumina Type Insights

    The global non-metallurgical alumina market segmentation, based on type, includes calcined alumina and alumina trihydrate. The alumina trihydrate segment held the majority share in 2021 contributing to around ~59.90% with respect to the global non-metallurgical alumina market revenue. This is primarily owing to the rising construction activities along with the high demand for energy in the industrial sector are expected to propel market growth. For instance, as per the U.S. Census Bureau and the U.S.

    Department of Housing and Urban Development, in November 2022, around 1,342,000 privately‐owned housing units received building permits, and 1,427,000 housing units started construction in the United States. The growing construction activity owing to the rise in population is accelerating the growth of non-metallurgical alumina during the forecast period.

    Figure 2: Global Non-Metallurgical Alumina Market, by Type, 2021 & 2030 (USD Million)

    Source: Secondary Research, Primary Research, Market Research Future Database, and Analyst Review

    Non-Metallurgical Alumina Application Insights

    Based on Application, the global non-metallurgical alumina industry has been segmented into refractories, abrasives, ceramics, aluminum sulfate, ATH fire retardant, and others. The refractories held the largest segment share in 2021, owing to the rise in private as well as public investments in infrastructural sectors. Non-metallurgical bauxite is in high demand for refractories.

    The second fastest-growing segment in the non-metallurgical alumina industry is ceramics. Population growth continued industrialization, and the challenge to meet global demand for special commodity products are expected to play a key role in shaping the ceramics sector.

    Get more detailed insights about Non-Metallurgical Alumina Market Research Report—Global Forecast till 2030

    Regional Insights

    By Region, the study segments the market into North America, Europe, Asia-Pacific, and the Rest of the World. The Asia-Pacific non-metallurgical alumina market accounted for USD 946.87 million in 2021 and is expected to exhibit a 7.06 % CAGR during the study period. The growing infrastructure development in emerging economies has led to a strong increase in the demand for commodities like cement, slag conditioners, and alumina-based compounds.

    For instance, India's non-metallurgical alumina market is among the fastest growing market as India is one of the largest emerging markets in the Asia-Pacific region. According to the Ministry of Mines, bauxite production in India recorded 75.11 Lakh tonne in 2022, the highest ever bauxite production as compared to the previous year. Hence, Asia-Pacific is anticipated to register the highest growth rate over the forecast period from 2022–2030.

    Further, the major countries studied are The U.S., Canada, Germany, France, the UK, Italy, Spain, China, Japan, India, Australia, South Korea, and Brazil.

    Figure 3: GLOBAL NON-METALLURGICAL ALUMINA MARKET SHARE BY REGION 2021 (%)

    NON-METALLURGICAL ALUMINA MARKET SHARE BY REGION 2021

    Source: Secondary Research, Primary Research, Market Research Future Database, and Analyst Review

    North America's non-metallurgical alumina market accounts for the second-largest market share due to the rising infrastructure activities along with high demand from refractories. Further, the US non-metallurgical alumina market held the largest market share, and the Canadian non-metallurgical alumina market also holds a significant market share in the North American region.

    The Europe non-metallurgical alumina market is expected to grow at a CAGR of 6.41% from 2022 to 2030. This is due to growing industrialization, along with rapid demand for non-metallurgical alumina for various applications. Moreover, the German non-metallurgical alumina market held the largest market share, and the France non-metallurgical alumina market was the fastest-growing market in the European region

    Key Players and Competitive Insights

    Major market players are spending a lot of money on R&D to increase their product lines, which will help the non-metallurgical alumina market grow even more. Market participants are also taking a range of strategic initiatives to grow their worldwide footprint, including new product launches, contractual agreements, mergers and acquisitions, increased investments, and collaboration with other organizations. Competitors in the non-metallurgical alumina industry must offer cost-effective items to expand and survive in an increasingly competitive and rising market environment.

    One of the primary business strategies adopted by manufacturers in the global non-metallurgical alumina industry to benefit clients and expand the non-metallurgical alumina market sector is to manufacture locally to reduce operating costs. In recent years, non-metallurgical alumina has come up with various features with some of the most significant benefits.

    Key Companies in the Non Metallurgical Alumina Market market include

    Industry Developments

    In July 2022, Aluminum Corporation of China Limited (Chalco) acquires a 19% Stake in Yunnan Aluminium. After the transaction, Chalco is the largest shareholder of Yunnan Aluminium, holding 29.10% of the shares.

    In October 2021, Alcoa of Australia Limited (AoA), a subsidiary of Alcoa Corporation formed a joint venture with Western Australia-based FYI Resources Ltd for development activities to produce high-purity alumina, or HPA to enter the growing high-purity alumina market to address the increasing demand for sustainable products through a joint development project.

    In June 2023,

     The Chinese government announced that it would be increasing its support for the domestic alumina industry. The government plans to provide subsidies for alumina production and investment in new capacity.

    Future Outlook

    Non Metallurgical Alumina Market Future Outlook

    The Global Non-Metallurgical Alumina Market is poised for growth at 6.92% CAGR from 2024 to 2035, driven by increasing demand in various industrial applications and advancements in processing technologies.

    New opportunities lie in:

    • Invest in sustainable alumina production technologies to enhance environmental compliance.
    • Develop specialized alumina products for emerging applications in electronics and ceramics.
    • Expand distribution networks in developing regions to capture growing market demand.

    By 2035, the market is expected to achieve robust growth, reflecting evolving industrial needs and technological advancements.

    Market Segmentation

    Non-Metallurgical Alumina Type Outlook

    • Calcined Alumina
    • Alumina Trihydrate

    Non-Metallurgical Alumina Regional Outlook

    North America
    • US
    • Canada

    Non-Metallurgical Alumina Application Outlook

    • Refractories
    • Abrasives
    • Ceramics
    • Aluminum Sulphate
    • ATH Fire Retardant
    • Others

    Report Scope

    Report Attribute/Metric Details
    Market Size 2021 USD 1,885.00 million
    Market Size 2022 USD 2,009.41 million
    Market Size 2030 USD 3,380.43 million
    Compound Annual Growth Rate (CAGR) 6.72% (2022-2030)
    Base Year 2021
    Forecast Period 2022-2030
    Historical Data 2019 & 2020
    Forecast Units Value (USD million)
    Report Coverage Revenue Forecast, Competitive Landscape, Growth Factors, and Trends
    Segments Covered Type, Application, and Region
    Geographies Covered North America, Europe, Asia Pacific, and the Rest of the World
    Countries Covered The U.S, Canada, Germany, France, the UK, Italy, Spain, China, Japan, India, Australia, South Korea, and Brazil
    Key Companies Profiled Alcoa Corporation, Almatis GMBH, Alteo Alumina, Alumina D.O.O – Zvornik, Dadco Alumina and Chemicals Limited, Hindalco Industries Ltd, Aluminum Corporation of China Limited, Atlantic Alumina Company (ATALCO), RUSAL and PT Indonesia Chemical Alumina (ICA)
    Key Market Opportunities The increasing use of hi-tech, specialist applications
    Key Market Dynamics Increasing demand from end-use industries

    Market Highlights

    Author

    Anshula Mandaokar
    Team Lead - Research

    She holds an experience of about 6+ years in market research and business consulting, working under the spectrum of information communication technology, telecommunications and semiconductor domains. aarti conceptualizes and implements a scalable business strategy and provides strategic leadership to the clients. her expertise lies in market estimation, competitive intelligence, pipeline analysis, customer assessment, etc.

    Leave a Comment

    Latest Comments

    John Doe
    john@example.com

    This is a great article! Really helped me understand the topic better.

    Posted on July 23, 2025, 10:15 AM
    Jane Smith
    jane@domain.com

    Thanks for sharing this. I’ve bookmarked it for later reference.

    Posted on July 22, 2025, 7:45 PM

    FAQs

    How much is the non-metallurgical alumina market?

    1,885.00 million (2021)

    How Big is the China non-metallurgical alumina market?

    550.13 million (2021)

    Which region held the largest market share in the non-metallurgical alumina market?

    Asia Pacific

    Who are the key players in the non-metallurgical alumina market?

    Alcoa Corporation, Almatis GMBH, Alteo Alumina, Alumina D.O.O – Zvornik, Dadco Alumina and Chemicals Limited, Hindalco Industries Ltd, Aluminum Corporation of China Limited, Atlantic Alumina Company (ATALCO), RUSAL and PT Indonesia Chemical Alumina (ICA)

    Which Type led the non-metallurgical alumina market?

    Alumina Trihydrate

    Which application had the largest market share in the non-metallurgical alumina market?

    Refractories

    1. Executive Summary
    2. Scope of the Report
      1. Market
      2. Definition
      3. 2.2
      4. Scope of the Study
      5. 2.3
      6. List of Assumptions
      7. 2.4
      8. Markets Structure
      9. 3
      10. Market Research Methodology
      11. Research Process
      12. Primary Research
      13. Secondary Research
      14. Market Size Estimation
      15. Forecast Model
    3. Market Factor Analysis
      1. Supply Chain Analysis
        1. Raw Material Suppliers
        2. Manufacturers/Service Providers of Non-Metallurgical
        3. End-Users
      2. Alumina
      3. 4.1.3
      4. Distributors/Retailers/Wholesalers/E-Commerce Merchants
      5. Porter’s Five Forces Model
        1. Threat of New Entrants
        2. Intensity
        3. Threat of Substitutes
        4. Bargaining Power of Suppliers
        5. Bargaining Power of Buyers
      6. of Competitive Rivalry
      7. Pricing Analysis
    4. Market Dynamics
      1. of Global Non-Metallurgical Alumina Market
      2. Introduction
      3. Drivers
      4. Restraints
      5. Opportunities
      6. Challenges
    5. Global Non-Metallurgical Alumina Market, by Type
      1. Introduction
      2. Calcined Alumina
        1. Market Estimates
        2. Market Estimates & Forecast, by Region, 2019–2030
      3. & Forecast, 2019–2030
      4. Alumina Trihydrate
        1. Market Estimates &
        2. Market Estimates & Forecast, by Region, 2019–2030
      5. 6.4
      6. Forecast, 2019–2030
    6. Global Non-Metallurgical
    7. Alumina Market, by Application
      1. Introduction
      2. Refractories
        1. Market Estimates & Forecast, 2019–2030
        2. Market Estimates &
      3. Forecast, by Region, 2019–2030
      4. Abrasives
        1. Market Estimates & Forecast, 2019–2030
        2. Market Estimates
      5. & Forecast, by Region, 2019–2030
      6. Ceramics
        1. Market Estimates & Forecast, 2019–2030
        2. Market Estimates
      7. & Forecast, by Region, 2019–2030
      8. Aluminum Sulphate
        1. Market Estimates & Forecast, 2019–2030
        2. Market Estimates
      9. & Forecast, by Region, 2019–2030
      10. ATH Fire Retardant
        1. Market Estimates & Forecast, 2019–2030
        2. Market Estimates
      11. & Forecast, by Region, 2019–2030
      12. Others
        1. Market Estimates & Forecast, 2019–2030
        2. Market Estimates
      13. & Forecast, by Region, 2019–2030
    8. Global Non-Metallurgical Alumina Market, by Region
      1. Introduction
      2. North America
        1. Market Estimates
        2. Market Estimates & Forecast, by Type, 2019–2030
        3. Market Estimates
        4. US
      3. & Forecast, 2019–2030
      4. & Forecast, by Application, 2019–2030
      5. & Forecast, by Type, 2019–2030
      6. 8.2.5
      7. Canada
      8. 8.2.5.1
      9. Market Estimates & Forecast, 2019–2030
      10. 8.2.5.3
    9. Market Estimates & Forecast, by Application, 2019–2030
      1. Europe
        1. Market Estimates &
        2. Market Estimates & Forecast, by Type, 2019–2030
        3. Market Estimates
        4. Germany
      2. Forecast, 2019–2030
      3. & Forecast, by Application, 2019–2030
      4. & Forecast, by Type, 2019–2030
      5. 8.3.5
      6. France
      7. 8.3.5.1
      8. Market Estimates & Forecast, 2019–2030
      9. 8.3.5.3
    10. Market Estimates & Forecast, by Application, 2019–2030
      1. Forecast, 2019–2030
      2. & Forecast, by Application, 2019–2030
      3. & Forecast, by Type, 2019–2030
      4. 8.3.8
      5. UK
      6. 8.3.8.1
      7. Market Estimates & Forecast, 2019–2030
      8. 8.3.8.3
    11. Italy
    12. Market Estimates &
    13. Market Estimates & Forecast, by Type, 2019–2030
    14. Market Estimates
    15. Spain
    16. Market Estimates & Forecast, 2019–2030
    17. Market Estimates
    18. Market Estimates & Forecast, by Application,
    19. Market Estimates & Forecast, by Type,
    20. Market Estimates & Forecast, by Application, 2019–2030
      1. Forecast, 2019–2030
      2. & Forecast, by Application, 2019–2030
      3. & Forecast, by Type, 2019–2030
      4. 8.4
      5. Asia-Pacific
      6. 8.4.1.1
      7. Market Estimates & Forecast, 2019–2030
      8. 8.4.1.3
    21. Russia
    22. Market Estimates &
    23. Market Estimates & Forecast, by Type, 2019–2030
    24. Market Estimates
    25. Rest of Europe
    26. Market Estimates & Forecast, 2019–2030
    27. Market Estimates
    28. Market Estimates & Forecast, by Application,
    29. Market Estimates & Forecast, by Type,
    30. Market Estimates & Forecast, by Application, 2019–2030
      1. Forecast, 2019–2030
      2. & Forecast, by Application, 2019–2030
      3. & Forecast, by Type, 2019–2030
      4. 8.4.4
      5. Japan
      6. 8.4.4.1
      7. Market Estimates & Forecast, 2019–2030
      8. 8.4.4.3
    31. China
    32. Market Estimates &
    33. Market Estimates & Forecast, by Type, 2019–2030
    34. Market Estimates
    35. India
    36. Market Estimates & Forecast, 2019–2030
    37. Market Estimates
    38. Market Estimates & Forecast, by Application,
    39. Market Estimates & Forecast, by Type,
    40. Market Estimates & Forecast, by Application, 2019–2030
      1. Forecast, 2019–2030
      2. & Forecast, by Application, 2019–2030
      3. & Forecast, by Type, 2019–2030
      4. 8.5
      5. Latin America
      6. 8.5.1.1
      7. Market Estimates & Forecast, 2019–2030
      8. 8.5.1.3
    41. Indonesia
    42. Market Estimates &
    43. Market Estimates & Forecast, by Type, 2019–2030
    44. Market Estimates
    45. Rest of Asia-Pacific
    46. Market Estimates & Forecast, 2019–2030
    47. Market Estimates
    48. Market Estimates & Forecast, by Application,
    49. Market Estimates & Forecast, by Type,
    50. Market Estimates & Forecast, by Application, 2019–2030
      1. Forecast, 2019–2030
      2. & Forecast, by Application, 2019–2030
      3. & Forecast, by Type, 2019–2030
      4. 8.5.4
      5. Rest of Latin America
      6. 8.5.4.1
      7. Market Estimates & Forecast, 2019–2030
      8. 8.5.4.3
    51. Brazil
    52. Market Estimates &
    53. Market Estimates & Forecast, by Type, 2019–2030
    54. Market Estimates
    55. Mexico
    56. Market Estimates & Forecast, 2019–2030
    57. Market Estimates
    58. Market Estimates & Forecast, by Application,
    59. Market Estimates & Forecast, by Type,
    60. Market Estimates & Forecast, by Application, 2019–2030
      1. Middle East & Africa
      2. & Forecast, 2019–2030
      3. & Forecast, by Application, 2019–2030
      4. & Forecast, by Type, 2019–2030
      5. 8.6.3
      6. GCC
      7. 8.6.3.1
      8. Market Estimates & Forecast, 2019–2030
      9. 8.6.3.3
    61. Market Estimates
    62. Market Estimates & Forecast, by Type, 2019–2030
    63. Market Estimates
    64. South Africa
    65. Market Estimates & Forecast, 2019–2030
    66. Market Estimates
    67. Market Estimates & Forecast, by Application,
    68. Market Estimates & Forecast, by Type,
    69. Market Estimates & Forecast, by Application, 2019–2030
      1. & Africa
      2. 8.6.4.1
      3. Market Estimates & Forecast, 2019–2030
      4. 8.6.4.3
    70. Rest of the Middle East
    71. Market Estimates & Forecast, by Type,
    72. Market Estimates & Forecast, by Application, 2019–2030
    73. Competitive Landscape
      1. Introduction
      2. Market Key Strategies
      3. Competitive Benchmarking
      4. Key Development Analysis
      5. (Expansions/Mergers & Acquisitions/Joint Ventures/New Non-Metallurgical Alumina
      6. Developments/Agreements/Investments)
    74. Company Profiles
      1. Alcoa Corporation
        1. Company Overview
        2. Financial Overview
        3. Products Offered
        4. Key Developments
        5. SWOT Analysis
        6. Key Strategies
      2. Almatis Gmbh
      3. Alteo Alumina
      4. Alumina D.O.O – Zvornik
      5. Dadco Alumina and Chemicals
      6. Limited
      7. 10.6
      8. Hindalco Industries Ltd
      9. Aluminum Corporation of China Limited
      10. Atlantic Alumina Company (ATALCO)
      11. RUSAL
      12. PT Indonesia Chemical
      13. Alumina (ICA)
      14. 11
      15. Appendix
      16. LIST
    75. OF TABLES
      1. Table
    76. 1: Global Non-Metallurgical Alumina Market, by region, 2019–2030
      1. Table 2: North America:
    77. Non-Metallurgical Alumina Market, by Country, 2019–2030
      1. Table 3: Europe: Non-Metallurgical
    78. Alumina Market, by Country, 2019–2030
      1. Table 4: Asia-Pacific: Non-Metallurgical Alumina
    79. Market, by Country, 2019–2030
      1. Table 5: Middle East & Africa: Non-Metallurgical Alumina
    80. Market, by Country, 2019–2030
      1. Table 6: Latin America: Non-Metallurgical Alumina Market,
      2. by Country, 2019–2030
    81. Table 13: Global Non-Metallurgical Alumina Type Market, by Region,
      1. Table
    82. 14: North America: Non-Metallurgical Alumina Type Market, by Country, 2019–2030
      1. Table 15: Europe: Non-Metallurgical
    83. Alumina Type Market, by Country, 2019–2030
      1. Table 16: Asia-Pacific: Non-Metallurgical Alumina
    84. Type Market, by Country, 2019–2030
      1. Table 17: Middle East & Africa: Non-Metallurgical Alumina
    85. Type Market, by Country, 2019–2030
      1. Table 18: Latin America: Non-Metallurgical Alumina Type
    86. Market, by Country, 2019–2030
      1. Table 19: Global Non-Metallurgical Alumina Type Market,
      2. by Region, 2019–2030
      3. Table 20: North America: Non-Metallurgical Alumina Type Market, by
      4. Country, 2019–2030
    87. Table 21: Europe: Non-Metallurgical Alumina Type Market, by Country,
      1. Table
    88. 22: Asia-Pacific: Non-Metallurgical Alumina Type Market, by Country, 2019–2030
      1. Table 23: Middle East
    89. & Africa: Non-Metallurgical Alumina Type Market, by Country, 2019–2030
      1. Table 24: Latin America:
    90. Non-Metallurgical Alumina Type Market, by Country, 2019–2030
      1. Table 25: Global Non-Metallurgical
    91. Alumina Type Market, by Region, 2019–2030
      1. Table 26: Global Non-Metallurgical Alumina Type Market,
      2. by Region, 2019–2030
    92. Table 27: North America: Non-Metallurgical Alumina Market, by Country,
      1. Table
    93. 29: North America: Non-Metallurgical Alumina Market, by Type, 2019–2030
      1. Table 30: North America:
    94. Non-Metallurgical Alumina Market, by Application, 2019–2030
      1. Table 31: Europe: Non-Metallurgical
    95. Alumina Market, by Country, 2019–2030
      1. Table 32: Europe: Non-Metallurgical Alumina Market,
      2. by Type, 2019–2030
    96. Table 33: Europe: Non-Metallurgical Alumina Market, by Application,
      1. Table
    97. 34: Asia-Pacific: Non-Metallurgical Alumina Market, by Country, 2019–2030
      1. Table 35: Asia-Pacific:
    98. Non-Metallurgical Alumina Market, by Type, 2019–2030
      1. Table 36: Asia-Pacific: Non-Metallurgical Alumina
    99. Market, by Application, 2019–2030
      1. Table 37: Middle East & Africa: Non-Metallurgical Alumina
    100. Market, by Country, 2019–2030
      1. Table 38: Middle East & Africa: Non-Metallurgical Alumina
    101. Market, by Type, 2019–2030
      1. Table 39: Middle East & Africa: Non-Metallurgical Alumina Market,
      2. by Application, 2019–2030
    102. Table 40: Latin America: Non-Metallurgical Alumina Market, by Country,
      1. Table
    103. 41: Latin America: Non-Metallurgical Alumina Market, by Type, 2019–2030
      1. Table 42: Latin America:
    104. Non-Metallurgical Alumina Market, by Application, 2019–2030
    105. LIST OF FIGURES
    106. Global
      1. Non-Metallurgical Alumina Market Segmentation
    107. Forecast Research Methodology
    108. Porter’s
      1. Five Forces Analysis of Global Non-Metallurgical Alumina Market
    109. Value Chain/Supply Chain
      1. of Global Non-Metallurgical Alumina Market
    110. Share of Global Non-Metallurgical Alumina
    111. Market, by Country, 2021 (%)
    112. Global Non-Metallurgical Alumina Market, 2019–2030
    113. Global Non-Metallurgical
    114. Alumina Market Size, by Type, 2019–2030
    115. Share of Global Non-Metallurgical Alumina
    116. Market, by Type, 2020 (%)
    117. Global Non-Metallurgical Alumina Market Size, by Application,
      1. FIGURE
    118. Share of Global Non-Metallurgical Alumina Market, by Application, 2021 (%)
    Non-Metallurgical Alumina Market Segmentation

    Non-Metallurgical Alumina Type Outlook (USD Million, 2019–2030)

    • Calcined Alumina
    • Alumina Trihydrate

    Non-Metallurgical Alumina Application Outlook (USD Million, 2019–2030)

    • Refractories
    • Abrasives
    • Ceramics
    • Aluminum Sulphate
    • ATH Fire Retardant
    • Others

    Non-Metallurgical Alumina Regional Outlook (USD Million, 2019–2030)

    • North America Outlook (USD Million, 2019–2030)

      • North America Non-Metallurgical Alumina by Type
        • Calcined Alumina
        • Alumina Trihydrate
      • North America Non-Metallurgical Alumina by Application
        • Refractories
        • Abrasives
        • Ceramics
        • Aluminum Sulphate
        • ATH Fire Retardant
        • Others
    • US Outlook (USD Million, 2019–2030)

      • US Non-Metallurgical Alumina by Type
        • Calcined Alumina
        • Alumina Trihydrate
      • US Non-Metallurgical Alumina by Application
        • Refractories
        • Abrasives
        • Ceramics
        • Aluminum Sulphate
        • ATH Fire Retardant
        • Others
      • CANADA Outlook (USD Million, 2019–2030)

      • CANADA Non-Metallurgical Alumina by Type
        • Calcined Alumina
        • Alumina Trihydrate
      • CANADA Non-Metallurgical Alumina by Application
        • Refractories
        • Abrasives
        • Ceramics
        • Aluminum Sulphate
        • ATH Fire Retardant
        • Others
    • Europe Outlook (USD Million, 2019–2030)

      • Europe Non-Metallurgical Alumina by Type
        • Calcined Alumina
        • Alumina Trihydrate
      • Europe Non-Metallurgical Alumina by Application
        • Refractories
        • Abrasives
        • Ceramics
        • Aluminum Sulphate
        • ATH Fire Retardant
        • Others
    • Germany Outlook (USD Million, 2019–2030)

      • Germany Non-Metallurgical Alumina by Type
        • Calcined Alumina
        • Alumina Trihydrate
      • Germany Non-Metallurgical Alumina by Application
        • Refractories
        • Abrasives
        • Ceramics
        • Aluminum Sulphate
        • ATH Fire Retardant
        • Others
    • France Outlook (USD Million, 2019–2030)

      • France Non-Metallurgical Alumina by Type
        • Calcined Alumina
        • Alumina Trihydrate
      • France Non-Metallurgical Alumina by Application
        • Refractories
        • Abrasives
        • Ceramics
        • Aluminum Sulphate
        • ATH Fire Retardant
        • Others
    • UK Outlook (USD Million, 2019–2030)

      • UK Non-Metallurgical Alumina by Type
        • Calcined Alumina
        • Alumina Trihydrate
      • UK Non-Metallurgical Alumina by Application
        • Refractories
        • Abrasives
        • Ceramics
        • Aluminum Sulphate
        • ATH Fire Retardant
        • Others
    • ITALY Outlook (USD Million, 2019–2030)

      • ITALY Non-Metallurgical Alumina by Type
        • Calcined Alumina
        • Alumina Trihydrate
      • ITALY Non-Metallurgical Alumina by Application
        • Refractories
        • Abrasives
        • Ceramics
        • Aluminum Sulphate
        • ATH Fire Retardant
        • Others
    • SPAIN Outlook (USD Million, 2019–2030)

      • Spain Non-Metallurgical Alumina by Type
        • Calcined Alumina
        • Alumina Trihydrate
      • Spain Non-Metallurgical Alumina by Application
        • Refractories
        • Abrasives
        • Ceramics
        • Aluminum Sulphate
        • ATH Fire Retardant
        • Others
    • Rest Of Europe Outlook (USD Million, 2019–2030)

      • Rest of Europe Non-Metallurgical Alumina by Type
        • Calcined Alumina
        • Alumina Trihydrate
      • REST of EUROPE Non-Metallurgical Alumina by Application
        • Refractories
        • Abrasives
        • Ceramics
        • Aluminum Sulphate
        • ATH Fire Retardant
        • Others
    • Asia-Pacific Outlook (USD Million, 2019–2030)

      • Asia-Pacific Non-Metallurgical Alumina by Type
        • Calcined Alumina
        • Alumina Trihydrate
      • Asia-Pacific Non-Metallurgical Alumina by Application
        • Refractories
        • Abrasives
        • Ceramics
        • Aluminum Sulphate
        • ATH Fire Retardant
        • Others
    • China Outlook (USD Million, 2019–2030)

      • China Non-Metallurgical Alumina by Type
        • Calcined Alumina
        • Alumina Trihydrate
      • China Non-Metallurgical Alumina by Application
        • Refractories
        • Abrasives
        • Ceramics
        • Aluminum Sulphate
        • ATH Fire Retardant
        • Others
    • Japan Outlook (USD Million, 2019–2030)

      • Japan Non-Metallurgical Alumina by Type
        • Calcined Alumina
        • Alumina Trihydrate
      • Japan Non-Metallurgical Alumina by Application
        • Refractories
        • Abrasives
        • Ceramics
        • Aluminum Sulphate
        • ATH Fire Retardant
        • Others
    • India Outlook (USD Million, 2019–2030)

      • India Non-Metallurgical Alumina by Type
        • Calcined Alumina
        • Alumina Trihydrate
      • India Non-Metallurgical Alumina by Application
        • Refractories
        • Abrasives
        • Ceramics
        • Aluminum Sulphate
        • ATH Fire Retardant
        • Others
    • Indonesia Outlook (USD Million, 2019–2030)

      • Indonesia Non-Metallurgical Alumina by Type
        • Calcined Alumina
        • Alumina Trihydrate
      • Indonesia Non-Metallurgical Alumina by Application
        • Refractories
        • Abrasives
        • Ceramics
        • Aluminum Sulphate
        • ATH Fire Retardant
        • Others
    • Rest of Asia-Pacific Outlook (USD Million, 2019–2030)

      • Rest of Asia-Pacific Non-Metallurgical Alumina by Type
        • Calcined Alumina
        • Alumina Trihydrate
      • Rest of Asia-Pacific Non-Metallurgical Alumina by Application
        • Refractories
        • Abrasives
        • Ceramics
        • Aluminum Sulphate
        • ATH Fire Retardant
        • Others
    • Rest of the World Outlook (USD Million, 2019–2030)

      • Rest of the World Non-Metallurgical Alumina by Type
        • Calcined Alumina
        • Alumina Trihydrate
      • Rest of the World Non-Metallurgical Alumina by Application
        • Refractories
        • Abrasives
        • Ceramics
        • Aluminum Sulphate
        • ATH Fire Retardant
        • Others
    • Middle East Outlook (USD Million, 2019–2030)

      • Middle East Non-Metallurgical Alumina by Type
        • Calcined Alumina
        • Alumina Trihydrate
      • Middle East Non-Metallurgical Alumina by Application
        • Refractories
        • Abrasives
        • Ceramics
        • Aluminum Sulphate
        • ATH Fire Retardant
        • Others
    • Africa Outlook (USD Million, 2019–2030)

      • Africa Non-Metallurgical Alumina by Type
        • Calcined Alumina
        • Alumina Trihydrate
      • Africa Non-Metallurgical Alumina by Application
        • Refractories
        • Abrasives
        • Ceramics
        • Aluminum Sulphate
        • ATH Fire Retardant
        • Others
    • Latin America Outlook (USD Million, 2019–2030)

      • Latin America Non-Metallurgical Alumina by Type
        • Calcined Alumina
        • Alumina Trihydrate
      • Latin America Non-Metallurgical Alumina by Application
        • Refractories
        • Abrasives
        • Ceramics
        • Aluminum Sulphate
        • ATH Fire Retardant
        • Others
    Infographic

    Free Sample Request

    Kindly complete the form below to receive a free sample of this Report

    Get Free Sample

    Customer Strories

    “I am very pleased with how market segments have been defined in a relevant way for my purposes (such as "Portable Freezers & refrigerators" and "last-mile"). In general the report is well structured. Thanks very much for your efforts.”

    Victoria Milne

    Founder
    Case Study
    Chemicals and Materials