Non Dispersive Infrared Market (2026 – 2035)

ID: MRFR/SEM/20508-HCR 128 Pages Ankit Gupta Last Updated: September 17, 2026
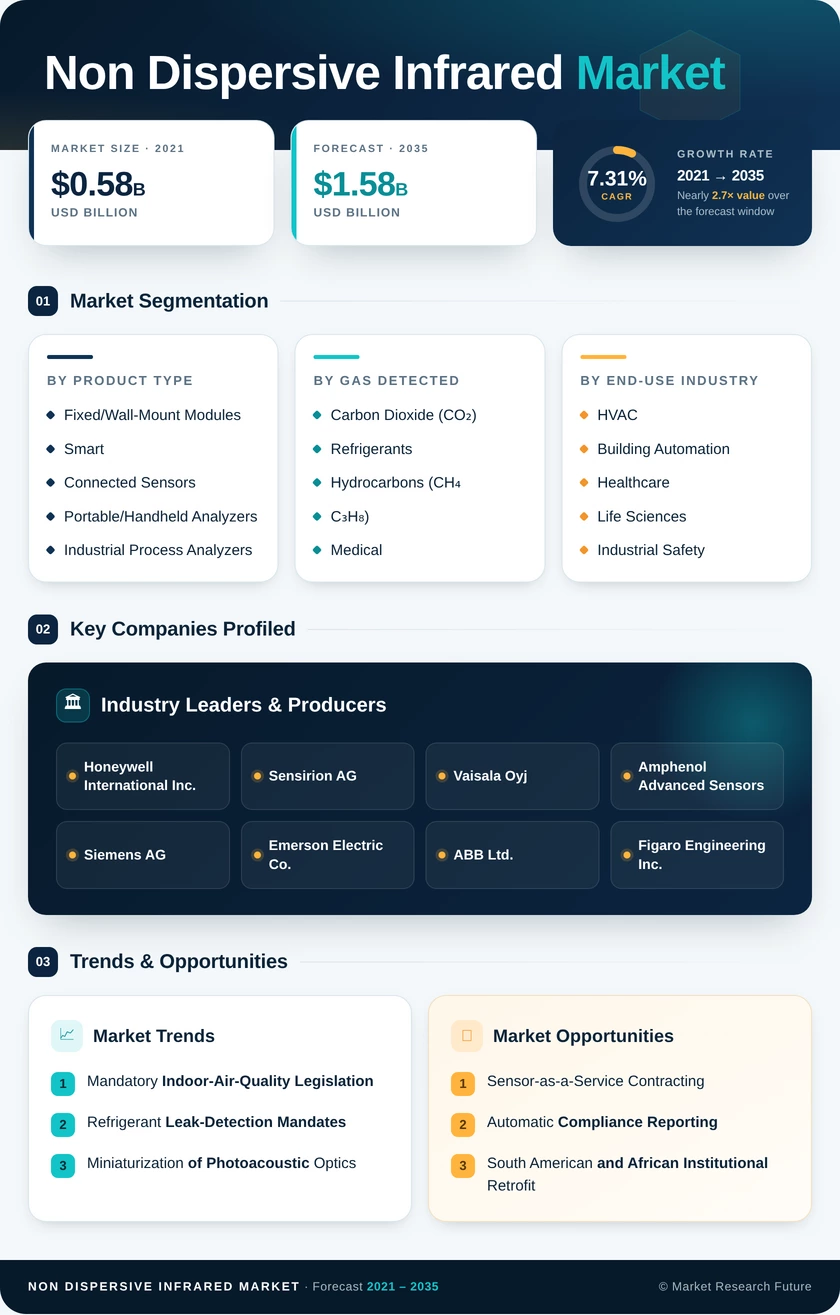
Non Dispersive Infrared Market Size, Share and Research Report By Product Type (Fixed/Wall-Mount Modules, Smart and Connected Sensors, Portable/Handheld Analyzers, Industrial Process Analyzers), By Gas Detected (Carbon Dioxide, Refrigerants, Hydrocarbons, Medical and Anesthetic Gases), By End-Use Industry (HVAC and Building Automation, Healthcare and Life Sciences, Industrial Safety, Automotive and Transportation, Agriculture), By Platform (Module-Level Sensors, PCB-Mount Chip Sensors, Standalone Instruments, Integrated System Nodes), By Regional (North America, Europe, Asia-Pacific, South America, Middle East & Africa) - Industry Forecast to 2035.
Non Dispersive Infrared Market
Market Size
Forecast Period2026-2035
CAGR (2026-2035)7.31%
2025 Market SizeUSD 0.81 Billion
2035 Market SizeUSD 1.58 Billion
Key Players
Honeywell International Inc.
Sensirion AG
Vaisala Oyj
Amphenol Advanced Sensors
Siemens AG
Emerson Electric Co.
Opportunities
  • Sensor-as-a-Service Contracting
  • Automatic Compliance Reporting
  • South American and African Institutional Retrofit
  1. 1 Market Summary | |
    1. 1.1 Study Assumptions & Market Definition | |
    2. 1.2 Scope of the Study | |
    3. 1.3 Research Methodology | |
  2. 2 Key Report Takeaways | |
    1. 2.1 By Product Type | |
    2. 2.2 By Gas Detected | |
    3. 2.3 By End-Use Industry | |
    4. 2.4 By Platform | |
    5. 2.5 By Region | |
  3. 3 Market Size and Forecast (2021–2035) | |
    1. 3.1 Historical Market Size (2021–2024) | |
    2. 3.2 Base Year Estimate (2025) | |
    3. 3.3 Forecast Market Size (2026–2035) | |
    4. 3.4 Year-over-Year Growth Analysis | |
  4. 4 Driver Impact Analysis | |
    1. 4.1 Mandatory Indoor-Air-Quality Legislation | |
    2. 4.2 Refrigerant Leak-Detection Mandates | |
    3. 4.3 Miniaturization of Photoacoustic Optics | |
    4. 4.4 Vehicle Cabin and EV Thermal Monitoring | |
    5. 4.5 Green-Building Certification Schemes | |
    6. 4.6 Calibration-Free Warranty Economics | |
    7. 4.7 Controlled-Environment Agriculture | |
  5. 5 Restraints Impact Analysis | |
    1. 5.1 Price Compression from High-Volume Manufacturers | |
    2. 5.2 Optical Bench Cost Floor Versus MEMS Alternatives | |
    3. 5.3 Fragmented Enforcement Outside OECD Markets | |
    4. 5.4 Cross-Sensitivity and Humidity Error in Field Use | |
    5. 5.5 Retrofit Labor Scarcity in Building Services | |
  6. 6 Opportunities | |
    1. 6.1 Sensor-as-a-Service Contracting | |
    2. 6.2 Automatic Compliance Reporting | |
    3. 6.3 South American and African Institutional Retrofit | |
    4. 6.4 Automotive Design-In Cycles | |
    5. 6.5 Carbon-Capture and Process Verification | |
  7. 7 Regional Market Share and Country-Level Analysis | |
    1. 7.1 North America | | |
      1. 7.1.1 US | | |
      2. 7.1.2 Canada | | |
      3. 7.1.3 Mexico | |
    2. 7.2 Europe | | |
      1. 7.2.1 Germany | | |
      2. 7.2.2 UK | | |
      3. 7.2.3 France | | |
      4. 7.2.4 Italy | | |
      5. 7.2.5 Spain | | |
      6. 7.2.6 Nordic Countries | | |
      7. 7.2.7 Russia | | |
      8. 7.2.8 Rest of Europe | |
    3. 7.3 Asia-Pacific | | |
      1. 7.3.1 China | | |
      2. 7.3.2 India | | |
      3. 7.3.3 Japan | | |
      4. 7.3.4 South Korea | | |
      5. 7.3.5 ASEAN | | |
      6. 7.3.6 Rest of Asia-Pacific | |
    4. 7.4 South America | | |
      1. 7.4.1 Brazil | | |
      2. 7.4.2 Argentina | | |
      3. 7.4.3 Rest of South America | |
    5. 7.5 Middle East & Africa | | |
      1. 7.5.1 Saudi Arabia | | |
      2. 7.5.2 UAE | | |
      3. 7.5.3 South Africa | | |
      4. 7.5.4 Egypt | | |
      5. 7.5.5 Rest of MEA | |
  8. 8 Future Outlook (2026–2035) | |
    1. 8.1 Edge Intelligence Replaces Scheduled Maintenance | |
    2. 8.2 Networked Sensing Economics | |
    3. 8.3 Decarbonization Measurement Infrastructure | |
    4. 8.4 Consumer and Mobility Channel Maturation | |
  9. 9 Segmentation Analysis | |
    1. 9.1 By Product Type | | |
      1. 9.1.1 Fixed/Wall-Mount Modules | | |
      2. 9.1.2 Smart and Connected Sensors | | |
      3. 9.1.3 Portable/Handheld Analyzers | | |
      4. 9.1.4 Industrial Process Analyzers | |
    2. 9.2 By Gas Detected | | |
      1. 9.2.1 Carbon Dioxide (CO₂) | | |
      2. 9.2.2 Refrigerants | | |
      3. 9.2.3 Hydrocarbons (CH₄, C₃H₈) | | |
      4. 9.2.4 Medical and Anesthetic Gases | |
    3. 9.3 By End-Use Industry | | |
      1. 9.3.1 HVAC and Building Automation | | |
      2. 9.3.2 Healthcare and Life Sciences | | |
      3. 9.3.3 Industrial Safety and Process | | |
      4. 9.3.4 Automotive and Transportation | | |
      5. 9.3.5 Agriculture and Food Processing | |
    4. 9.4 By Platform | | |
      1. 9.4.1 Module-Level Sensors | | |
      2. 9.4.2 PCB-Mount Chip Sensors | | |
      3. 9.4.3 Standalone Instruments | | |
      4. 9.4.4 Integrated System Nodes | |
  10. 10 Competitive Landscape | |
    1. 10.1 Market Concentration Analysis | |
    2. 10.2 Competitive Benchmarking Matrix | |
    3. 10.3 Company Profiles | |
  11. 11 Recent News & Developments | |
  12. 12 Report Scope and Methodology | |
  13. 13 Detailed Sources and Citations | |
  14. 14 Frequently Asked Questions | | LIST OF TABLES | |
  15. TABLE 1 Global Non-Dispersive Infrared Market Size & Forecast, by Revenue (USD Billion), 2021–2035 | |
  16. TABLE 2 Global Non-Dispersive Infrared Market – Year-over-Year Growth Analysis, 2021–2035 | |
  17. TABLE 3 Driver Impact Analysis – Global Non-Dispersive Infrared Market, 2026–2035 | |
  18. TABLE 4 Restraint Impact Analysis – Global Non-Dispersive Infrared Market, 2026–2035 | |
  19. TABLE 5 Global Non-Dispersive Infrared Market Size, by Region, 2021–2035 (USD Billion) | |
  20. TABLE 6 North America Non-Dispersive Infrared Market Size, by Country, 2021–2035 (USD Billion) | |
  21. TABLE 7 Europe Non-Dispersive Infrared Market Size, by Country, 2021–2035 (USD Billion) | |
  22. TABLE 8 Asia-Pacific Non-Dispersive Infrared Market Size, by Country, 2021–2035 (USD Billion) | |
  23. TABLE 9 South America Non-Dispersive Infrared Market Size, by Country, 2021–2035 (USD Billion) | |
  24. TABLE 10 Middle East & Africa Non-Dispersive Infrared Market Size, by Country, 2021–2035 (USD Billion) | |
  25. TABLE 11 Global Non-Dispersive Infrared Market Size, by Product Type, 2021–2035 (USD Billion) | |
  26. TABLE 12 Global Non-Dispersive Infrared Market Size, by Gas Detected, 2021–2035 (USD Billion) | |
  27. TABLE 13 Global Non-Dispersive Infrared Market Size, by End-Use Industry, 2021–2035 (USD Billion) | |
  28. TABLE 14 Global Non-Dispersive Infrared Market Size, by Platform, 2021–2035 (USD Billion) | |
  29. TABLE 15 Competitive Benchmarking Matrix – Global Non-Dispersive Infrared Market, 2026 | |
  30. TABLE 16 Recent Developments & Strategic Announcements, 2023–2025 | |
  31. TABLE 17 Report Scope & Methodology Summary | |
  32. TABLE 18 Detailed Sources and Citations Index | |
  33. TABLE 19 Segmentation Quick Reference – Dominant and Fastest Growing Segments | |
  34. TABLE 20 Regional Investment Themes Summary, 2026–2035 | | LIST OF FIGURES | |
  35. FIGURE 1 Global Non-Dispersive Infrared Market Dynamics – Drivers, Restraints, Opportunities | |
  36. FIGURE 2 Industry Value Chain Analysis – Non-Dispersive Infrared Market | |
  37. FIGURE 3 Porter's Five Forces Analysis – Non-Dispersive Infrared Market | |
  38. FIGURE 4 Global Market Size Trend and Forecast, 2021–2035 (USD Billion) | |
  39. FIGURE 5 Year-over-Year Growth Rate Trend, 2022–2035 (%) | |
  40. FIGURE 6 Market Share by Product Type, 2025 vs 2035 (%) | |
  41. FIGURE 7 Market Share by Gas Detected, 2025 (%) | |
  42. FIGURE 8 Market Share by End-Use Industry, 2025 (%) | |
  43. FIGURE 9 Market Share by Platform, 2025 (%) | |
  44. FIGURE 10 Regional Revenue Share Distribution, 2025 (%) | |
  45. FIGURE 11 Regional CAGR Comparison, 2026–2035 (%) | |
  46. FIGURE 12 Country-Level Growth Heat Map, 2026–2035 | |
  47. FIGURE 13 Competitive Landscape Positioning Matrix, 2026 | |
  48. FIGURE 14 Estimated Revenue Share Ranges of Key Players, 2025 (%) | |
  49. FIGURE 15 Technology Adoption Curve – Optical Versus Alternative Sensing Platforms

Segmentation Quick Reference

DimensionSub-SegmentsDominant SegmentFastest Growing Segment
By Product TypeFixed/Wall-Mount Modules; Smart and Connected Sensors; Portable/Handheld Analyzers; Industrial Process AnalyzersFixed/Wall-Mount Modules (40.20% share, 2025)Smart and Connected Sensors (7.85% CAGR)
By Gas DetectedCarbon Dioxide (CO₂); Refrigerants; Hydrocarbons (CH₄, C₃H₈); Medical and Anesthetic GasesCarbon Dioxide (CO₂) (USD 0.40 Billion, 2025)Refrigerants (8.34% CAGR)
By End-Use IndustryHVAC and Building Automation; Healthcare and Life Sciences; Industrial Safety and Process; Automotive and Transportation; Agriculture and Food ProcessingHVAC and Building Automation (33.40% share, 2025)Healthcare and Life Sciences (7.92% CAGR)
By PlatformModule-Level Sensors; PCB-Mount Chip Sensors; Standalone Instruments; Integrated System NodesModule-Level Sensors (46.90% share, 2025)PCB-Mount Chip Sensors (7.98% CAGR)


Market Segmentation Overview

By Product Type

Sub-SegmentKey Trend
Fixed/Wall-Mount ModulesCompliance retrofit specification default across institutional buildings
Smart and Connected SensorsWireless firmware updates and Matter interoperability opening installer base
Portable/Handheld AnalyzersSIL2-certified units aligned to refinery turnaround audit schedules
Industrial Process AnalyzersExplosion-proof enclosures meeting petrochemical megasite requirements


Fixed/Wall-Mount Modules lead this dimension because ventilation codes name a permanently installed measurement point, and specifiers reuse approved part numbers across portfolios. Smart and Connected Sensors grow fastest since remote firmware delivery removes technician visits that facility managers price at USD 150–250 each, and Thread networking cuts repeater counts on large sites. Portable/Handheld Analyzers stay relevant where occupational safety auditing requires a mobile instrument rather than a fixed point, while Industrial Process Analyzers move on capital cycles tied to refinery and petrochemical expansion.

By Gas Detected

Sub-SegmentKey Trend
Carbon Dioxide (CO₂)Named compliance proxy in ventilation and certification standards
RefrigerantsNarrow-bandpass optics separating R-1234yf from water vapor
Hydrocarbons (CH₄, C₃H₈)Displacement of catalytic pellistors in high-H₂S environments
Medical and Anesthetic GasesMainstream airway sensing replacing sidestream sampling


Carbon Dioxide (CO₂) anchors revenue because regulators write concentration thresholds in ppm and auditors demand logged evidence, making it unavoidable in every ventilation project. Refrigerants grow fastest as F-Gas and Kigali deadlines force automatic leak detection onto equipment that previously relied on manual inspection, and the optical complexity involved supports premium pricing. Hydrocarbons (CH₄, C₃H₈) shift toward optical detection because sour-gas fields cannot tolerate ignition sources, while Medical and Anesthetic Gases remain a small, accuracy-bound segment governed by ±0.3 vol-% requirements.

By End-Use Industry

Sub-SegmentKey Trend
HVAC and Building AutomationDemand-controlled ventilation credits under certification schemes
Healthcare and Life SciencesCapnography expanding from operating rooms into emergency bays
Industrial Safety and ProcessExposure-limit alerting below 5,000 ppm thresholds
Automotive and TransportationCabin monitoring linked to drowsiness prevention and range management
Agriculture and Food ProcessingEnrichment control in vertical farms and controlled-atmosphere packaging


HVAC and Building Automation dominates because the addressable footprint — schools, hotels, offices, coworking space — is the largest of any vertical and retrofit tax credits absorb up to 30% of project cost. Healthcare and Life Sciences grows fastest as hospitals move from one capnography instrument per operating room to continuous monitoring at every emergency bay, a specification jump that multiplies units per facility. Industrial Safety and Process buyers hold steady volume tied to exposure-limit compliance, while Automotive and Transportation demand arrives on multi-year platform design cycles.

By Platform

Sub-SegmentKey Trend
Module-Level SensorsSwappable IP65 housings with Modbus ports for field retrofit
PCB-Mount Chip SensorsPhotoacoustic packages near 14 mm entering consumer devices
Standalone InstrumentsReference-grade verification for calibration and audit workflows
Integrated System NodesSensing bundled directly into building management controllers


Module-Level Sensors hold the largest share because industrial service practice is organized around swappable units, and preserving decades-old field routines matters more to maintenance teams than package size. PCB-Mount Chip Sensors grow fastest as sealed photoacoustic cavities with active heaters solve condensation failures and shrink footprints enough for smartwatches and dashboard vents, where volumes dwarf industrial channels. Standalone Instruments persist as calibration references rather than growth drivers, and Integrated System Nodes gain where controller vendors absorb sensing into their own hardware.




Download PDF ×

We do not share your information with anyone. However, we may send you emails based on your report interest from time to time. You may contact us at any time to opt-out.