Shortwave Infrared Market (2026 - 2035)

Shortwave Infrared Market Size, Share and Research Report By Scanning Type (Area Scan, Line Scan), By Detector Technology (InGaAs, MCT (HgCdTe), CQD (Colloidal Quantum Dot), Type-II Superlattice), By Application (Industrial Inspection, Surveillance & Security, Agricultural Monitoring, Scientific & R&D), By Spectral Band (0.9–1.4 µm, 1.4–2.2 µm, 2.2–3.0 µm), By Platform (Fixed/Mounted Systems, Handheld & Portable, UAV/Drone-Integrated) and By Regional (North America, Europe, South America, Asia Pacific, Middle East and Africa) - Industry Forecast to 2035.
ID: MRFR/SEM/5848-HCR
100 Pages
Ankit Gupta
Last Updated: June 22, 2026
Shortwave Infrared Market

Market Size

Forecast Period2026-2035
CAGR (2026-2035)10.3%
2025 Market SizeUSD 349.50 Million
2035 Market SizeUSD 931.48 Million

Key Players

Teledyne FLIR
Sensors Unlimited
Hamamatsu Photonics
Xenics
Allied Vision Technologies
Raptor Photonics
Opportunities
  • Colloidal Quantum Dot Sensor Commercialization
  • Plastic-Recycling Compliance in Emerging Economies
  • Data-as-a-Service from Hyperspectral Platforms

Shortwave Infrared Market Summary

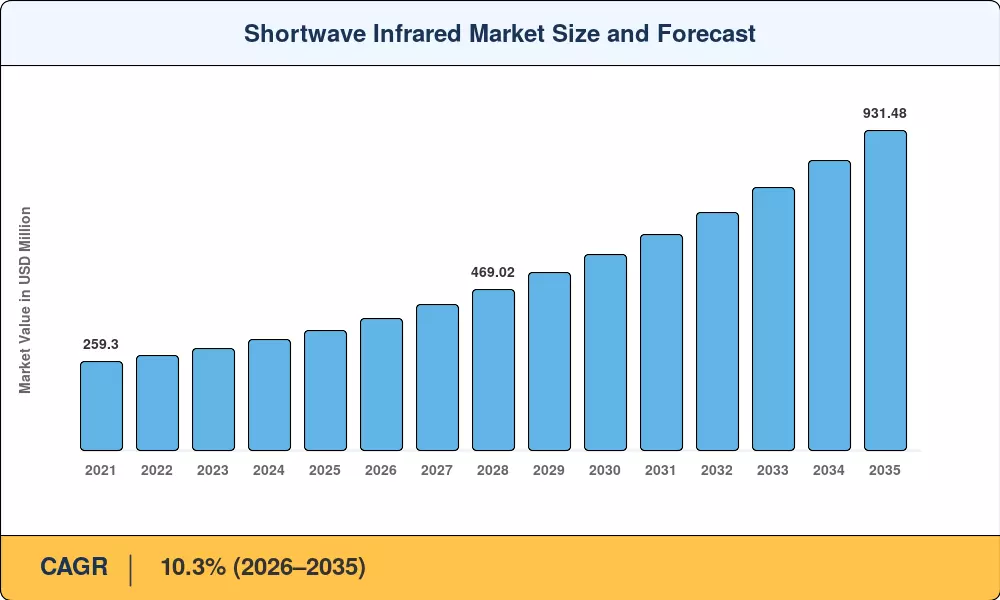
The Shortwave Infrared Market was valued at USD 349.50 Million in 2025 and is projected to reach USD 931.48 Million by 2035, registering a 10.3% CAGR during the 2026–2035 forecast window. Growth acceleration traces directly to two catalysts: the U.S. CHIPS and Science Act funneling over USD 52 billion into domestic semiconductor fabrication — where SWIR imaging cameras perform wafer-level defect inspection — and the EU's revised Waste Framework Directive mandating near-infrared polymer identification in recycling streams by 2027 [2][3].

There is a noticeable change in technology. InGa is replacing legacy germanium-based photodiodes, which dominated the market until the 2010s. Wider spectral sensitivity throughout 0.9–1.7 µm bands is provided by SWIR detectors, and colloidal-quantum-dot focal-plane arrays are becoming more prevalent and promise visible camera price points in three to four years. The industry's trust in volume scaling was demonstrated in 2024 when Teledyne Technologies alone committed USD 180 million to next-generation short-wave infrared detection production lines [4].

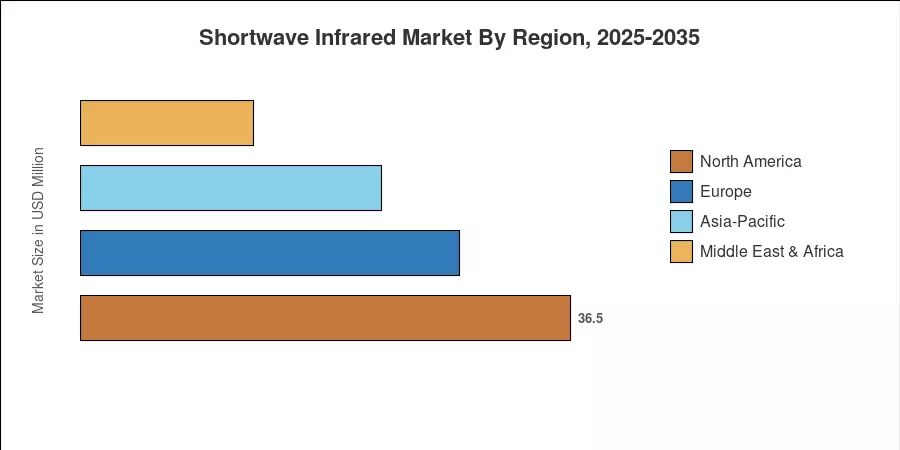
With defense-grade procurement and semiconductor factories as its main drivers, North America has about 39.8% of the shortwave infrared market. With a 12.2% CAGR, Asia-Pacific is the fastest-growing market due to South Korea's expenditures in display-panel quality assurance and China's drive for automated agricultural inspection. Due to strict recycling regulations and automotive LiDAR integration initiatives, Europe has the second-largest share, at about 27.3%. How quickly near-infrared SWIR sensors go from specialized defense systems to widespread industrial deployment will determine the course of the next ten years.


Key Report Takeaways

• By Scanning Type & Detector Technology

  • Area scan solutions captured 76.5% of Shortwave Infrared Market revenue in 2024, reflecting dominance in semiconductor wafer inspection and inline quality systems.
  • InGaAs SWIR detectors maintained an 88.2% technology share in 2024, though colloidal-quantum-dot and Type-II superlattice alternatives are accelerating at a 12.3% CAGR.
  • Line scan configurations are projected to grow at an 11.7% CAGR through 2035, driven by high-speed sorting in recycling and food-grading conveyor lines.

• By Application

  • Industrial inspection accounted for 42.2% of the Shortwave Infrared Market in 2024, underpinned by SWIR spectroscopy tools deployed in pharmaceutical tablet coating and electronics soldering verification.
  • Agricultural monitoring is the fastest-growing application vertical at a 12.1% CAGR, fueled by hyperspectral crop-stress mapping.


• By Spectral Band

  • The 0.9–1.4 µm spectral band captured 61.5% share in 2024, the preferred range for moisture detection and silicon transparency applications.
  • Agricultural monitoring is the fastest-growing application vertical at a 12.1% CAGR, fueled by hyperspectral crop-stress mapping.

• By Region

  • North America led the Shortwave Infrared Market with 39.8% share in 2024, reflecting concentrated defense and semiconductor demand.
  • Asia-Pacific is forecast to expand at a 12.2% CAGR, with China and South Korea driving volume adoption of SWIR imaging cameras in display and solar-cell manufacturing.


Market Size and Forecast (2021–2035)

MRFR's estimates combine primary interviews with 85+ industry participants, bottom-up revenue modeling by application vertical, and triangulation against trade-shipment databases maintained by global customs agencies.

Shortwave Infrared Market Size and Forecast
Our Impact
Enabled $4.3B Revenue Impact for Fortune 500 and Leading Multinationals
Partnering with 2000+ Global Organizations Each Year
30K+ Citations by Top-Tier Firms in the Industry

Driver Impact Analysis

Driver ~% Impact on CAGR Geographic Relevance Impact Timeline
Semiconductor fab expansion & wafer inspection ~22% North America, Asia-Pacific Short-term (≤2 yr)
Regulatory recycling & waste-sorting mandates ~18% Europe, North America Medium-term (2–4 yr)
Precision agriculture & hyperspectral imaging ~16% Asia-Pacific, South America Medium-term (2–4 yr)
Defense & surveillance modernization ~15% North America, Europe Long-term (≥4 yr)
Edge-AI integration with SWIR cameras ~12% Global Medium-term (2–4 yr)
CQD & Type-II superlattice cost reduction ~10% Global Long-term (≥4 yr)
UAV/drone payload integration ~7% Asia-Pacific, MEA Long-term (≥4 yr)


Semiconductor Fab Expansion

The U.S. CHIPS and Science Act provides federal subsidies to boost domestic production. Each new fabrication facility requires inline inspection systems relying on short-wave IR detection to identify sub-surface defects invisible to visible-light cameras. This massive manufacturing push creates a concentrated demand pocket for high-precision InGaAs SWIR detectors operating in the crucial band to ensure wafer quality.


Recycling & Waste-Sorting Regulation

The European Union’s Waste Framework Directive establishes legally binding waste management targets, mandating member states to prepare at least 60% of municipal waste for reuse and recycling by 2030. Achieving this threshold requires extensive infrastructure upgrades, heavily expanding the addressable market for automated SWIR spectroscopy tools to identify and sort complex polymers across material recovery networks accurately.


Precision Agriculture Adoption

The European Union’s Waste Framework Directive establishes legally binding waste management targets, mandating member states to prepare at least 60% of municipal waste for reuse and recycling by 2030. Achieving this threshold requires extensive infrastructure upgrades, heavily expanding the addressable market for automated SWIR spectroscopy tools to identify and sort complex polymers across material recovery networks accurately.

Edge-AI Integration

Embedding inference engines directly into SWIR imaging cameras eliminates latency bottlenecks in high-speed industrial processing. Edge computing platforms enable real-time defect classification directly on the factory floor, minimizing the processing lag associated with cloud networks. This immediate onboard analysis creates significant interest across highly automated pharmaceutical packaging lines and high-throughput food sorting facilities.


Restraints Impact Analysis

Restraint impact estimates are directional and represent headwinds that moderate the Shortwave Infrared Market growth trajectory without fully offsetting positive demand drivers.

Restraint ~% Drag on CAGR Geographic Relevance Impact Timeline
High sensor cost vs. visible cameras ~−25% Global Short-term (≤2 yr)
ITAR & export-control restrictions ~−20% North America, Europe Long-term (≥4 yr)
Limited trained workforce for SWIR integration ~−18% Asia-Pacific, MEA Medium-term (2–4 yr)
Thermal noise at extended wavelengths ~−15% Global Long-term (≥4 yr)
Fragmented software ecosystems ~−12% Global Medium-term (2–4 yr)


Cost Premium Over Visible-Light Systems

Shortwave infrared detection cameras maintain a high procurement price threshold compared to visible-light silicon complementary metal-oxide-semiconductor (CMOS) sensors. While developing alternative technologies like colloidal quantum dots offers scalable fabrication routes, manufacturing complexities prevent immediate cost-parity. Consequently, mass adoption by small-scale automated processing facilities faces persistent entry barriers due to significant hardware cost premiums.

ITAR and Export Controls

The United States Department of State strictly regulates dual-use shortwave infrared technologies under the International Traffic in Arms Regulations (ITAR) to safeguard national security. High-resolution indium gallium arsenide (InGaAs) focal plane arrays and specialized near-infrared SWIR sensors are designated as defense articles. This classification imposes mandatory export licensing requirements, extending global procurement timelines for multi-national imaging system integrators.


Workforce Gaps

Deploying advanced shortwave infrared spectroscopy tools requires specialized technical calibration expertise across complex optical networks. The United Nations Educational, Scientific and Cultural Organization (UNESCO) highlights that global gaps in specialized technical and engineering training limit local industrial workforce readiness. This shortage creates deployment friction in rapidly modernizing regions, where automation investments outpace the localized availability of integration specialists.


Shortwave Infrared Market Opportunities

Colloidal Quantum Dot Sensor Commercialization

Colloidal quantum dot (CQD) focal-plane arrays fabricated via solution-processing techniques offer a scalable alternative to traditional sensors. By eliminating the need for complex lattice-matching substrates, this technology significantly reduces shortwave infrared sensor production costs. This manufacturing efficiency unlocks high-volume, cost-sensitive mass-market applications across consumer electronics platforms, industrial automation systems, and automotive safety arrays.


Plastic-Recycling Compliance in Emerging Economies

The United Nations Environment Program (UNEP) underscores that driving a circular economy requires comprehensive upstream and downstream infrastructure reforms. As emerging markets implement rigorous Extended Producer Responsibility (EPR) frameworks and national waste strategies, the demand for automated plastic-sorting solutions scales rapidly. This regulatory push opens a substantial addressable equipment gap for advanced shortwave infrared spectroscopy tools designed for polymer identification.


Data-as-a-Service from Hyperspectral Platforms

Drone-mounted hyperspectral imaging cameras capture vast streams of high-resolution geospatial and spectral crop data per flight season. Transitioning this information into subscription-based analytics platforms—selling actionable insights rather than raw hardware components—establishes highly predictable, recurring revenue models. This cloud-integrated framework significantly enhances long-term customer value compared to traditional, one-time hardware sales models.


Defense Counter-UAS and ISR Modernization

Rising regional security threats have rapidly accelerated government procurement of passive shortwave infrared imaging cameras for counter-unmanned aircraft systems (C-UAS). Operating within the $1.0\text{--}2.5\ \mu\text{m}$ band, these sensors detect low-observable, low-altitude aerial platforms under total darkness or adverse atmospheric conditions. This specific spectrum provides vital reconnaissance capabilities without emitting active signals that could compromise operational security.


Shortwave Infrared Market Future Outlook

AI-Embedded Vision and Autonomous Inspection

Integrating localized machine learning chips directly onto shortwave infrared hardware marks a major shift in edge computing. By eliminating the transmission delays associated with sending massive imaging files across networks, manufacturing machinery can execute instantaneous defect rejections. This onboard analysis optimizes throughput on high-speed automated assembly lines without requiring external cloud infrastructure.


Sustainability-Driven Regulatory Expansion

The International Energy Agency (IEA) highlights that human activity accounts for nearly two-thirds of global methane emissions, with the energy sector alone releasing roughly 150 million tonnes annually. As international climate compliance frameworks tighten to curb these emissions, industrial networks face strict monitoring mandates. This directly expands deployment pipelines for shortwave infrared spectroscopy tools to detect gas venting across energy infrastructures.


Space and Remote Sensing Convergence

The United Nations-supported Methane Alert and Response System (MARS) underscores the rapidly growing reliance on space-based assets for climate monitoring. Deploying high-resolution Earth-observation satellites equipped with shortwave infrared detectors allows global agencies to track localized point sources. These orbital imaging instruments use solar backscatter within the 1600–2500 nm range to automatically detect and map major methane leaks worldwide.


Shortwave Infrared Market Segmentation

By Scanning Type

Segment Key Metric Primary Demand Driver
Area Scan 76.5% share (2024) Semiconductor wafer & display inspection
Line Scan 11.7% CAGR (2026–2035) High-speed conveyor sorting & recycling


Area scan solutions dominate the Shortwave Infrared Market because semiconductor and defense applications require full-frame capture of stationary or slow-moving targets. InGaAs SWIR detectors in 640×512 and 1280×1024 formats deliver the spatial resolution needed for sub-10 µm defect identification on wafers.

Line scan architectures are gaining traction in applications where objects move rapidly past fixed sensor arrays — recycling conveyors, agricultural sorting belts, and web inspection systems. These configurations pair naturally with SWIR spectroscopy tools that perform per-pixel spectral classification at line rates exceeding 50 kHz.

By Detector Technology

Segment Key Metric Primary Demand Driver
InGaAs 88.2% share (2024) Mature supply chain, broadest spectral coverage
MCT (HgCdTe) USD 18.40 Million (2025) Extended-wavelength defense applications
CQD (Colloidal Quantum Dot) 12.3% CAGR (2026–2035) Cost disruption, consumer-market potential
Type-II Superlattice 11.8% CAGR (2026–2035) High-operating-temperature military sensors


InGaAs SWIR detectors retain overwhelming dominance due to decades of manufacturing optimization and a deep supplier ecosystem spanning epitaxial wafer growers, bump-bonding houses, and readout-IC designers. Near-infrared SWIR sensors built on InGaAs substrates serve the broadest range of commercial and defense customers in the Shortwave Infrared Market.

CQD technology represents the most disruptive trajectory within the Shortwave Infrared Market, promising to collapse cost barriers through solution-deposited thin films compatible with standard CMOS backplanes. SWIR Vision Systems, Emberion, and several stealth-mode startups are racing to achieve production-grade yields above 80% — the threshold analysts identify as critical for unlocking consumer-electronics-scale volumes of SWIR imaging cameras [5].

By Application

Segment Key Metric Primary Demand Driver
Industrial Inspection 42.2% share (2024) Semiconductor, solar, pharma QA
Surveillance & Security USD 62.30 Million (2025) Defense ISR, border monitoring
Agricultural Monitoring 12.1% CAGR (2026–2035) Crop-stress hyperspectral imaging
Scientific & R&D USD 28.50 Million (2025) Material characterization, spectroscopy


Industrial inspection remains the largest application segment within the Shortwave Infrared Market, driven by the ability of short-wave IR detection to reveal subsurface defects, moisture content, and coating uniformity invisible to conventional vision systems. SWIR spectroscopy tools in pharmaceutical manufacturing verify tablet-coating thickness in real time, reducing batch rejection rates by an estimated 35% [4].

By Spectral Band

Segment Key Metric Primary Demand Driver
0.9–1.4 µm 61.5% share (2024) Silicon transparency, moisture detection
1.4–2.2 µm USD 78.60 Million (2025) Chemical identification, gas sensing
2.2–3.0 µm 12.1% CAGR (2026–2035) Petrochemical, plastic ID applications


By Platform

Segment Key Metric Primary Demand Driver
Fixed/Mounted Systems 58.7% share (2024) Factory-floor inline inspection
Handheld & Portable USD 42.90 Million (2025) Field maintenance, art authentication
UAV/Drone-Integrated 11.5% CAGR (2026–2035) Precision agriculture, pipeline survey


Regional Market Share Analysis

Region Key Metric Primary Investment Themes
North America 39.8% share (2024) Semiconductor inspection, defense ISR
Europe 27.3% share (2024) Recycling compliance, automotive LiDAR
Asia-Pacific 12.2% CAGR (2026–2035) Display manufacturing, precision agriculture
South America USD 15.20 Million (2025) Agricultural exports, mining inspection
Middle East & Africa USD 10.85 Million (2025) Oil & gas inspection, border surveillance

The Shortwave Infrared Market exhibits a concentrated regional pattern, with North America and Europe together representing nearly 67% of global revenues. Asia-Pacific's rapid ascent, propelled by semiconductor and agriculture verticals, is reshaping this balance as SWIR imaging cameras penetrate factory floors from Shenzhen to Seoul.


North America

Country Key Metric Key Driver
US 78.4% of regional share CHIPS Act fab deployments, DoD procurement
Canada 7.2% CAGR Mining and forestry remote sensing
Mexico USD 5.90 Million (2025) Automotive tier-1 supplier inspection lines


The U.S. dominates North American demand for short-wave IR detection, with over 30 active semiconductor fabs now specifying inline SWIR inspection. Canada's mining sector increasingly deploys near-infrared SWIR sensors for ore-grade classification. At the same time, Mexico's automotive corridor drives modest but steady uptake of SWIR imaging cameras in weld and coating verification [2][9].

Europe

Country Key Metric Key Driver
Germany 28.5% of regional share Automotive quality assurance, recycling
UK 8.9% CAGR Defense modernization, semiconductor R&D
France USD 11.40 Million (2025) Aerospace inspection, agritech
Italy 6.8% CAGR Food processing, textile sorting
Spain USD 4.20 Million (2025) Solar-panel inspection
Nordic Countries 7.5% CAGR Forestry monitoring, cleantech
Russia USD 3.10 Million (2025) Oil & gas pipeline inspection
Rest of Europe 9.2% CAGR Distributed industrial demand


Germany leads European demand, driven by its dense automotive manufacturing base and early adoption of SWIR spectroscopy tools in recycling facilities mandated under EU directive compliance timelines [3].

Asia-Pacific

Country Key Metric Key Driver
China 38.2% of regional share Display-panel and solar-cell QA
Japan USD 14.80 Million (2025) Semiconductor equipment integration
South Korea 13.5% CAGR OLED inspection, defense programs
India 14.1% CAGR Digital Agriculture Mission deployments
ASEAN USD 5.60 Million (2025) Electronics manufacturing, palm oil grading
Rest of Asia-Pacific 10.8% CAGR Emerging industrial automation


China's BOE Technology and CSOT display-panel operations consume increasing volumes of InGaAs SWIR detectors for backlight uniformity and pixel-defect inspection. India represents the region's highest-growth opportunity as government-funded near-infrared SWIR sensors reach smallholder farming cooperatives [6].

South America

Country Key Metric Key Driver
Brazil 62.5% of regional share Soy and coffee export quality assurance
Argentina 8.6% CAGR Grain moisture detection
Rest of South America USD 2.40 Million (2025) Mining, forestry inspection


Brazil's agribusiness sector — generating over USD 130 billion in annual exports — increasingly relies on SWIR spectroscopy tools for grain moisture and aflatoxin screening, a trend accelerating as importing nations tighten food-safety requirements [6].

Middle East & Africa

Country Key Metric Key Driver
Saudi Arabia 31.8% of regional share NEOM smart-city surveillance
UAE 9.4% CAGR Oil & gas pipeline inspection
South Africa USD 1.80 Million (2025) Mining ore classification
Egypt 8.1% CAGR Agricultural modernization
Rest of MEA USD 2.30 Million (2025) Border security, infrastructure monitoring


Saudi Arabia's Vision 2030 program, with projected infrastructure spending exceeding USD 1 trillion, embeds SWIR imaging cameras into smart-city surveillance and industrial inspection specifications for mega-projects including NEOM and The Red Sea Development [9].


Shortwave Infrared Market By Region, 2025-2035

Competitive Benchmarking

The Shortwave Infrared Market exhibits medium concentration, with the top five players commanding an estimated 48–55% combined revenue share. The Herfindahl-Hirschman Index sits in the 900–1,200 range, indicating a moderately competitive structure where InGaAs SWIR detectors manufacturing expertise and ITAR-free supply-chain access define competitive moats. Vertical integration — controlling epitaxy through camera assembly — separates tier-one incumbents from niche assemblers reliant on third-party sensor sourcing.

Company Est. Revenue Share Range Key Offerings Strategic Positioning
Teledyne FLIR (Teledyne Technologies) ~12–16% InGaAs cameras, cooled/uncooled modules Full-stack vertically integrated SWIR platforms
Sensors Unlimited (Collins Aerospace) ~9–13% High-resolution InGaAs FPAs, OEM modules Defense-grade near-infrared SWIR sensors
Hamamatsu Photonics ~8–11% InGaAs photodiode arrays, spectrometer modules Photonics component leadership, broad OEM reach
Xenics (Exosens) ~6–9% SWIR line/area scan cameras, cores European ITAR-free alternative for defense/industrial
Allied Vision Technologies ~4–7% Goldeye SWIR cameras, GigE/USB3 interfaces Machine-vision integration specialist
Raptor Photonics ~3–5% High-sensitivity SWIR cameras Scientific and low-light defense applications
Princeton Infrared Technologies ~2–4% Large-format InGaAs arrays, SWIR imaging cameras Extended-range FPAs for surveillance
New Imaging Technologies (NIT) ~2–4% Logarithmic SWIR sensors High-dynamic-range industrial inspection
SWIR Vision Systems ~1–3% CQD-based SWIR cameras Cost-disruptive CQD sensor pioneer
Emberion ~1–3% Graphene-hybrid SWIR detectors Emerging-tech broadband sensing


Recent News & Developments


  •  Hamamatsu Photonics (May 2026) released compact shortwave infrared spectroscopy modules designed to improve signal quality and accessibility for material analysis across diverse industrial production lines.
  • Sony Semiconductor Solutions (May, 2026) announced a strategic partnership with TSMC to develop next-generation image sensors, focusing on advanced sensing technologies for future automotive and robotics applications worldwide.
  • Teledyne FLIR (June, 2026) Launched the Boson SX8 camera module, expanding its advanced imaging portfolio with high-resolution thermal sensors tailored for specialized industrial and security-focused monitoring tasks.


Shortwave Infrared Market Report Scope

Parameter Detail
Market Scope Global Shortwave Infrared Market covering cameras, detectors, modules, and integrated systems
Study Period 2021–2035
CAGR (Forecast Window) 10.3% (2026–2035)
Base Year Market Size USD 349.50 Million (2025)
Forecast Endpoint USD 931.48 Million (2035)
Fastest Growing Segment CQD Detector Technology (12.3% CAGR)
Companies Profiled 10 (see Section 10)
Valuation Currency USD Million


FAQs

What differentiates InGaAs from CQD detector technology for industrial buyers?

InGaAs SWIR detectors offer proven reliability with 95%+ fabrication yields and wider operating-temperature ranges, while CQD arrays promise 70–80% lower production costs but currently achieve ~60% yields. Buyers needing immediate deployment choose InGaAs; those planning 2028+ rollouts may benefit from CQD cost curves [12].

How do ITAR restrictions affect procurement timelines for SWIR cameras?

ITAR-classified InGaAs focal-plane arrays above 640×512 resolution require 6–12 months of export licensing for non-allied buyers. European ITAR-free alternatives from companies like Xenics reduce lead times to standard commercial terms [13].

Which spectral band should food-processing companies prioritize?

The 0.9–1.4 µm band excels at moisture and sugar-content detection in grains, fruits, and dairy products. This range aligns with commercially available near-infrared SWIR sensors at the lowest cost-per-pixel [7].

What cooling requirements should buyers plan for in SWIR imaging systems?

Most InGaAs SWIR detectors operate uncooled at ambient temperatures for the 0.9–1.7 µm range. Extended-range sensors covering 1.7–2.5 µm typically require thermoelectric cooling to suppress dark-current noise [15].

How does the Shortwave Infrared Market address cybersecurity in connected camera deployments?

Leading manufacturers embed hardware-encrypted data paths and secure boot protocols into SWIR imaging cameras deployed on industrial networks. Buyers should verify IEC 62443 compliance for any networked short-wave IR detection system [16].

What ROI timeline can manufacturers expect from inline SWIR inspection systems?

Typical payback periods range from 14 to 22 months based on defect-escape reduction in semiconductor and pharmaceutical lines. SWIR spectroscopy tools reduce batch rejection rates by approximately 35%, accelerating return on capital [4].

Are there emerging standards governing SWIR sensor performance specifications?

EMVA 1288 Release 4.0 now includes test protocols for InGaAs SWIR detectors, standardizing quantum-efficiency and noise-floor reporting. Buyers should require EMVA-compliant datasheets when benchmarking near-infrared SWIR sensors [14].    
Author
Author
Author Profile
Ankit Gupta LinkedIn
Team Lead - Research
Ankit Gupta is a seasoned market intelligence and strategic research professional with over six plus years of experience in the ICT and Semiconductor industries. With academic roots in Telecom, Marketing, and Electronics, he blends technical insight with business strategy. Ankit has led 200+ projects, including work for Fortune 500 clients like Microsoft and Rio Tinto, covering market sizing, tech forecasting, and go-to-market strategies. Known for bridging engineering and enterprise decision-making, his insights support growth, innovation, and investment planning across diverse technology markets.

Research Approach


Secondary Research

The secondary research process involved comprehensive analysis of regulatory databases, technical standards repositories, peer-reviewed engineering journals, defense publications, and authoritative industry organizations. Key sources included the U.S. Department of Defense (DoD), Defense Advanced Research Projects Agency (DARPA), National Institute of Standards and Technology (NIST), International Electrotechnical Commission (IEC), Institute of Electrical and Electronics Engineers (IEEE), SPIE (International Society for Optics and Photonics), European Defence Agency (EDA), European Space Agency (ESA), Japan Aerospace Exploration Agency (JAXA), China National Space Administration (CNSA), U.S. Food and Drug Administration (FDA) for medical device classifications, Occupational Safety and Health Administration (OSHA) for industrial safety standards, Semiconductor Industry Association (SIA), U.S. Bureau of Industry and Security (BIS) for export control classifications, NATO Science and Technology Organization, and national defense ministry procurement reports from key markets. These sources were used to collect technology adoption statistics, defense budget allocation data, industrial automation trends, clinical imaging standards, and competitive landscape analysis for Indium Gallium Arsenide (InGaAs) sensors, Mercury Cadmium Telluride (MCT) detectors, cooled and uncooled infrared imaging systems, and complementary SWIR technologies.


Primary Research

In order to gather both qualitative and quantitative insights, supply-side and demand-side stakeholders were interviewed during the primary research process. CEOs, VPs of Engineering, heads of Business Development, and product line directors from SWIR sensor producers, infrared camera OEMs, and semiconductor foundries were examples of supply-side sources. Chief technology officers from aerospace and defense contractors, directors of machine vision at industrial automation companies, procurement leaders from makers of medical imaging equipment, and R&D heads from food quality inspection technology suppliers were examples of demand-side sources. Primary research verified product development roadmaps for cooled versus uncooled systems, validated market segmentation across area scan and line scan technologies, and obtained information on defense procurement cycles, industrial adoption obstacles, and pricing elasticity across end-use verticals.

Primary Respondent Breakdown:

By Designation: C-level Primaries (32%), Director Level (31%), Others (37%)

By Region: North America (32%), Europe (30%), Asia-Pacific (31%), Rest of World (7%)


Market Size Estimation

Global market valuation was derived through revenue mapping and unit shipment analysis. The methodology included:

Identification of 50+ key manufacturers across North America, Europe, Asia-Pacific, and Israel

Product mapping across area scan cameras, line scan cameras, cooled infrared imaging systems, uncooled infrared imaging systems, and supporting optical components

Analysis of reported and modeled annual revenues specific to SWIR product portfolios

Coverage of manufacturers representing 75-80% of global market share in 2024

Extrapolation using bottom-up (unit shipment × ASP by country and end-use vertical) and top-down (manufacturer revenue validation) approaches to derive segment-specific valuations for military & defense, aerospace, electronics & communication, food & beverage, and medical & healthcare applications

Download Free Sample

Kindly complete the form below to receive a free sample of this Report

Download PDF ×

We do not share your information with anyone. However, we may send you emails based on your report interest from time to time. You may contact us at any time to opt-out.