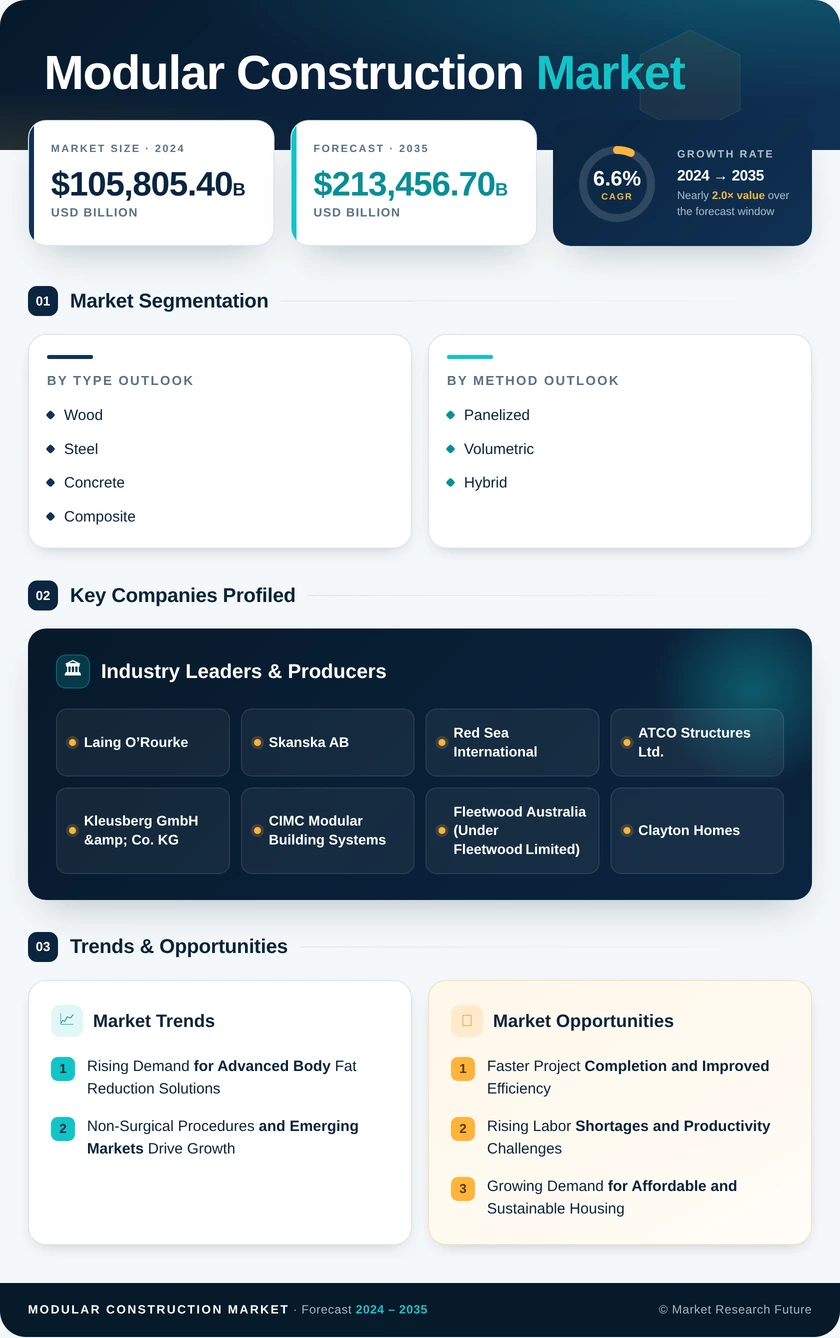
Modular Construction Market (2026 - 2035)

ID: MRFR/PCM/1150-CR 111 Pages Snehal Singh Last Updated: September 18, 2026
Modular Construction Market Research Report Information By Material (Steel, Concrete, Wood / Mass Timber, and Others (Composites, Plastics)), By Construction Type (Permanent Modular and Relocatable Modular), By Service Stage (New Construction and After-Sales Maintenance & Refurbishment), and By End-User Sector (Industrial / Institutional, Residential, and Commercial) – Forecast Till 2035.
Modular Construction Market
Market Size
Forecast Period2026-2035
CAGR (2026-2035)6.48%
2025 Market SizeUSD 84.90 Billion
2035 Market SizeUSD 158.38 Billion
Key Players
Sekisui House
WillScot Holdings
Daiwa House Industry
Modulaire Group
Skanska
Fluor Corporation
Opportunities
  • Modular Data Halls and Prefabricated Power Infrastructure
  • Emerging-Market Housing Delivery Platforms
  • Fleet Leasing and Space-as-a-Service Models
  1. 1 Market Summary | |
    1. 1.1 Study Assumptions & Market Definition | |
    2. 1.2 Scope of the Study | |
    3. 1.3 Research Methodology | |
  2. 2 Key Report Takeaways | |
    1. 2.1 By Material and Technology | |
    2. 2.2 By Sector | |
    3. 2.3 By Geography | |
  3. 3 Market Size & Forecast (2021–2035) | |
    1. 3.1 Historical Market Size (2021–2024) | |
    2. 3.2 Base Year Assessment (2025) | |
    3. 3.3 Forecast Market Size (2026–2035) | |
    4. 3.4 Year-over-Year Growth Analysis | |
  4. 4 Driver Impact Analysis | |
    1. 4.1 Skilled Trade Labour Shortages and Wage Inflation | |
    2. 4.2 Government Prefabrication Quotas and Public Procurement Rules | |
    3. 4.3 Embodied-Carbon Regulation and Green Building Codes | |
    4. 4.4 Data Centre and Healthcare Capacity Buildout | |
    5. 4.5 Affordable Housing Deficits and Rapid Rehousing Programmes | |
    6. 4.6 Digital Design Automation and Factory Robotics | |
  5. 5 Restraints Impact Analysis | |
    1. 5.1 Transport Corridor Limits on Module Dimensions | |
    2. 5.2 Fragmented Building Codes and Inspection Inconsistency | |
    3. 5.3 Lender Appraisal and Progress-Payment Friction | |
    4. 5.4 Factory Capital Intensity and Utilisation Risk | |
    5. 5.5 Factory Workforce and Supply-Chain Concentration | |
  6. 6 Opportunity Analysis | |
    1. 6.1 Modular Data Halls and Prefabricated Power Infrastructure | |
    2. 6.2 Emerging-Market Housing Delivery Platforms | |
    3. 6.3 Fleet Leasing and Space-as-a-Service Models | |
    4. 6.4 Vertical Extension and Retrofit of Existing Stock | |
    5. 6.5 Factory Telemetry and Digital Twin Monetisation | |
    6. 6.6 Industry Value Chain Analysis | |
    7. 6.7 Porter's Five Forces Analysis | |
  7. 7 Regional Market Share & Country-Level Analysis | |
    1. 7.1 North America | | |
      1. 7.1.1 US | | |
      2. 7.1.2 Canada | | |
      3. 7.1.3 Mexico | |
    2. 7.2 Europe | | |
      1. 7.2.1 Germany | | |
      2. 7.2.2 UK | | |
      3. 7.2.3 France | | |
      4. 7.2.4 Italy | | |
      5. 7.2.5 Spain | | |
      6. 7.2.6 Nordic Countries | | |
      7. 7.2.7 Russia | | |
      8. 7.2.8 Rest of Europe | |
    3. 7.3 Asia-Pacific | | |
      1. 7.3.1 China | | |
      2. 7.3.2 India | | |
      3. 7.3.3 Japan | | |
      4. 7.3.4 South Korea | | |
      5. 7.3.5 ASEAN | | |
      6. 7.3.6 Rest of Asia-Pacific | |
    4. 7.4 South America | | |
      1. 7.4.1 Brazil | | |
      2. 7.4.2 Argentina | | |
      3. 7.4.3 Rest of South America | |
    5. 7.5 Middle East & Africa | | |
      1. 7.5.1 Saudi Arabia | | |
      2. 7.5.2 UAE | | |
      3. 7.5.3 South Africa | | |
      4. 7.5.4 Egypt | | |
      5. 7.5.5 Rest of Middle East & Africa | |
  8. 8 Future Outlook (2026–2035) | |
    1. 8.1 Factory Automation and Machine Vision Quality Control | |
    2. 8.2 Platform Standardisation and Component Marketplaces | |
    3. 8.3 Whole-Life Carbon Accounting as a Bidding Currency | |
    4. 8.4 Grid Constraints and Energy-Positive Module Design | |
  9. 9 Segmentation Analysis | |
    1. 9.1 By Material | | |
      1. 9.1.1 Steel | | |
      2. 9.1.2 Concrete | | |
      3. 9.1.3 Wood / Mass Timber | | |
      4. 9.1.4 Others (Composites, Plastics) | |
    2. 9.2 By Construction Type | | |
      1. 9.2.1 Permanent Modular | | |
      2. 9.2.2 Relocatable Modular | |
    3. 9.3 By Service Stage | | |
      1. 9.3.1 New Construction | | |
      2. 9.3.2 After-Sales Maintenance & Refurbishment | |
    4. 9.4 By End-User Sector | | |
      1. 9.4.1 Industrial / Institutional | | |
      2. 9.4.2 Residential | | |
      3. 9.4.3 Commercial | |
  10. 10 Competitive Landscape | |
    1. 10.1 Market Concentration Analysis (2026) | |
    2. 10.2 Competitive Benchmarking Matrix | |
    3. 10.3 Company Profiles | | |
      1. 10.3.1 Sekisui House | | |
      2. 10.3.2 WillScot Holdings | | |
      3. 10.3.3 Daiwa House Industry | | |
      4. 10.3.4 Modulaire Group (Algeco) | | |
      5. 10.3.5 Skanska | | |
      6. 10.3.6 Fluor Corporation | | |
      7. 10.3.7 Bechtel | | |
      8. 10.3.8 ATCO | | |
      9. 10.3.9 Laing O'Rourke | | |
      10. 10.3.10 Red Sea International | | |
      11. 10.3.11 Guerdon Modular Buildings | |
  11. 11 Recent News & Developments | |
  12. 12 Report Scope & Methodology | |
    1. 12.1 Study Period & Base Year | |
    2. 12.2 Valuation Currency & Conversion Basis | |
    3. 12.3 Abbreviations | |
  13. 13 Detailed Sources & Citations | |
  14. 14 Frequently Asked Questions | | LIST OF TABLES | |
  15. TABLE 1 Global Modular Construction Market Size & Forecast, by Revenue (USD Billion), 2021–2035 | |
  16. TABLE 2 Global Modular Construction Market – Year-over-Year Growth Analysis, 2021–2035 | |
  17. TABLE 3 Driver Impact Analysis Matrix, 2026–2035 | |
  18. TABLE 4 Restraint Impact Analysis Matrix, 2026–2035 | |
  19. TABLE 5 Global Modular Construction Market Size, by Material, 2021–2035 (USD Billion) | |
  20. TABLE 6 Global Modular Construction Market Size, by Construction Type, 2021–2035 (USD Billion) | |
  21. TABLE 7 Global Modular Construction Market Size, by Service Stage, 2021–2035 (USD Billion) | |
  22. TABLE 8 Global Modular Construction Market Size, by End-User Sector, 2021–2035 (USD Billion) | |
  23. TABLE 9 Global Modular Construction Market Size, by Region, 2021–2035 (USD Billion) | |
  24. TABLE 10 North America Market Size, by Country, 2021–2035 (USD Billion) | |
  25. TABLE 11 Europe Market Size, by Country, 2021–2035 (USD Billion) | |
  26. TABLE 12 Asia-Pacific Market Size, by Country, 2021–2035 (USD Billion) | |
  27. TABLE 13 South America Market Size, by Country, 2021–2035 (USD Billion) | |
  28. TABLE 14 Middle East & Africa Market Size, by Country, 2021–2035 (USD Billion) | |
  29. TABLE 15 North America Market Size, by Material, 2021–2035 (USD Billion) | |
  30. TABLE 16 North America Market Size, by Construction Type, 2021–2035 (USD Billion) | |
  31. TABLE 17 North America Market Size, by End-User Sector, 2021–2035 (USD Billion) | |
  32. TABLE 18 Europe Market Size, by Material, 2021–2035 (USD Billion) | |
  33. TABLE 19 Europe Market Size, by Construction Type, 2021–2035 (USD Billion) | |
  34. TABLE 20 Europe Market Size, by End-User Sector, 2021–2035 (USD Billion) | |
  35. TABLE 21 Asia-Pacific Market Size, by Material, 2021–2035 (USD Billion) | |
  36. TABLE 22 Asia-Pacific Market Size, by Construction Type, 2021–2035 (USD Billion) | |
  37. TABLE 23 Asia-Pacific Market Size, by End-User Sector, 2021–2035 (USD Billion) | |
  38. TABLE 24 South America Market Size, by Material, 2021–2035 (USD Billion) | |
  39. TABLE 25 South America Market Size, by End-User Sector, 2021–2035 (USD Billion) | |
  40. TABLE 26 Middle East & Africa Market Size, by Material, 2021–2035 (USD Billion) | |
  41. TABLE 27 Middle East & Africa Market Size, by End-User Sector, 2021–2035 (USD Billion) | |
  42. TABLE 28 US Market Size, by Segment, 2021–2035 (USD Billion) | |
  43. TABLE 29 China Market Size, by Segment, 2021–2035 (USD Billion) | |
  44. TABLE 30 India Market Size, by Segment, 2021–2035 (USD Billion) | |
  45. TABLE 31 Japan Market Size, by Segment, 2021–2035 (USD Billion) | |
  46. TABLE 32 Germany Market Size, by Segment, 2021–2035 (USD Billion) | |
  47. TABLE 33 UK Market Size, by Segment, 2021–2035 (USD Billion) | |
  48. TABLE 34 Saudi Arabia Market Size, by Segment, 2021–2035 (USD Billion) | |
  49. TABLE 35 Brazil Market Size, by Segment, 2021–2035 (USD Billion) | |
  50. TABLE 36 Competitive Benchmarking Matrix, 2026 | |
  51. TABLE 37 Company Profiles – Key Players | |
  52. TABLE 38 Recent Developments & Strategic Announcements, 2023–2025 | |
  53. TABLE 39 Report Scope & Methodology Summary | |
  54. TABLE 40 Detailed Sources & Citations Index | | LIST OF FIGURES | |
  55. FIGURE 1 Market Dynamics Overview – Drivers, Restraints, Opportunities, Challenges | |
  56. FIGURE 2 Industry Value Chain Analysis | |
  57. FIGURE 3 Porter's Five Forces Assessment | |
  58. FIGURE 4 Global Market Size Trend & Forecast, 2021–2035 (USD Billion) | |
  59. FIGURE 5 Year-over-Year Growth Rate Trend, 2022–2035 (%) | |
  60. FIGURE 6 Market Share by Material, 2025 vs 2035 (%) | |
  61. FIGURE 7 Market Share by Construction Type, 2025 vs 2035 (%) | |
  62. FIGURE 8 Market Share by Service Stage, 2025 vs 2035 (%) | |
  63. FIGURE 9 Market Share by End-User Sector, 2025 vs 2035 (%) | |
  64. FIGURE 10 Regional Revenue Share, 2025 (%) | |
  65. FIGURE 11 Regional CAGR Comparison, 2026–2035 (%) | |
  66. FIGURE 12 North America Country Share Breakdown, 2025 (%) | |
  67. FIGURE 13 Europe Country Share Breakdown, 2025 (%) | |
  68. FIGURE 14 Asia-Pacific Country Share Breakdown, 2025 (%) | |
  69. FIGURE 15 South America and Middle East & Africa Country Share Breakdown, 2025 (%) | |
  70. FIGURE 16 Competitive Positioning Matrix – Scale vs Vertical Integration | |
  71. FIGURE 17 Top Player Revenue Share Ranges, 2026 (%) | |
  72. FIGURE 18 Driver Impact Contribution to Headline CAGR (Directional) | |
  73. FIGURE 19 Factory Capacity Additions by Region, 2021–2035 | |
  74. FIGURE 20 Embodied Carbon Intensity Benchmark – Factory vs Site-Built Delivery

Segmentation Quick Reference

DimensionSub-SegmentsDominant SegmentFastest Growing Segment
By MaterialSteel; Concrete; Wood / Mass Timber; Others (Composites, Plastics)SteelWood / Mass Timber
By Construction TypePermanent Modular; Relocatable ModularPermanent ModularRelocatable Modular
By Service StageNew Construction; After-Sales Maintenance & RefurbishmentNew ConstructionAfter-Sales Maintenance & Refurbishment
By End-User SectorIndustrial / Institutional; Residential; CommercialIndustrial / InstitutionalResidential
By GeographyNorth America; Europe; Asia-Pacific; South America; Middle East & AfricaAsia-PacificAsia-Pacific


Market Segmentation Overview

By Material

Sub-SegmentKey Trend
SteelAutomated welding cells and quick-connect systems raise plant throughput while cutting field labour
ConcretePreferred for podium levels, acoustic separation, and two-hour fire-rated institutional work
Wood / Mass TimberCarbon-weighted tenders in Nordic and DACH markets create scoring advantages over cost premiums
Others (Composites, Plastics)Niche adoption in sanitary pods, cleanrooms, and corrosion-exposed industrial enclosures


Material selection increasingly follows regulatory scoring rather than delivered cost. Steel retains overwhelming share because it alone supports high-rise stacking at volume tolerances, but timber's growth rate is the highest of any material as whole-life carbon disclosure spreads across European procurement.

By Construction Type

Sub-SegmentKey Trend
Permanent ModularData centres, hospitals, and schools drive large-ticket contracts with schedule guarantees
Relocatable ModularLeasing fleets recover asset cost across three to five deployments, favouring operating-expense budgets


Permanent work supplies the majority of revenue while relocatable assets compound faster. The two arenas demand different capabilities: one rewards engineering depth and lifecycle commitments, the other rewards branch density and 72-hour response times.

By Service Stage

Sub-SegmentKey Trend
New ConstructionPublic housing quotas and greenfield capacity additions anchor baseline volume
After-Sales Maintenance & RefurbishmentFleet refurbishment cycles and rooftop extension programmes build recurring revenue


Aftermarket revenue is the structural story of the next decade. As the installed base ages, refurbishment and service contracts convert lumpy project income into predictable annuity streams, a shift Japanese housebuilders proved viable decades ago.

By End-User Sector

Sub-SegmentKey Trend
Industrial / InstitutionalHyperscale data halls, laboratories, and school programmes procure at repeatable programme scale
ResidentialState housing deficits across Asia-Pacific and emerging markets drive the fastest sector growth
CommercialHotel key modules and retail rollouts sustain demand through moderate development cycles


Institutional buyers dominate current spending because they value schedule certainty above unit price and procure standardised building types repeatedly. Residential expansion depends far more on state financing continuity than on private affordability improvement.




Download PDF ×

We do not share your information with anyone. However, we may send you emails based on your report interest from time to time. You may contact us at any time to opt-out.