Mobile Cobots Market Research Reportβ€”Global Forecast till 2032

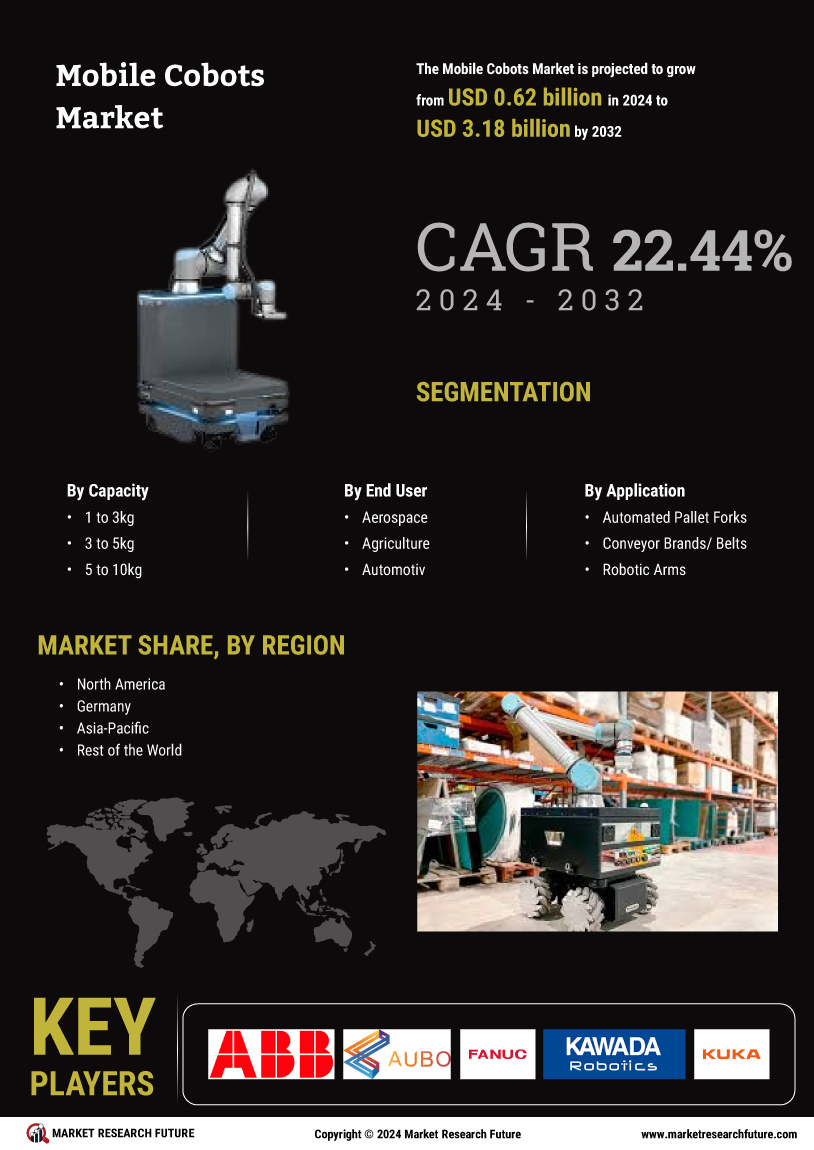
Mobile Cobots Market Research Report Information By Weight capacity (1 to 3kg, 3 to 5kg, 5 to 10kg, Above 10kg), By Application (Automated Pallet Forks, Conveyor Brands/ Belts, Robotic Arms, Safety Units, Shelf Units), By End User (Aerospace, Agriculture, Automotive, Construction, Electronics & Semiconductor, Food & Beverage, Healthcare, Retail & Logistics), And By Region (North America, Europe, Asia-Pacific, And Rest Of The World) –Market Forecast Till 2032.

ID: MRFR/ICT/9322-CR | 165 Pages | Author: Ankit Gupta | April 2022         

GLOBAL MOBILE COBOTS MARKET RESEARCH REPORT

FORECAST TO 2027

TABLE OF CONTENTS

1 EXECUTIVE SUMMARY.. 21

1.1 MARKET SUMMARY. 21

1.2 MARKET ATTRACTIVENESS ANALYSIS. 22

2 Market Introduction.. 23

2.1 Definition.. 23

2.2 Scope of the Study. 23

2.3 Research Objective. 23

2.4 Market Structure. 24

3 Research Methodology. 25

4 Market Dynamics.. 32

4.1 Introduction.. 32

4.2 Drivers. 33

4.2.1 Increasing investment in automation by various industries. 33

4.2.2 Improving Human-Machine Interface. 33

4.2.3 Increasing demand for mobile cobots from THE automotive industry and agricultural applications 34

4.3 Restraint. 35

4.3.1 Safety issues associated with mobile cobot. 35

4.3.2 High initial cost and technical complexity. 35

4.4 Opportunity. 36

4.4.1 Industry 5.0 is expected to open lucrative opportunities for the market. 36

4.5 Covid-19 Impact Analysis. 37

4.5.1 Impact on Semiconductor Component manufacturers. 37

4.5.2 Impact on the global mobile cobots Market. 37

4.5.2.1 Impact on Supply Chain.. 37

4.5.2.2 Price Variation of Key Raw Materials. 38

4.5.2.3 Production Shutdown.. 38

4.5.2.4 Impact on Market Demand. 38

5 MARKET FACTOR ANALYSIS.. 39

5.1 VALUE CHAIN ANALYSIS. 39

5.1.1 HARDWARE/COMPONENT MANUFACTURERS. 39

5.1.2 SOFTWARE DEVELOPERS. 39

5.1.3 SYSTEM INTEGRATORS. 39

5.1.4 END-USERS. 40

5.2 PORTER'S FIVE FORCES MODEL. 40

5.2.1 THREAT OF NEW ENTRANTS. 41

5.2.2 BARGAINING POWER OF SUPPLIERS. 41

5.2.3 THREAT OF SUBSTITUTES. 41

5.2.4 BARGAINING POWER OF BUYERS. 41

5.2.5 INTENSITY OF RIVALRY. 41

6 GLOBAL MOBILE COBOTS MARKET, By weight capacity.. 42

6.1 OVERVIEW.. 42

6.1.1 Global MOBILE COBOTS market, By weight capacity, 2018–2027 (USD million) 43

6.2 1 to 3 Kg.. 43

6.3 3 to 5 kg.. 43

6.4 5 to 10 kg.. 43

6.5 Above 10 kg.. 43

7 GLOBAL MOBILE COBOTS MARKET, BY APPLICATION.. 44

7.1 OVERVIEW.. 44

7.1.1 Global MOBILE COBOTS market, BY APPLICATION, 2018–2027 (USD million) 44

7.2 Automated Pallet Forks. 45

7.3 Conveyor bands/belts. 45

7.4 Robotic arms. 45

7.5 Safety units. 45

7.6 Shelf units. 45

8 GLOBAL MOBILE COBOTS MARKET, BY Vertical. 46

8.1 OVERVIEW.. 46

8.1.1 Global MOBILE COBOTS market, BY Vertical, 2018–2027 (USD million) 47

8.2 Aerospace. 47

8.3 Agriculture. 47

8.4 Automotive. 47

8.5 Construction.. 48

8.6 Electronics & Semiconductor. 48

8.7 Food & Beverages. 48

8.8 Healthcare. 48

8.9 Retail & Logistics. 48

9 Global Mobile cobots MARKET, BY Region.. 49

9.1 OVERVIEW.. 49

9.1.1 Global MOBILE COBOTS market, by Region, 2020 VS 2027 (USD MILLION) 49

9.1.2 Global MOBILE COBOTS market, BY Region, 2018–2027 (USD million) 50

9.2 ASIA-PACIFIC. 50

9.2.1 ASIA-PACIFIC: MOBILE COBOT market, BY Country, 2018–2027 (USD MILLION) 51

9.2.2 Asia-Pacific MOBILE COBOT market, BY Weight Capacity, 2018–2027 (USD million) 52

9.2.3 Asia-Pacific MOBILE COBOT market, BY APPLICATION, 2018–2027 (USD million) 53

9.2.4 Asia-Pacific MOBILE COBOT market, BY Vertical, 2018–2027 (USD million) 54

9.2.5 China. 55

9.2.5.1 China MOBILE COBOT market, BY Weight Capacity, 2018–2027 (USD million) 55

9.2.5.2 China MOBILE COBOT market, BY APPLICATION, 2018–2027 (USD million) 55

9.2.5.3 China MOBILE COBOT market, BY Vertical, 2018–2027 (USD million) 56

9.2.6 Japan.. 56

9.2.6.1 Japan MOBILE COBOT market, BY Weight Capacity, 2018–2027 (USD million) 56

9.2.6.2 Japan MOBILE COBOT market, BY APPLICATION, 2018–2027 (USD million) 57

9.2.6.3 Japan MOBILE COBOT market, BY Vertical, 2018–2027 (USD million) 57

9.2.7 South Korea. 58

9.2.7.1 South Korea MOBILE COBOT market, BY Weight Capacity, 2018–2027 (USD million) 58

9.2.7.2 South Korea MOBILE COBOT market, BY APPLICATION, 2018–2027 (USD million) 58

9.2.7.3 South Korea MOBILE COBOT market, BY Vertical, 2018–2027 (USD million) 59

9.2.8 India. 59

9.2.8.1 India MOBILE COBOT market, BY Weight Capacity, 2018–2027 (USD million) 59

9.2.8.2 India MOBILE COBOT market, BY APPLICATION, 2018–2027 (USD million) 60

9.2.8.3 India MOBILE COBOT market, BY Vertical, 2018–2027 (USD million) 60

9.2.9 Indonesia. 61

9.2.9.1 Indonesia MOBILE COBOT market, BY Weight Capacity, 2018–2027 (USD million) 61

9.2.9.2 Indonesia MOBILE COBOT market, BY APPLICATION, 2018–2027 (USD million) 61

9.2.9.3 Indonesia MOBILE COBOT market, BY Vertical, 2018–2027 (USD million) 62

9.2.10 Taiwan.. 62

9.2.10.1 Taiwan MOBILE COBOT market, BY Weight Capacity, 2018–2027 (USD million) 62

9.2.10.2 Taiwan MOBILE COBOT market, BY APPLICATION, 2018–2027 (USD million) 63

9.2.10.3 Taiwan MOBILE COBOT market, BY Vertical, 2018–2027 (USD million) 63

9.2.11 Australia. 64

9.2.11.1 Australia MOBILE COBOT market, BY Weight Capacity, 2018–2027 (USD million) 64

9.2.11.2 Australia MOBILE COBOT market, BY APPLICATION, 2018–2027 (USD million) 64

9.2.11.3 Australia MOBILE COBOT market, BY Vertical, 2018–2027 (USD million) 65

9.2.12 Thailand. 65

9.2.12.1 Thailand MOBILE COBOT market, BY Weight Capacity, 2018–2027 (USD million) 65

9.2.12.2 Thailand MOBILE COBOT market, BY APPLICATION, 2018–2027 (USD million) 66

9.2.12.3 Thailand MOBILE COBOT market, BY Vertical, 2018–2027 (USD million) 66

9.2.13 Phillipines. 67

9.2.13.1 Phillipines MOBILE COBOT market, BY Weight Capacity, 2018–2027 (USD million) 67

9.2.13.2 Phillipines MOBILE COBOT market, BY APPLICATION, 2018–2027 (USD million) 67

9.2.13.3 Phillipines MOBILE COBOT market, BY Vertical, 2018–2027 (USD million) 68

9.2.14 Singapore. 68

9.2.14.1 Singapore MOBILE COBOT market, BY Weight Capacity, 2018–2027 (USD million) 68

9.2.14.2 Singapore MOBILE COBOT market, BY APPLICATION, 2018–2027 (USD million) 69

9.2.14.3 Singapore MOBILE COBOT market, BY Vertical, 2018–2027 (USD million) 69

9.2.15 Malaysia. 70

9.2.15.1 Malaysia MOBILE COBOT market, BY Weight Capacity, 2018–2027 (USD million) 70

9.2.15.2 Malaysia MOBILE COBOT market, BY APPLICATION, 2018–2027 (USD million) 70

9.2.15.3 Malaysia MOBILE COBOT market, BY Vertical, 2018–2027 (USD million) 71

9.2.16 REST OF ASIA-PACIFIC. 71

9.2.16.1 REST OF ASIA-PACIFIC MOBILE COBOT market, BY Weight Capacity, 2018–2027 (USD million) 71

9.2.16.2 REST OF ASIA-PACIFIC MOBILE COBOT market, BY APPLICATION, 2018–2027 (USD million) 72

9.2.16.3 REST OF ASIA-PACIFIC MOBILE COBOT market, BY Vertical, 2018–2027 (USD million) 72

9.3 EUROPE. 73

9.3.1 EUROPE: MOBILE COBOTS market, BY Country, 2018–2027 (USD MILLION) 74

9.3.2 Europe MOBILE COBOTS market, BY Weight capacity, 2018–2027 (USD million) 75

9.3.3 Europe MOBILE COBOTS market, BY APPLICATION, 2018–2027 (USD million) 76

9.3.4 Europe MOBILE COBOTS market, BY Vertical, 2018–2027 (USD million) 77

9.3.5 UK. 78

9.3.5.1 UK MOBILE COBOT market, BY Weight capacity, 2018–2027 (USD million) 78

9.3.5.2 UK MOBILE COBOT market, BY Application, 2018–2027 (USD million) 78

9.3.5.3 UK MOBILE COBOT market, BY Vertical, 2018–2027 (USD million) 79

9.3.6 Germany. 79

9.3.6.1 Germany MOBILE COBOT market, BY Weight Capacity, 2018–2027 (USD million) 79

9.3.6.2 Germany MOBILE COBOT market, BY Application, 2018–2027 (USD million) 80

9.3.6.3 Germany MOBILE COBOT market, BY vertical, 2018–2027 (USD million) 80

9.3.7 France. 81

9.3.7.1 France MOBILE COBOT market, BY weight capacity, 2018–2027 (USD million) 81

9.3.7.2 Germany MOBILE COBOT market, BY vertical, 2018–2027 (USD million) 81

9.3.7.3 Germany MOBILE COBOT market, BY vertical, 2018–2027 (USD million) 82

9.3.8 Spain.. 82

9.3.8.1 Spain MOBILE COBOT market, BY Weight capacity, 2018–2027 (USD million) 82

9.3.8.2 Spain MOBILE COBOT market, BY APPLICATION, 2018–2027 (USD million) 83

9.3.8.3 Spain MOBILE COBOT market, BY vertical, 2018–2027 (USD million) 83

9.3.9 RUSSIA. 84

9.3.9.1 Russia MOBILE COBOT market, BY Weight capacity, 2018–2027 (USD million) 84

9.3.9.2 Russia MOBILE COBOT market, BY APPLICATION, 2018–2027 (USD million) 84

9.3.9.3 Russia MOBILE COBOT market, BY vertical, 2018–2027 (USD million) 85

9.3.10 Italy. 85

9.3.10.1 Italy MOBILE COBOT market, BY Weight capacity, 2018–2027 (USD million) 85

9.3.10.2 Italy MOBILE COBOT market, BY APPLICATION, 2018–2027 (USD million) 86

9.3.10.3 Italy MOBILE COBOT market, BY vertical, 2018–2027 (USD million) 86

9.3.11 Netherlands. 87

9.3.11.1 Netherlands MOBILE COBOT market, BY Weight capacity, 2018–2027 (USD million) 87

9.3.11.2 Netherlands MOBILE COBOT market, BY APPLICATION, 2018–2027 (USD million) 87

9.3.11.3 Netherlands MOBILE COBOT market, BY vertical, 2018–2027 (USD million) 88

9.3.12 SWITZERLAND. 88

9.3.12.1 Switzerland MOBILE COBOT market, BY Weight capacity, 2018–2027 (USD million) 88

9.3.12.2 Switzerland MOBILE COBOT market, BY APPLICATION, 2018–2027 (USD million) 89

9.3.12.3 Switzerland MOBILE COBOT market, BY vertical, 2018–2027 (USD million) 89

9.3.13 Rest of Europe. 90

9.3.13.1 Rest of europe MOBILE COBOT market, BY Weight capacity, 2018–2027 (USD million) 90

9.3.13.2 Rest of europe MOBILE COBOT market, BY APPLICATION, 2018–2027 (USD million) 90

9.3.13.3 Rest of europe MOBILE COBOT market, BY vertical, 2018–2027 (USD million) 91

9.4 North america. 91

9.4.1 North america: MOBILE COBOTS market, BY Country, 2018–2027 (USD MILLION) 92

9.4.2 North America MOBILE COBOTS market, By weight capacity, 2018–2027 (USD million) 93

9.4.3 North America MOBILE COBOTS market, BY APPLICATION, 2018–2027 (USD million) 94

9.4.4 North America MOBILE COBOTS market, BY Vertical, 2018–2027 (USD million) 95

9.4.5 US. 96

9.4.5.1 US MOBILE COBOTS market, By weight capacity, 2018–2027 (USD million) 96

9.4.5.2 US MOBILE COBOTS market, BY APPLICATION, 2018–2027 (USD million) 96

9.4.5.3 US MOBILE COBOTS market, BY Vertical, 2018–2027 (USD million) 97

9.4.6 Canada. 97

9.4.6.1 Canada MOBILE COBOTS market, By weight capacity, 2018–2027 (USD million) 97

9.4.6.2 Canada MOBILE COBOTS market, BY APPLICATION, 2018–2027 (USD million) 98

9.4.6.3 Canada MOBILE COBOTS market, BY Vertical, 2018–2027 (USD million) 98

9.4.7 Mexico.. 99

9.4.7.1 Mexico MOBILE COBOTS market, By weight capacity, 2018–2027 (USD million) 99

9.4.7.2 Mexico MOBILE COBOTS market, BY APPLICATION, 2018–2027 (USD million) 99

9.4.7.3 Mexico MOBILE COBOTS market, BY Vertical, 2018–2027 (USD million) 100

9.5 MIDDLE EAST & AFRICA. 101

9.5.1 MIDDLE EAST & AFRICA: MOBILE COBOTS market, BY Country, 2018–2027 (USD MILLION) 102

9.5.2 MIDDLE EAST & AFRICA MOBILE COBOTS market, BY Weight capacity, 2018–2027 (USD million) 103

9.5.3 MIDDLE EAST & AFRICA MOBILE COBOTS market, BY APPLICATION, 2018–2027 (USD million) 104

9.5.4 MIDDLE EAST & AFRICA MOBILE COBOTS market, BY Vertical, 2018–2027 (USD million) 105

9.5.5 Saudi Arabia. 106

9.5.5.1 Saudi Arabia MOBILE COBOT market, BY Weight capacity, 2018–2027 (USD million) 106

9.5.5.2 Saudi Arabia MOBILE COBOT market, BY APPLICATION, 2018–2027 (USD million) 106

9.5.5.3 Saudi Arabia MOBILE COBOT market, BY vertical, 2018–2027 (USD million) 107

9.5.6 Rest of Middle East & Africa. 107

9.5.6.1 Rest of middle east & africa MOBILE COBOT market, BY Weight capacity, 2018–2027 (USD million) 107

9.5.6.2 Rest of middle east & africa MOBILE COBOT market, BY APPLICATION, 2018–2027 (USD million) 108

9.5.6.3 Rest of middle east & africa MOBILE COBOT market, BY vertical, 2018–2027 (USD million) 108

9.5.7 South Africa. 109

9.5.7.1 South Africa MOBILE COBOT market, BY Weight capacity, 2018–2027 (USD million) 109

9.5.7.2 South Africa MOBILE COBOT market, BY APPLICATION, 2018–2027 (USD million) 109

9.5.7.3 South Africa MOBILE COBOT market, BY vertical, 2018–2027 (USD million) 110

9.5.8 UAE. 110

9.5.8.1 UAE MOBILE COBOT market, BY Weight capacity, 2018–2027 (USD million) 110

9.5.8.2 UAE MOBILE COBOT market, BY APPLICATION, 2018–2027 (USD million) 111

9.5.8.3 UAE MOBILE COBOT market, BY vertical, 2018–2027 (USD million) 111

9.5.9 Egypt. 112

9.5.9.1 EGYPT MOBILE COBOT market, BY Weight capacity, 2018–2027 (USD million) 112

9.5.9.2 EGYPT MOBILE COBOT market, BY APPLICATION, 2018–2027 (USD million) 112

9.5.9.3 EGYPT MOBILE COBOT market, BY vertical, 2018–2027 (USD million) 113

9.5.10 Qatar. 113

9.5.10.1 QATAR MOBILE COBOT market, BY Weight capacity, 2018–2027 (USD million) 113

9.5.10.2 QATAR MOBILE COBOT market, BY APPLICATION, 2018–2027 (USD million) 114

9.5.10.3 QATAR MOBILE COBOT market, BY vertical, 2018–2027 (USD million) 114

9.6 SOUTH AMERICA. 115

9.6.1 SOUTH AMERICA: MOBILE COBOT market, BY Country, 2018–2027 (USD MILLION) 116

9.6.2 South America MOBILE COBOT market, BY Weight Capacity, 2018–2027 (USD million) 117

9.6.3 South America MOBILE COBOT market, BY APPLICATION, 2018–2027 (USD million) 118

9.6.4 South America MOBILE COBOT market, BY Vertical, 2018–2027 (USD million) 119

9.6.5 Brazil. 120

9.6.5.1 Brazil MOBILE COBOT market, BY Weight Capacity, 2018–2027 (USD million) 120

9.6.5.2 Brazil MOBILE COBOT market, BY APPLICATION, 2018–2027 (USD million) 120

9.6.5.3 Brazil MOBILE COBOT market, BY Vertical, 2018–2027 (USD million) 121

9.6.6 Argentina. 121

9.6.6.1 Argentina MOBILE COBOT market, BY Weight Capacity, 2018–2027 (USD million) 121

9.6.6.2 Argentina MOBILE COBOT market, BY APPLICATION, 2018–2027 (USD million) 122

9.6.6.3 Argentina MOBILE COBOT market, BY Vertical, 2018–2027 (USD million) 122

9.6.7 Colombia. 123

9.6.7.1 Colombia MOBILE COBOT market, BY Weight Capacity, 2018–2027 (USD million) 123

9.6.7.2 Colombia MOBILE COBOT market, BY APPLICATION, 2018–2027 (USD million) 123

9.6.7.3 Colombia MOBILE COBOT market, BY Vertical, 2018–2027 (USD million) 124

9.6.8 Chile. 124

9.6.8.1 Chile MOBILE COBOT market, BY Weight Capacity, 2018–2027 (USD million) 124

9.6.8.2 Chile MOBILE COBOT market, BY APPLICATION, 2018–2027 (USD million) 125

9.6.8.3 Chile MOBILE COBOT market, BY Vertical, 2018–2027 (USD million) 125

9.6.9 Rest of South America. 126

9.6.9.1 Rest of South America MOBILE COBOT market, BY Weight Capacity, 2018–2027 (USD million) 126

9.6.9.2 Rest of South America MOBILE COBOT market, BY APPLICATION, 2018–2027 (USD million) 126

9.6.9.3 Rest of South America MOBILE COBOT market, BY Vertical, 2018–2027 (USD million) 127

10 COMPETITIVE LANDSCAPE. 128

10.1 introduction.. 128

10.2 Competitive benchmarking.. 129

10.3 Vendor share analysis. 130

10.4 recent developments. 130

10.4.1 Partnerships/Agreements/contracts/Collaborations. 130

10.4.2 Business Expansions/Acquistions. 131

10.4.3 Product Launches/developments. 131

11 company profiles.. 133

11.1 Abb Limited. 133

11.1.1 COMPANY OVERVIEW.. 133

11.1.2 FINANCIAL OVERVIEW.. 134

11.1.3 PRODUCTS/SOLUTIONS/SERVICES OFFERED. 134

11.1.4 KEY DEVELOPMENTS. 135

11.1.5 SWOT ANALYSIS. 135

11.1.6 KEY STRATEGIES. 135

11.2 AUBO Robotics, Inc. 136

11.2.1 COMPANY OVERVIEW.. 136

11.2.2 FINANCIAL OVERVIEW.. 136

11.2.3 PRODUCTS/SOLUTIONS/SERVICES OFFERED. 136

11.2.4 KEY DEVELOPMENTS. 136

11.3 FANUC CORPORATION.. 137

11.3.1 COMPANY OVERVIEW.. 137

11.3.2 FINANCIAL OVERVIEW.. 138

11.3.3 PRODUCTS/SOLUTIONS/SERVICES OFFERED. 138

11.3.4 KEY DEVELOPMENTS. 139

11.3.5 SWOT ANALYSIS. 139

11.3.6 KEY STRATEGIES. 139

11.4 Kawada Robotics. 140

11.4.1 COMPANY OVERVIEW.. 140

11.4.2 FINANCIAL OVERVIEW.. 140

11.4.3 PRODUCTS/SOLUTIONS/SERVICES OFFERED. 140

11.4.4 KEY DEVELOPMENTS. 140

11.5 KUKA AG.. 141

11.5.1 COMPANY OVERVIEW.. 141

11.5.2 FINANCIAL OVERVIEW.. 142

11.5.3 PRODUCTS OFFERed. 142

11.5.4 Key Development. 143

11.5.5 SWOT ANALYSIS. 143

11.5.6 Key Strategies. 143

11.6 MRK-Systeme GmbH.. 144

11.6.1 COMPANY OVERVIEW.. 144

11.6.2 FINANCIAL OVERVIEW.. 144

11.6.3 PRODUCTS/SOLUTIONS/SERVICES OFFERED. 144

11.6.4 KEY DEVELOPMENTS. 144

11.7 Precise Automation.. 145

11.7.1 COMPANY OVERVIEW.. 145

11.7.2 FINANCIAL OVERVIEW.. 145

11.7.3 PRODUCTS/SOLUTIONS/SERVICES OFFERED. 145

11.7.4 KEY DEVELOPMENTS. 145

11.8 Techman Robot Inc. 146

11.8.1 COMPANY OVERVIEW.. 146

11.8.2 FINANCIAL OVERVIEW.. 146

11.8.3 PRODUCTS/SOLUTIONS/SERVICES OFFERED. 146

11.8.4 KEY DEVELOPMENTS. 146

11.9 YASKAWA ELECTRIC CORPORATION.. 147

11.9.1 COMPANY OVERVIEW.. 147

11.9.2 FINANCIAL OVERVIEW.. 148

11.9.3 PRODUCTS OFFERed. 148

11.9.4 Key Development. 149

11.9.5 SWOT ANALYSIS. 149

11.9.6 Key Strategies. 149

11.10 AgileX Robotics(Shenzhen) Ltd. 150

11.10.1 COMPANY OVERVIEW.. 150

11.10.2 FINANCIAL OVERVIEW.. 150

11.10.3 PRODUCTS OFFERed. 150

11.10.4 Key Development. 150

11.10.5 SWOT ANALYSIS. 151

11.10.6 Key Strategies. 151

11.11 ROBERT BOSCH GMBH.. 152

11.11.1 COMPANY OVERVIEW.. 152

11.11.2 FINANCIAL OVERVIEW.. 153

11.11.3 PRODUCTS/SOLUTIONS/SERVICES OFFERed. 153

11.11.4 KEY DEVELOPMENTS. 153

11.11.5 SWOT ANALYSIS. 154

11.11.6 KEY STRATEGIES. 154

11.12 PBA Group. 155

11.12.1 COMPANY OVERVIEW.. 155

11.12.2 FINANCIAL OVERVIEW.. 155

11.12.3 PRODUCTS OFFERed. 155

11.12.4 Key Development. 155

11.13 StAubli International AG.. 156

11.13.1 COMPANY OVERVIEW.. 156

11.13.2 FINANCIAL OVERVIEW.. 156

11.13.3 PRODUCTS OFFERed. 156

11.13.4 Key Development. 156

11.14 Waypoint Robotics. 157

11.14.1 COMPANY OVERVIEW.. 157

11.14.2 FINANCIAL OVERVIEW.. 157

11.14.3 PRODUCTS OFFERed. 157

11.14.4 Key Development. 158

11.15 ROBOTNIK. 159

11.15.1 COMPANY OVERVIEW.. 159

11.15.2 FINANCIAL OVERVIEW.. 159

11.15.3 PRODUCTS OFFERed. 159

11.15.4 Key Development. 159

LIST OF TABLES

TABLE 1 Market synopsis 22

TABLE 2 Global MOBILE COBOTS market, By weight capacity, 2018–2027 (USD million) 43

TABLE 3 Global MOBILE COBOTS market, BY APPLICATION, 2018–2027 (USD million) 44

TABLE 4 Global MOBILE COBOTS market, BY Vertical, 2018–2027 (USD million) 47

TABLE 5 Global MOBILE COBOTS market, by Region, 2018–2027 (USD MILLION) 50

TABLE 6 ASIA-PACIFIC MOBILE COBOT market, BY country, 2018–2027 (USD million) 51

TABLE 7 Asia-Pacific MOBILE COBOT market, BY Weight Capacity, 2018–2027 (USD million) 52

TABLE 8 Asia-Pacific MOBILE COBOT market, BY APPLICATION, 2018–2027 (USD million) 53

TABLE 9 Asia-Pacific MOBILE COBOT market, BY Vertical, 2018–2027 (USD million) 54

TABLE 10 China MOBILE COBOT market, BY Weight Capacity, 2018–2027 (USD million) 55

TABLE 11 China MOBILE COBOT market, BY APPLICATION, 2018–2027 (USD million) 55

TABLE 12 China MOBILE COBOT market, BY Vertical, 2018–2027 (USD million) 56

TABLE 13 Japan MOBILE COBOT market, BY Weight Capacity, 2018–2027 (USD million) 56

TABLE 14 Japan MOBILE COBOT market, BY APPLICATION, 2018–2027 (USD million) 57

TABLE 15 Japan MOBILE COBOT market, BY Vertical, 2018–2027 (USD million) 57

TABLE 16 South Korea MOBILE COBOT market, BY Weight Capacity, 2018–2027 (USD million) 58

TABLE 17 South Korea MOBILE COBOT market, BY APPLICATION, 2018–2027 (USD million) 58

TABLE 18 South Korea MOBILE COBOT market, BY Vertical, 2018–2027 (USD million) 59

TABLE 19 India MOBILE COBOT market, BY Weight Capacity, 2018–2027 (USD million) 59

TABLE 20 India MOBILE COBOT market, BY APPLICATION, 2018–2027 (USD million) 60

TABLE 21 India MOBILE COBOT market, BY Vertical, 2018–2027 (USD million) 60

TABLE 22 Indonesia MOBILE COBOT market, BY Weight Capacity, 2018–2027 (USD million) 61

TABLE 23 Indonesia MOBILE COBOT market, BY APPLICATION, 2018–2027 (USD million) 61

TABLE 24 Indonesia MOBILE COBOT market, BY Vertical, 2018–2027 (USD million) 62

TABLE 25 Taiwan MOBILE COBOT market, BY Weight Capacity, 2018–2027 (USD million) 62

TABLE 26 Taiwan MOBILE COBOT market, BY APPLICATION, 2018–2027 (USD million) 63

TABLE 27 Taiwan MOBILE COBOT market, BY Vertical, 2018–2027 (USD million) 63

TABLE 28 Australia MOBILE COBOT market, BY Weight Capacity, 2018–2027 (USD million) 64

TABLE 29 Australia MOBILE COBOT market, BY APPLICATION, 2018–2027 (USD million) 64

TABLE 30 Australia MOBILE COBOT market, BY Vertical, 2018–2027 (USD million) 65

TABLE 31 Thailand MOBILE COBOT market, BY Weight Capacity, 2018–2027 (USD million) 65

TABLE 32 Thailand MOBILE COBOT market, BY APPLICATION, 2018–2027 (USD million) 66

TABLE 33 Thailand MOBILE COBOT market, BY Vertical, 2018–2027 (USD million) 66

TABLE 34 Phillipines MOBILE COBOT market, BY Weight Capacity, 2018–2027 (USD million) 67

TABLE 35 Phillipines MOBILE COBOT market, BY APPLICATION, 2018–2027 (USD million) 67

TABLE 36 Phillipines MOBILE COBOT market, BY Vertical, 2018–2027 (USD million) 68

TABLE 37 Singapore MOBILE COBOT market, BY Weight Capacity, 2018–2027 (USD million) 68

TABLE 38 Singapore MOBILE COBOT market, BY APPLICATION, 2018–2027 (USD million) 69

TABLE 39 Singapore MOBILE COBOT market, BY Vertical, 2018–2027 (USD million) 69

TABLE 40 Malaysia MOBILE COBOT market, BY Weight Capacity, 2018–2027 (USD million) 70

TABLE 41 Malaysia MOBILE COBOT market, BY APPLICATION, 2018–2027 (USD million) 70

TABLE 42 Malaysia MOBILE COBOT market, BY Vertical, 2018–2027 (USD million) 71

TABLE 43 REST OF ASIA-PACIFIC MOBILE COBOT market, BY Weight Capacity, 2018–2027 (USD million) 71

TABLE 44 REST OF ASIA-PACIFIC MOBILE COBOT market, BY APPLICATION, 2018–2027 (USD million) 72

TABLE 45 REST OF ASIA-PACIFIC MOBILE COBOT market, BY Vertical, 2018–2027 (USD million) 72

TABLE 46 EUROPE MOBILE COBOTS market, BY country, 2018–2027 (USD million) 74

TABLE 47 Europe MOBILE COBOTS market, BY Weight capacity, 2018–2027 (USD million) 75

TABLE 48 Europe MOBILE COBOTS market, BY APPLICATION, 2018–2027 (USD million) 76

TABLE 49 Europe MOBILE COBOTS market, BY Vertical, 2018–2027 (USD million) 77

TABLE 50 UK MOBILE COBOTS market, BY Weight capacity, 2018–2027 (USD million) 78

TABLE 51 UK MOBILE COBOTS market, BY APPLICATION, 2018–2027 (USD million) 78

TABLE 52 UK MOBILE COBOTS market, BY Vertical, 2018–2027 (USD million) 79

TABLE 53 GERMANY MOBILE COBOTS market, BY Weight capacity, 2018–2027 (USD million) 79

TABLE 54 GERMANY MOBILE COBOTS market, BY APPLICATION, 2018–2027 (USD million) 80

TABLE 55 GERMANY MOBILE COBOTS market, BY Vertical, 2018–2027 (USD million) 80

TABLE 56 FRANCE MOBILE COBOTS market, BY Weight capacity, 2018–2027 (USD million) 81

TABLE 57 FRANCE MOBILE COBOTS market, BY APPLICATION, 2018–2027 (USD million) 81

TABLE 58 FRANCE MOBILE COBOTS market, BY Vertical, 2018–2027 (USD million) 82

TABLE 59 SPAIN MOBILE COBOTS market, BY Weight capacity, 2018–2027 (USD million) 82

TABLE 60 SPAIN MOBILE COBOTS market, BY APPLICATION, 2018–2027 (USD million) 83

TABLE 61 SPAIN MOBILE COBOTS market, BY Vertical, 2018–2027 (USD million) 83

TABLE 62 RUSSIA MOBILE COBOTS market, BY Weight capacity, 2018–2027 (USD million) 84

TABLE 63 RUSSIA MOBILE COBOTS market, BY APPLICATION, 2018–2027 (USD million) 84

TABLE 64 RUSSIA MOBILE COBOTS market, BY Vertical, 2018–2027 (USD million) 85

TABLE 65 ITALY MOBILE COBOTS market, BY Weight capacity, 2018–2027 (USD million) 85

TABLE 66 ITALY MOBILE COBOTS market, BY APPLICATION, 2018–2027 (USD million) 86

TABLE 67 ITALY MOBILE COBOTS market, BY Vertical, 2018–2027 (USD million) 86

TABLE 68 NETHERLANDS MOBILE COBOTS market, BY Weight capacity, 2018–2027 (USD million) 87

TABLE 69 NETHERLANDS MOBILE COBOTS market, BY APPLICATION, 2018–2027 (USD million) 87

TABLE 70 NETHERLANDS MOBILE COBOTS market, BY Vertical, 2018–2027 (USD million) 88

TABLE 71 SWITZERLAND MOBILE COBOTS market, BY Weight capacity, 2018–2027 (USD million) 88

TABLE 72 SWITZERLAND MOBILE COBOTS market, BY APPLICATION, 2018–2027 (USD million) 89

TABLE 73 SWITZERLAND MOBILE COBOTS market, BY Vertical, 2018–2027 (USD million) 89

TABLE 74 REST OF EUROPE MOBILE COBOTS market, BY Weight capacity, 2018–2027 (USD million) 90

TABLE 75 REST OF EUROPE MOBILE COBOTS market, BY APPLICATION, 2018–2027 (USD million) 90

TABLE 76 REST OF EUROPE MOBILE COBOTS market, BY Vertical, 2018–2027 (USD million) 91

TABLE 77 North america MOBILE COBOTS market, BY country, 2018–2027 (USD million) 92

TABLE 78 North America MOBILE COBOTS market, By weight capacity, 2018–2027 (USD million) 93

TABLE 79 North America MOBILE COBOTS market, BY APPLICATION, 2018–2027 (USD million) 94

TABLE 80 North America MOBILE COBOTS market, BY Vertical, 2018–2027 (USD million) 95

TABLE 81 US MOBILE COBOTS market, By weight capacity, 2018–2027 (USD million) 96

TABLE 82 US MOBILE COBOTS market, BY APPLICATION, 2018–2027 (USD million) 96

TABLE 83 US MOBILE COBOTS market, BY Vertical, 2018–2027 (USD million) 97

TABLE 84 Canada MOBILE COBOTS market, By weight capacity, 2018–2027 (USD million) 97

TABLE 85 Canada MOBILE COBOTS market, BY APPLICATION, 2018–2027 (USD million) 98

TABLE 86 Canada MOBILE COBOTS market, BY Vertical, 2018–2027 (USD million) 98

TABLE 87 Mexico MOBILE COBOTS market, By weight capacity, 2018–2027 (USD million) 99

TABLE 88 Mexico MOBILE COBOTS market, BY APPLICATION, 2018–2027 (USD million) 99

TABLE 89 Mexico MOBILE COBOTS market, BY Vertical, 2018–2027 (USD million) 100

TABLE 90 MIDDLE EAST & AFRICA MOBILE COBOTS market, BY country, 2018–2027 (USD million) 102

TABLE 91 MIDDLE EAST & AFRICA MOBILE COBOTS market, BY Weight capacity, 2018–2027 (USD million) 103

TABLE 92 MIDDLE EAST & AFRICA MOBILE COBOTS market, BY APPLICATION, 2018–2027 (USD million) 104

TABLE 93 MIDDLE EAST & AFRICA MOBILE COBOTS market, BY Vertical, 2018–2027 (USD million) 105

TABLE 94 SAUDI ARABIA MOBILE COBOTS market, BY Weight capacity, 2018–2027 (USD million) 106

TABLE 95 SAUDI ARABIA MOBILE COBOTS market, BY APPLICATION, 2018–2027 (USD million) 106

TABLE 96 SAUDI ARABIA MOBILE COBOTS market, BY Vertical, 2018–2027 (USD million) 107

TABLE 97 REST OF MIDDLE EAST & AFRICA MOBILE COBOTS market, BY Weight capacity, 2018–2027 (USD million) 107

TABLE 98 REST OF MIDDLE EAST & AFRICA MOBILE COBOTS market, BY APPLICATION, 2018–2027 (USD million) 108

TABLE 99 REST OF MIDDLE EAST & AFRICA MOBILE COBOTS market, BY Vertical, 2018–2027 (USD million) 108

TABLE 100 SOUTH AFRICA MOBILE COBOTS market, BY Weight capacity, 2018–2027 (USD million) 109

TABLE 101 SOUTH AFRICA MOBILE COBOTS market, BY APPLICATION, 2018–2027 (USD million) 109

TABLE 102 SOUTH AFRICA MOBILE COBOTS market, BY Vertical, 2018–2027 (USD million) 110

TABLE 103 UAE MOBILE COBOTS market, BY Weight capacity, 2018–2027 (USD million) 110

TABLE 104 UAE MOBILE COBOTS market, BY APPLICATION, 2018–2027 (USD million) 111

TABLE 105 UAE MOBILE COBOTS market, BY Vertical, 2018–2027 (USD million) 111

TABLE 106 EGYPT MOBILE COBOTS market, BY Weight capacity, 2018–2027 (USD million) 112

TABLE 107 EGYPT MOBILE COBOTS market, BY APPLICATION, 2018–2027 (USD million) 112

TABLE 108 EGYPT MOBILE COBOTS market, BY Vertical, 2018–2027 (USD million) 113

TABLE 109 QATAR MOBILE COBOTS market, BY Weight capacity, 2018–2027 (USD million) 113

TABLE 110 QATAR MOBILE COBOTS market, BY APPLICATION, 2018–2027 (USD million) 114

TABLE 111 QATAR MOBILE COBOTS market, BY Vertical, 2018–2027 (USD million) 114

TABLE 112 SOUTH AMERICA MOBILE COBOT market, BY country, 2018–2027 (USD million) 116

TABLE 113 South America MOBILE COBOT market, BY Weight Capacity, 2018–2027 (USD million) 117

TABLE 114 South America MOBILE COBOT market, BY APPLICATION, 2018–2027 (USD million) 118

TABLE 115 South America MOBILE COBOT market, BY Vertical, 2018–2027 (USD million) 119

TABLE 116 Brazil MOBILE COBOT market, BY Weight Capacity, 2018–2027 (USD million) 120

TABLE 117 Brazil MOBILE COBOT market, BY APPLICATION, 2018–2027 (USD million) 120

TABLE 118 Brazil MOBILE COBOT market, BY Vertical, 2018–2027 (USD million) 121

TABLE 119 Argentina MOBILE COBOT market, BY Weight Capacity, 2018–2027 (USD million) 121

TABLE 120 Argentina MOBILE COBOT market, BY APPLICATION, 2018–2027 (USD million) 122

TABLE 121 Argentina MOBILE COBOT market, BY Vertical, 2018–2027 (USD million) 122

TABLE 122 Colombia MOBILE COBOT market, BY Weight Capacity, 2018–2027 (USD million) 123

TABLE 123 Colombia MOBILE COBOT market, BY APPLICATION, 2018–2027 (USD million) 123

TABLE 124 Colombia MOBILE COBOT market, BY Vertical, 2018–2027 (USD million) 124

TABLE 125 Chile MOBILE COBOT market, BY Weight Capacity, 2018–2027 (USD million) 124

TABLE 126 Chile MOBILE COBOT market, BY APPLICATION, 2018–2027 (USD million) 125

TABLE 127 Chile MOBILE COBOT market, BY Vertical, 2018–2027 (USD million) 125

TABLE 128 Rest of South America MOBILE COBOT market, BY Weight Capacity, 2018–2027 (USD million) 126

TABLE 129 Rest of South America MOBILE COBOT market, BY APPLICATION, 2018–2027 (USD million) 126

TABLE 130 Rest of South America MOBILE COBOT market, BY Vertical, 2018–2027 (USD million) 127

TABLE 131 Partnerships/Agreements/contracts/Collaborations 130

TABLE 132 BUSINESS EXPANSIONS/ACQUISITIONS 131

TABLE 133 product Launches/developments 131

TABLE 134 Abb Limited: PRODUCTS/SOLUTIONS/SERVICES OFFERED 134

TABLE 135 Abb Limited: Key Developments 135

TABLE 136 AUBO Robotics, Inc.: PRODUCTS/SOLUTIONS/SERVICES OFFERED 136

TABLE 137 FANUC corporation: PRODUCTS/SOLUTIONS/SERVICES OFFERED 138

TABLE 138 FANUC CORPORATION: Key Developments 139

TABLE 139 Kawada Robotics: PRODUCTS/SOLUTIONS/SERVICES OFFERED 140

TABLE 140 Kuka AG: PRODUCTS/SOLUTIONS/SERVICES OFFERED 142

TABLE 141 Kuka AG: Key developments 143

TABLE 142 MRK-Systeme GmbH: PRODUCTS/SOLUTIONS/SERVICES OFFERED 144

TABLE 143 Precise Automation: PRODUCTS/SOLUTIONS/SERVICES OFFERED 145

TABLE 144 Techman Robot Inc: PRODUCTS/SOLUTIONS/SERVICES OFFERED 146

TABLE 145 Techman Robot Inc: Key Developments 146

TABLE 146 Yaskawa Electric Corporation: Products/Solutions/services Offered 148

TABLE 147 Yaskawa Electric Corporation: Key developments 149

TABLE 148 AgileX Robotics (Shenzhen) Ltd.: Products/Solutions/services Offered 150

TABLE 149 AgileX Robotics (Shenzhen) Ltd.: Key developments 150

TABLE 150 Robert Bosch GmbH: PRODUCTS/SOLUTIONS/SERVICES Offered 153

TABLE 151 PBA Group: Products/Solutions/services Offered 155

TABLE 152 STAUBLI INTERNATIONAL AG: Products/Solutions/services Offered 156

TABLE 153 Waypoint Robotics: Products/Solutions/services Offered 157

TABLE 154 Waypoint Robotics: Key developments 158

TABLE 155 Robotnik: Products/Solutions/services Offered 159

LIST OF FIGURES

FIGURE 1 Market Attractiveness Analysis: Global Mobile cobots market 22

FIGURE 2 Global Mobile cobots market: Market Structure 24

FIGURE 3 bottom-up and top-down approaches 29

FIGURE 4 market dynamic ANALYSIS OF the Global Mobile cobots MARKET 32

FIGURE 5 Drivers: Impact analysis 34

FIGURE 6 restraint Impact analysis 36

FIGURE 7 VALUE CHAIN: global Mobile cobots MARKET 39

FIGURE 8 PORTER'S FIVE FORCES ANALYSIS OF THE global Mobile cobots MARKET 40

FIGURE 9 Global Mobile cobots MARKET, By weight capacity, 2020 (% SHARE) 42

FIGURE 10 Global Mobile cobots MARKET, By weight capacity, 2020 VS 2027 (USD MILLION) 42

FIGURE 11 Global Mobile cobots MARKET, BY APPLICATION, 2020 (% SHARE) 44

FIGURE 12 Global Mobile cobots MARKET, BY APPLICATION, 2020 VS 2027 (USD MILLION) 44

FIGURE 13 Global Mobile cobots MARKET, BY Vertical, 2020 (% SHARE) 46

FIGURE 14 Global Mobile cobots MARKET, BY Vertical, 2020 VS 2027 (USD MILLION) 46

FIGURE 15 GLOBAL Mobile cobots MARKET, BY REGION, 2020 (% SHARE) 49

FIGURE 16 Global MOBILE COBOTS market, BY Region, 2020 VS 2027 (USD MILLION) 49

FIGURE 17 ASIA-PACIFIC Mobile Cobot MARKET, BY country, 2020 (% SHARE) 50

FIGURE 18 ASIA-PACIFIC MOBILE COBOT market, BY country, 2020 VS 2027 (USD MILLION) 51

FIGURE 19 Asia-Pacific Mobile Cobot MARKET, BY Weight Capacity, 2018-2027 (USD MILLION) 52

FIGURE 20 Asia-Pacific Mobile Cobot MARKET, BY APPLICATION, 2018-2027 (USD MILLION) 53

FIGURE 21 Asia-Pacific Mobile Cobot MARKET, BY Vertical, 2018-2027 (USD MILLION) 54

FIGURE 22 EUROPE MOBILE COBOTS MARKET, BY country, 2020 (% SHARE) 73

FIGURE 23 EUROPE MOBILE COBOTS market, BY country, 2020 vs 2027 (USD MILLION) 74

FIGURE 24 Europe MOBILE COBOTS MARKET, BY Weight capacity, 2018-2027 (USD MILLION) 75

FIGURE 25 Europe MOBILE COBOTS MARKET, BY APPLICATION, 2018-2027 (USD MILLION) 76

FIGURE 26 Europe MOBILE COBOTS MARKET, BY Vertical, 2018-2027 (USD MILLION) 77

FIGURE 27 North america Mobile cobots MARKET, BY country, 2020 (% SHARE) 91

FIGURE 28 North america MOBILE COBOTS market, BY country, 2020 VS 2027 (USD MILLION) 92

FIGURE 29 North America Mobile cobots MARKET, By weight capacity, 2018-2027 (USD MILLION) 93

FIGURE 30 North America Mobile cobots MARKET, BY APPLICATION, 2018-2027 (USD MILLION) 94

FIGURE 31 North America Mobile cobots MARKET, BY Vertical, 2018-2027 (USD MILLION) 95

FIGURE 32 MIDDLE EAST & AFRICA MOBILE COBOTS MARKET, BY country, 2020 (% SHARE) 101

FIGURE 33 MIDDLE EAST & AFRICA MOBILE COBOTS market, BY country, 2020 vs 2027 (USD MILLION) 102

FIGURE 34 MIDDLE EAST & AFRICA MOBILE COBOTS MARKET, BY Weight capacity, 2018-2027 (USD MILLION) 103

FIGURE 35 MIDDLE EAST & AFRICA MOBILE COBOTS MARKET, BY APPLICATION, 2018-2027 (USD MILLION) 104

FIGURE 36 MIDDLE EAST & AFRICA MOBILE COBOTS MARKET, BY Vertical, 2018-2027 (USD MILLION) 105

FIGURE 37 SOUTH AMERICA Mobile Cobot MARKET, BY country, 2020 (% SHARE) 115

FIGURE 38 SOUTH AMERICA MOBILE COBOT market, BY country, 2020 VS 2027 (USD MILLION) 116

FIGURE 39 South America Mobile Cobot MARKET, BY Weight Capacity, 2018-2027 (USD MILLION) 117

FIGURE 40 South America Mobile Cobot MARKET, BY APPLICATION, 2018-2027 (USD MILLION) 118

FIGURE 41 South America Mobile Cobot MARKET, BY Vertical, 2018-2027 (USD MILLION) 119

FIGURE 42 Global mobile cobot market: Competitive benchmarking 129

FIGURE 43 Vendor share Analysis, 2021 (%) 130

FIGURE 44 Abb Limited: Financial Overview snapshot 134

FIGURE 45 Abb Limited: SWOT Analysis 135

FIGURE 46 FANUC corporation: Financial Overview snapshot 138

FIGURE 47 FANUC CORPORATION: SWOT ANALYSIS 139

FIGURE 48 Kuka AG: Financial Overview snapshot 142

FIGURE 49 Kuka AG: SWOT ANALYSIS 143

FIGURE 50 Yaskawa Electric Corporation: Financial Overview snapshot 148

FIGURE 51 Yaskawa Electric Corporation: SWOT ANALYSIS 149

FIGURE 52 AgileX Robotics (Shenzhen) Ltd.: SWOT ANALYSIS 151

FIGURE 53 Robert Bosch GmbH: Financial Overview snapshot 153

FIGURE 54 Robert Bosch GmbH: SWOT Analysis 154

Mobile Cobots Market Segmentation


Mobile Cobots Market Weight Capacity Outlook (USD Billion, 2019-2032)


  • 1 to 3kg


  • 3 to 5kg


  • 5 to 10kg


  • Above 10kg


Mobile Cobots Market Application Outlook (USD Billion, 2019-2032)


  • Automated Pallet Forks


  • Conveyor Brands/ Belts


  • Robotic Arms


  • Safety Units


  • Shelf Units


Mobile Cobots Market End User Outlook (USD Billion, 2019-2032)


  • Aerospace


  • Agriculture


  • Automotive


  • Construction


  • Electronics & Semiconductor


  • Food & Beverage


  • Healthcare


  • Retail & Logistics


Mobile Cobots Market Regional Outlook (USD Billion, 2019-2032)


  • North America Outlook (USD Billion, 2019-2032)


    • North America Mobile Cobots Market by Weight Capacity


  • 1 to 3kg


  • 3 to 5kg


  • 5 to 10kg


  • Above 10kg


    • North America Mobile Cobots Market by Application


  • Automated Pallet Forks


  • Conveyor Brands/ Belts


  • Robotic Arms


  • Safety Units


  • Shelf Units


  • North America Mobile Cobots Market by End User


  • Aerospace


  • Agriculture


  • Automotive


  • Construction


  • Electronics & Semiconductor


  • Food & Beverage


  • Healthcare


  • Retail & Logistics


    • US Outlook (USD Billion, 2019-2032)


    • US Mobile Cobots Market by Weight Capacity


      • 1 to 3kg


      • 3 to 5kg


      • 5 to 10kg


      • Above 10kg


    • US Mobile Cobots by Application


      • Automated Pallet Forks


      • Conveyor Brands/ Belts


      • Robotic Arms


      • Safety Units


      • Shelf Units


    • US Mobile Cobots Market by End User


  • Aerospace


  • Agriculture


  • Automotive


  • Construction


  • Electronics & Semiconductor


  • Food & Beverage


  • Healthcare


  • Retail & Logistics


    • CANADA Outlook (USD Billion, 2019-2032)


    • CANADA Mobile Cobots by Weight Capacity


      • 1 to 3kg


      • 3 to 5kg


      • 5 to 10kg


      • Above 10kg


    • CANADA Mobile Cobots by Application


      • Automated Pallet Forks


      • Conveyor Brands/ Belts


      • Robotic Arms


      • Safety Units


      • Shelf Units


    • CANADA Mobile Cobots Market by End User


  • Aerospace


  • Agriculture


  • Automotive


  • Construction


  • Electronics & Semiconductor


  • Food & Beverage


  • Healthcare


  • Retail & Logistics


    • Europe Outlook (USD Billion, 2019-2032)


    • Europe Mobile Cobots by Weight Capacity


      • 1 to 3kg


      • 3 to 5kg


      • 5 to 10kg


      • Above 10kg


    • Europe Mobile Cobots by Application


      • Automated Pallet Forks


      • Conveyor Brands/ Belts


      • Robotic Arms


      • Safety Units


      • Shelf Units


    • Europe Mobile Cobots Market by End User


  • Aerospace


  • Agriculture


  • Automotive


  • Construction


  • Electronics & Semiconductor


  • Food & Beverage


  • Healthcare


  • Retail & Logistics


    • Germany Outlook (USD Billion, 2019-2032)


    • Germany Mobile Cobots by Weight Capacity


      • 1 to 3kg


      • 3 to 5kg


      • 5 to 10kg


      • Above 10kg


    • Germany Mobile Cobots by Application


      • Automated Pallet Forks


      • Conveyor Brands/ Belts


      • Robotic Arms


      • Safety Units


      • Shelf Units


    • Germany Mobile Cobots Market by End User


  • Aerospace


  • Agriculture


  • Automotive


  • Construction


  • Electronics & Semiconductor


  • Food & Beverage


  • Healthcare


  • Retail & Logistics


    • France Outlook (USD Billion, 2019-2032)


    • France Mobile Cobots by Weight Capacity


      • 1 to 3kg


      • 3 to 5kg


      • 5 to 10kg


      • Above 10kg


    • France Mobile Cobots by Application


      • Automated Pallet Forks


      • Conveyor Brands/ Belts


      • Robotic Arms


      • Safety Units


      • Shelf Units


    • France Mobile Cobots Market by End User


  • Aerospace


  • Agriculture


  • Automotive


  • Construction


  • Electronics & Semiconductor


  • Food & Beverage


  • Healthcare


  • Retail & Logistics


    • UK Outlook (USD Billion, 2019-2032)


    • UK Mobile Cobots by Weight Capacity


      • 1 to 3kg


      • 3 to 5kg


      • 5 to 10kg


      • Above 10kg


    • UK Mobile Cobots by Application


      • Automated Pallet Forks


      • Conveyor Brands/ Belts


      • Robotic Arms


      • Safety Units


      • Shelf Units


    • UK Mobile Cobots Market by End User


  • Aerospace


  • Agriculture


  • Automotive


  • Construction


  • Electronics & Semiconductor


  • Food & Beverage


  • Healthcare


  • Retail & Logistics


    • ITALY Outlook (USD Billion, 2019-2032)


    • ITALY Mobile Cobots by Weight Capacity


      • 1 to 3kg


      • 3 to 5kg


      • 5 to 10kg


      • Above 10kg


    • ITALY Mobile Cobots by Application


      • Automated Pallet Forks


      • Conveyor Brands/ Belts


      • Robotic Arms


      • Safety Units


      • Shelf Units


    • ITALY Mobile Cobots Market by End User


  • Aerospace


  • Agriculture


  • Automotive


  • Construction


  • Electronics & Semiconductor


  • Food & Beverage


  • Healthcare


  • Retail & Logistics


    • SPAIN Outlook (USD Billion, 2019-2032)


    • Spain Mobile Cobots by Weight Capacity


      • 1 to 3kg


      • 3 to 5kg


      • 5 to 10kg


      • Above 10kg


    • Spain Mobile Cobots by Application


      • Automated Pallet Forks


      • Conveyor Brands/ Belts


      • Robotic Arms


      • Safety Units


      • Shelf Units


    • Spain Mobile Cobots Market by End User


  • Aerospace


  • Agriculture


  • Automotive


  • Construction


  • Electronics & Semiconductor


  • Food & Beverage


  • Healthcare


  • Retail & Logistics


    • Rest Of Europe Outlook (USD Billion, 2019-2032)


    • Rest Of Europe Mobile Cobots by Weight Capacity


      • 1 to 3kg


      • 3 to 5kg


      • 5 to 10kg


      • Above 10kg


    • REST OF EUROPE Mobile Cobots by Application


      • Automated Pallet Forks


      • Conveyor Brands/ Belts


      • Robotic Arms


      • Safety Units


      • Shelf Units


    • REST OF EUROPE Mobile Cobots Market by End User


  • Aerospace


  • Agriculture


  • Automotive


  • Construction


  • Electronics & Semiconductor


  • Food & Beverage


  • Healthcare


  • Retail & Logistics


  • Asia-Pacific Outlook (USD Billion, 2019-2032)


    • Asia-Pacific Mobile Cobots by Weight Capacity


      • 1 to 3kg


      • 3 to 5kg


      • 5 to 10kg


      • Above 10kg


    • Asia-Pacific Mobile Cobots by Application


      • Automated Pallet Forks


      • Conveyor Brands/ Belts


      • Robotic Arms


      • Safety Units


      • Shelf Units


    • Asia-Pacific Mobile Cobots Market by End User


  • Aerospace


  • Agriculture


  • Automotive


  • Construction


  • Electronics & Semiconductor


  • Food & Beverage


  • Healthcare


  • Retail & Logistics


    • China Outlook (USD Billion, 2019-2032)


    • China Mobile Cobots by Weight Capacity


      • 1 to 3kg


      • 3 to 5kg


      • 5 to 10kg


      • Above 10kg


    • China Mobile Cobots by Application


      • Automated Pallet Forks


      • Conveyor Brands/ Belts


      • Robotic Arms


      • Safety Units


      • Shelf Units


    • China Mobile Cobots Market by End User


  • Aerospace


  • Agriculture


  • Automotive


  • Construction


  • Electronics & Semiconductor


  • Food & Beverage


  • Healthcare


  • Retail & Logistics


    • Japan Outlook (USD Billion, 2019-2032)


    • Japan Mobile Cobots by Weight Capacity


      • 1 to 3kg


      • 3 to 5kg


      • 5 to 10kg


      • Above 10kg


    • Japan Mobile Cobots by Application


      • Automated Pallet Forks


      • Conveyor Brands/ Belts


      • Robotic Arms


      • Safety Units


      • Shelf Units


    • Japan Mobile Cobots Market by End User


    • Aerospace


    • Agriculture


    • Automotive


    • Construction


    • Electronics & Semiconductor


    • Food & Beverage


    • Healthcare


    • Retail & Logistics


    • India Mobile Cobots by Weight Capacity


      • 1 to 3kg


      • 3 to 5kg


      • 5 to 10kg


      • Above 10kg


    • India Mobile Cobots by Application


      • Automated Pallet Forks


      • Conveyor Brands/ Belts


      • Robotic Arms


      • Safety Units


      • Shelf Units


    • India Mobile Cobots Market by End User


  • Aerospace


  • Agriculture


  • Automotive


  • Construction


  • Electronics & Semiconductor


  • Food & Beverage


  • Healthcare


  • Retail & Logistics


    • Australia Outlook (USD Billion, 2019-2032)


    • Australia Mobile Cobots by Weight Capacity


      • 1 to 3kg


      • 3 to 5kg


      • 5 to 10kg


      • Above 10kg


    • Australia Mobile Cobots by Application


      • Automated Pallet Forks


      • Conveyor Brands/ Belts


      • Robotic Arms


      • Safety Units


      • Shelf Units


    • Australia Mobile Cobots Market by End User


  • Aerospace


  • Agriculture


  • Automotive


  • Construction


  • Electronics & Semiconductor


  • Food & Beverage


  • Healthcare


  • Retail & Logistics


    • Rest of Asia-Pacific Outlook (USD Billion, 2019-2032)


    • Rest of Asia-Pacific Mobile Cobots by Weight Capacity


      • 1 to 3kg


      • 3 to 5kg


      • 5 to 10kg


      • Above 10kg


    • Rest of Asia-Pacific Mobile Cobots by Application


      • Automated Pallet Forks


      • Conveyor Brands/ Belts


      • Robotic Arms


      • Safety Units


      • Shelf Units


    • Rest of Asia-Pacific Mobile Cobots Market by End User


  • Aerospace


  • Agriculture


  • Automotive


  • Construction


  • Electronics & Semiconductor


  • Food & Beverage


  • Healthcare


  • Retail & Logistics


  • Rest of the World Outlook (USD Billion, 2019-2032)


    • Rest of the World Mobile Cobots by Weight Capacity


      • 1 to 3kg


      • 3 to 5kg


      • 5 to 10kg


      • Above 10kg


    • Rest of the World Mobile Cobots by Application


      • Automated Pallet Forks


      • Conveyor Brands/ Belts


      • Robotic Arms


      • Safety Units


      • Shelf Units


    • Rest of the World Mobile Cobots Market by End User


  • Aerospace


  • Agriculture


  • Automotive


  • Construction


  • Electronics & Semiconductor


  • Food & Beverage


  • Healthcare


  • Retail & Logistics


    • Middle East Outlook (USD Billion, 2019-2032)


    • Middle East Mobile Cobots by Weight Capacity


      • 1 to 3kg


      • 3 to 5kg


      • 5 to 10kg


      • Above 10kg


    • Middle East Mobile Cobots by Application


      • Automated Pallet Forks


      • Conveyor Brands/ Belts


      • Robotic Arms


      • Safety Units


      • Shelf Units


    • Middle East Mobile Cobots Market by End User


  • Aerospace


  • Agriculture


  • Automotive


  • Construction


  • Electronics & Semiconductor


  • Food & Beverage


  • Healthcare


  • Retail & Logistics


    • Africa Outlook (USD Billion, 2019-2032)


    • Africa Mobile Cobots by Weight Capacity


      • 1 to 3kg


      • 3 to 5kg


      • 5 to 10kg


      • Above 10kg


    • Africa Mobile Cobots by Application


      • Automated Pallet Forks


      • Conveyor Brands/ Belts


      • Robotic Arms


      • Safety Units


      • Shelf Units


    • Africa Mobile Cobots Market by End User


  • Aerospace


  • Agriculture


  • Automotive


  • Construction


  • Electronics & Semiconductor


  • Food & Beverage


  • Healthcare


  • Retail & Logistics


    • Latin America Outlook (USD Billion, 2019-2032)


    • Latin America Mobile Cobots by Weight Capacity


      • 1 to 3kg


      • 3 to 5kg


      • 5 to 10kg


      • Above 10kg


    • Latin America Mobile Cobots by Application


      • Automated Pallet Forks


      • Conveyor Brands/ Belts


      • Robotic Arms


      • Safety Units


      • Shelf Units


    • Latin America Mobile Cobots Market by End User


  • Aerospace


  • Agriculture


  • Automotive


  • Construction


  • Electronics & Semiconductor


  • Food & Beverage


  • Healthcare


  • Retail & Logistics


Leading companies partner with us for data-driven Insights.
Report List icon Report List icon Report List icon Report List icon Report List icon Report List icon Report List icon Report List icon Report List icon Report List icon Report List icon

Kindly complete the form below to receive a free sample of this Report

Please fill in Business Email for Quick Response
Invalid

Research Methodology on Mobile Cobots Market


Introduction


This research report covers the market dynamics and trends of the Mobile Cobots (Collaborative Robots) market that are expected to affect the market during the forecast period from 2023 to 2030. The report research provided an in-depth analysis of the Mobile Cobots (Collaborative Robots) market, including information about products, product innovations, mergers and acquisitions, recent industry developments, and the competitive landscape of the market. In addition, this report examines the key market drivers and restraints that are impacting the growth of the market during the forecast period. This research aims to provide a comprehensive overview of the current and future state of the market and identify the major growth opportunities and challenges facing the market in the near future.


Research Methodology


The research methodology employed includes primary research, secondary research and surveys to provide an in-depth understanding of the Mobile Cobots (Collaborative Robots) market. A market assessment is conducted by critically assessing the data points obtained from the primary and secondary research data sources. The report primarily focuses on the five major market trends, namely, the impact of technology, market dynamics, competition and the growth potential of the Mobile Cobots (Collaborative Robots) market. The data obtained from this research is then compared to the existing data available for the Mobile Cobots (Collaborative Robots) market to establish the current state of the market.


Primary Research


Primary research consists of surveys, in-depth interviews with industry experts and end-user surveys. The primary research involved interviews with a total of 20 industry experts, 10 end-users and 10 buyers for the Mobile Cobots (Collaborative Robots) market, to ascertain the current and future state of the market. The survey results provide valuable insights regarding the market dynamics, industry trends and private opinions related to the market.


Secondary Research


Secondary research includes industry financials, government documents and trade statistics. The secondary research involved in the report includes a detailed analysis of the leading companies, their market shares and related statistics. In addition, the report also includes information related to the strategic initiatives taken by the companies operating in the Mobile Cobots (Collaborative Robots) market.


Stakeholder Analysis and Engagement


The stakeholder analysis and engagement are considered to be vital steps of the research methodology employed. The stakeholder groups identified include government bodies, special interest groups, technology vendors, manufacturers, sellers and buyers. Engaging with the stakeholders helps to get an in-depth understanding of their perspectives regarding the market and their requirements in terms of products and services.


Data Analysis


The data collected from the primary and secondary research sources are collated and analysed for further insights. The analysis is done employing statistical tools, such as Porter's Five Forces Model, Value chain analysis, market attractiveness index and scenario analyses. Further analysis is done in descending quadrants such as market segmentation, regional analysis, product type and application analysis to facilitate a deeper understanding of the market structure, market opportunities, strengths and weaknesses. The analysis is further used to identify market opportunities and areas of opportunities for the Mobile Cobots (Collaborative Robots) market.


Conclusion


The research methodology employed in this report helps provide an in-depth understanding of the Mobile Cobots (Collaborative Robots) market and assesses the current and future market state. The data obtained through the research enables the identification of major growth opportunities and the barriers that are hindering the growth of the market along with the market forecast for 2023 to 2030. This method helps to gain a comprehensive and accurate understanding of the Mobile Cobots (Collaborative Robots) market and provides key stakeholders with informed decisions regarding future market performance.

Speak to Analyst