Microcatheters Market Summary
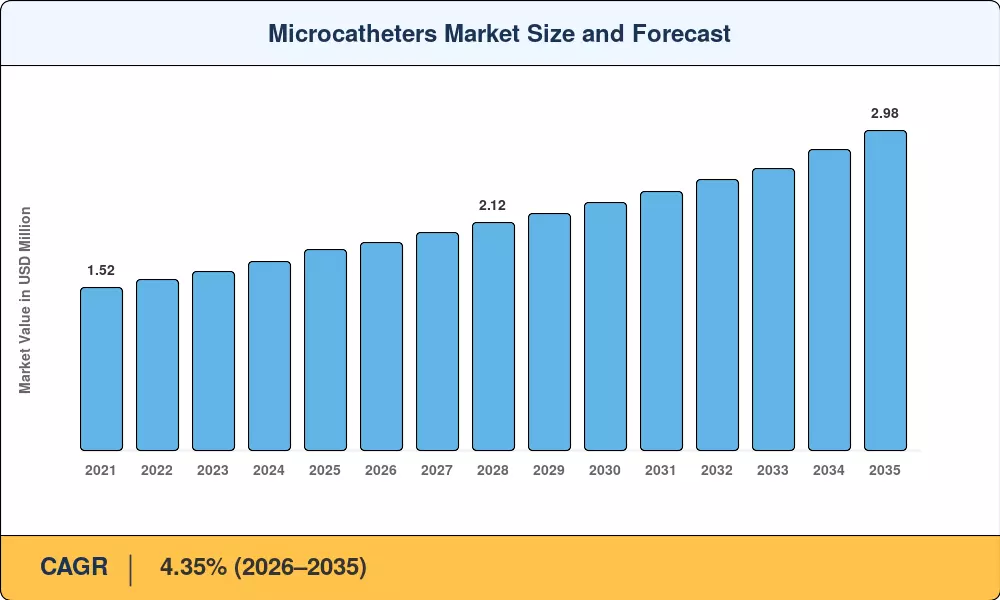
The Global Microcatheters Market size was valued at USD 1.87 Billion in 2025, and the market is projected to grow from USD 1.94 Billion in 2026 to USD 2.98 Billion by 2035, registering a CAGR of 4.35% during the forecast period 2026–2035. Accelerating stroke-intervention mandates across OECD nations and expanded reimbursement pathways for percutaneous coronary procedures anchor this growth trajectory. The U.S. Centers for Medicare & Medicaid Services broadened outpatient catheterization coverage in 2024, channeling an estimated USD 1.2 billion in incremental procedural spending toward small-bore vascular catheter technologies[2].
A generational shift in device engineering is underway. Legacy stainless-steel guidewire-dependent systems are giving way to braided-polymer and hydrophilic-coated neurointerventional micro catheter platforms that deliver superior tip-tracking accuracy across tortuous anatomies. Teleflex's €760 million acquisition of BIOTRONIK's vascular-intervention unit in 2024 signaled how seriously manufacturers view integrated endovascular access device portfolios [3]. Meanwhile, advanced manufacturing techniques — including laser-cut hypotube extrusion — are trimming unit costs by an estimated 8–12% per generation cycle.
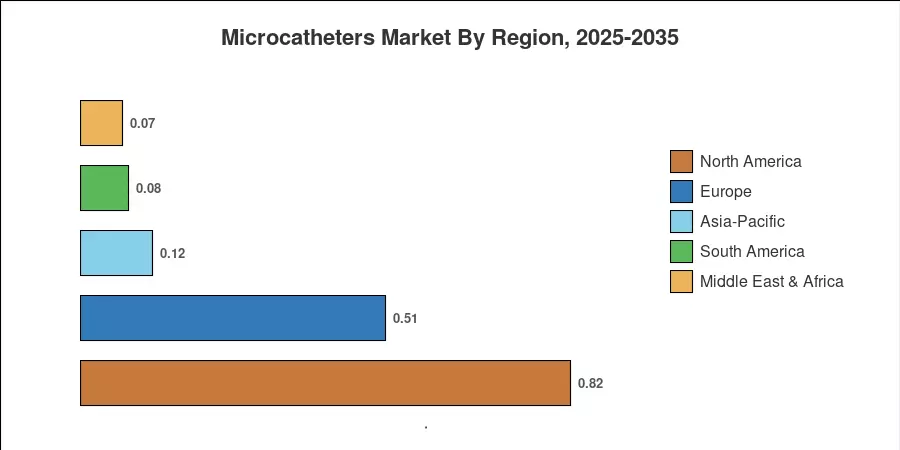
North America commanded roughly 44% of the Microcatheters Market revenue in 2025, driven by high interventional-cardiology volumes and dense catheterization-lab infrastructure. Asia-Pacific posts the fastest regional CAGR at 6.50%, fueled by hospital-capacity expansions in China and India. Europe holds the second-largest share at approximately 27%, where stroke-network directives continue to pull arterial microcatheter navigation volumes upward The decade ahead favors manufacturers that pair material science innovation with ambulatory-surgery-center distribution strategies.
Key Report Takeaways
• By Product
- Delivery microcatheters captured 37.2% of global revenue in 2025, reflecting widespread adoption in embolization and stent-delivery workflows
- Steerable microcatheters are forecast to expand at a 5.40% CAGR through 2035, as neurointerventional suites demand enhanced navigational precision
- Diagnostic microcatheters accounted for USD 0.39 billion in 2025, supporting pre-procedural mapping across cardiovascular and oncological settings
• By Design
- Single-lumen systems held 70.1% share of the Microcatheters Market in 2025, driven by cost efficiency in routine coronary interventions
- Dual-lumen configurations post the fastest design-segment CAGR at 5.80%, enabling simultaneous contrast injection and wire exchange
• By Application
- Neurovascular applications are projected to grow at 6.20% CAGR, propelled by thrombectomy guideline expansions
• By Region
- North America led with a 44% share of the global Microcatheters Market value in 2025
- Asia-Pacific registered a 6.50% CAGR, the highest among all regions through 2035
- Europe contributed approximately USD 0.51 billion in 2025, underpinned by EU Stroke Action Plan investments
Market Size and Forecast (2021–2035)
Market Research Future (MRFR)'s sizing methodology triangulates bottom-up device shipment data from over 120 OEM disclosures, top-down procedural volume estimates from WHO and national registries, and primary interviews with interventional radiologists across 14 countries. Historical figures reflect actual reported revenues; forecast values apply a calibrated compound growth model validated against hospital procurement databases[4].