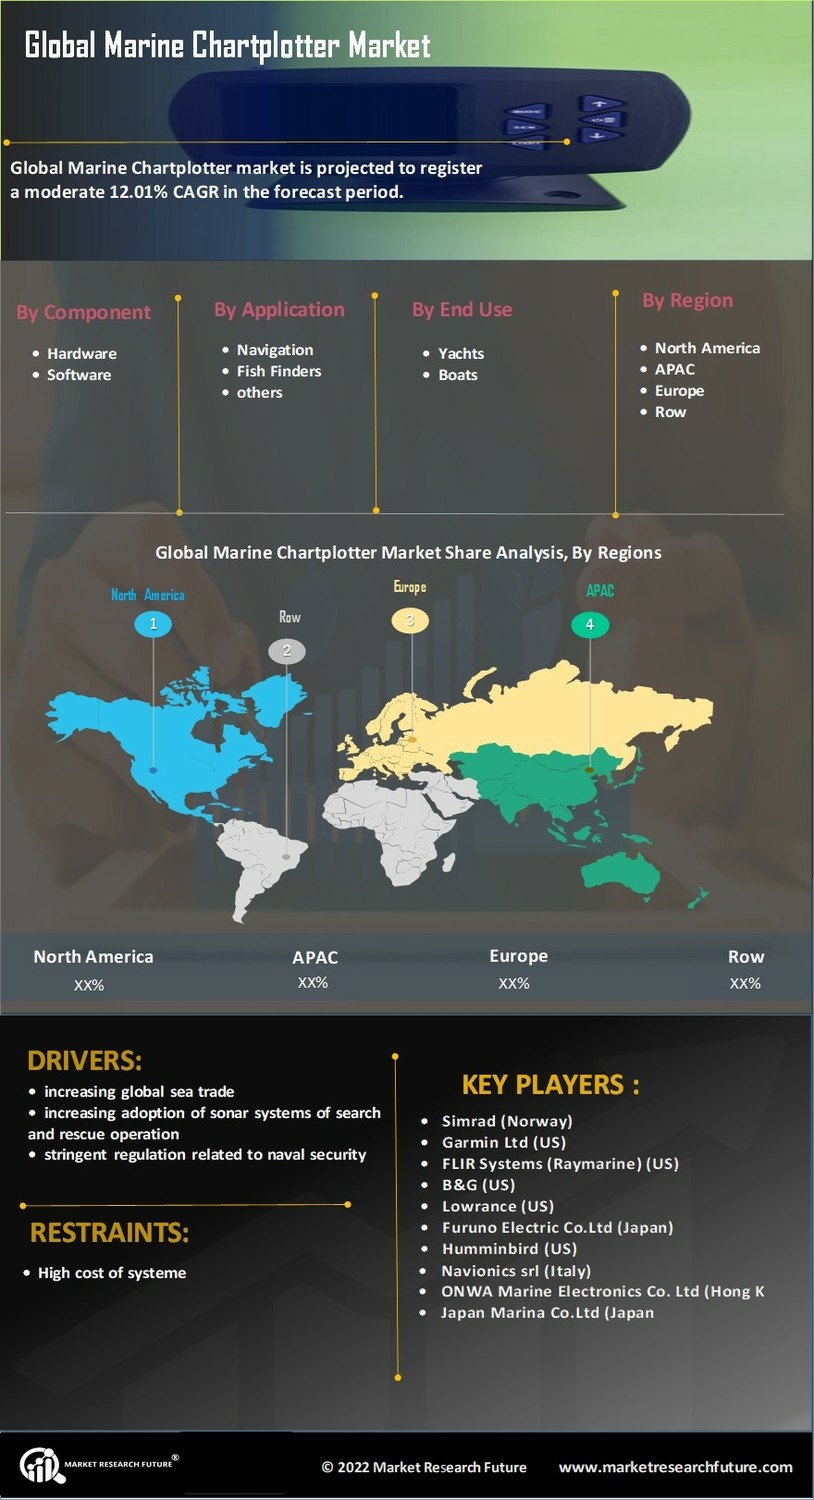
Marine Chartplotter Market
ID: MRFR/AD/6801-HCR
133 Pages
Abbas Raut
Last Updated: April 27, 2026
Marine Chartplotter Market Size, Share, Industry Trend & Analysis Research Report By Application (Navigation, Fishing, Safety and Rescue, Recreational Boating), By Type (Standalone Chartplotters, Networked Chartplotters, Integrated Chartplotters), By Display Type (LCD, LED, Touchscreen, Non-Touchscreen), By End Use (Commercial Vessels, Leisure Boats, Fishing Boats, Yachts) andBy Regional (North America, Europe, South America, Asia Pacific, Middle East and Africa)- Forecast to 2035