ID: MRFR/A&D/6801-HCR | February 2021 | Region: Global | 133 Pages
Table of Contents
1. Executive Summary
1.1. Market Attractiveness Analysis
1.1.1. Global Marine Chartplotter Market, by Component
1.1.2. Global Marine Chartplotter Market, by Application
1.1.3. Global Marine Chartplotter Market, by End Use
1.1.4. Global Marine Chartplotter Market, by Region
2. Market Introduction
2.1. Market Definition
2.2. Scope of the Study
2.3. Market Structure
2.4. Key Buying Criteria
2.5. Market Factor Indicator Analysis
3. Research Methodology
3.1. Research Process
3.2. Primary Research
3.3. Secondary Research
3.4. Market Size Estimation
3.5. Forecast Model
3.6. List of Assumptions
4. Market Insights
5. Market Dynamics
5.1. Introduction
5.2. Drivers
5.2.1. Increasing Global Sea Trade
5.2.2. Increasing Adoption of Sonar Systems for Search and Rescue Operations
5.2.3. Stringent Regulations Related to Naval Security
5.2.4. Rising use of anti-Submarine Warfare Systems and Unmanned Underwater vehicle
5.3. Restraints
5.3.1. High Cost of Systems
5.4. Opportunities
5.4.1. Technological Advancement and Development in Navigation and Communication Systems
5.4.2. Rising Use of Marine Chartplotter Equipment for Recreational Boats
5.5. Market/Technological Trends
5.6. Patent Trends
5.7. Regulatory Landscape/Standards
β
6. Market Factor Analysis
6.1. Value Chain/Supply Chain Analysis
6.1.1. R&D
6.1.2. Manufacturing
6.1.3. Distribution & Sales
6.1.4. Post-Sales Monitoring
6.2. Porterβs Five Forces Analysis
6.2.1. Threat of New Entrants
6.2.2. Bargaining Power of Buyers
6.2.3. Threat of Substitutes
6.2.4. Segment Rivalry
6.2.5. Bargaining Power of Supplies
7. Global Marine Chartplotter Market, by Component
7.1. Introduction
7.2. Hardware
7.2.1. Market Estimates & Forecast, 2020β2027
7.2.2. Market Estimates & Forecast, by Region, 2020β2027
7.2.3. Display
7.2.3.1. Market Estimates & Forecast, 2020β2027
7.2.3.2. Market Estimates & Forecast, by Region, 2020β2027
7.2.4. Radar
7.2.4.1. Market Estimates & Forecast, 2020β2027
7.2.4.2. Market Estimates & Forecast, by Region, 2020β2027
7.2.5. Sonar/GPS
7.2.5.1. Market Estimates & Forecast, 2020β2027
7.2.5.2. Market Estimates & Forecast, by Region, 2020β2027
7.2.6. Others
7.2.6.1. Market Estimates & Forecast, 2020β2027
7.2.6.2. Market Estimates & Forecast, by Region, 2020β2027
7.3. Software
7.3.1. Market Estimates & Forecast, 2020β2027
7.3.2. Market Estimates & Forecast, by Region, 2020β2027
8. Global Marine Chartplotter Market, by Application
8.1. Introduction
8.2. Navigation
8.2.1. Market Estimates & Forecast, 2020β2027
8.2.2. Market Estimates & Forecast, by Region, 2020β2027
8.3. Fish Finders
8.3.1. Market Estimates & Forecast, 2020β2027
8.3.2. Market Estimates & Forecast, by Region, 2020β2027
8.4. Others
8.4.1. Market Estimates & Forecast, 2020β2027
8.4.2. Market Estimates & Forecast, by Region, 2020β2027
9. Global Marine Chartplotter Market, by End Use
9.1. Introduction
9.2. Yachts
9.2.1. Market Estimates & Forecast, 2020β2027
9.2.2. Market Estimates & Forecast, by Region, 2020β2027
9.3. Boats
9.3.1. Market Estimates & Forecast, 2020β2027
9.3.2. Market Estimates & Forecast, by Region, 2020β2027
10. Global Marine Chartplotter Market, by Region
10.1. Introduction
10.2. North America
10.2.1. Market Estimates & Forecast, by Country, 2020β2027
10.2.2. Market Estimates & Forecast, by Component, 2020β2027
10.2.3. Market Estimates & Forecast, by Application, 2020β2027
10.2.4. Market Estimates & Forecast, by End Use, 2020β2027
10.2.5. US
10.2.5.1. Market Estimates & Forecast, by Component, 2020β2027
10.2.5.2. Market Estimates & Forecast, by Application, 2020β2027
10.2.5.3. Market Estimates & Forecast, by End Use, 2020β2027
10.2.6. Canada
10.2.6.1. Market Estimates & Forecast, by Component, 2020β2027
10.2.6.2. Market Estimates & Forecast, by Application, 2020β2027
10.2.6.3. Market Estimates & Forecast, by End Use, 2020β2027
10.3. Europe
10.3.1. Market Estimates & Forecast, by Country, 2020β2027
10.3.2. Market Estimates & Forecast, by Component, 2020β2027
10.3.3. Market Estimates & Forecast, by Application, 2020β2027
10.3.4. Market Estimates & Forecast, by End Use, 2020β2027
10.3.5. UK
10.3.5.1. Market Estimates & Forecast, by Component, 2020β2027
10.3.5.2. Market Estimates & Forecast, by Application, 2020β2027
10.3.5.3. Market Estimates & Forecast, by End Use, 2020β2027
10.3.6. Germany
10.3.6.1. Market Estimates & Forecast, by Component, 2020β2027
10.3.6.2. Market Estimates & Forecast, by Application, 2020β2027
10.3.6.3. Market Estimates & Forecast, by End Use, 2020β2027
10.3.7. France
10.3.7.1. Market Estimates & Forecast, by Component, 2020β2027
10.3.7.2. Market Estimates & Forecast, by Application, 2020β2027
10.3.7.3. Market Estimates & Forecast, by End Use, 2020β2027
10.3.8. Italy
10.3.8.1. Market Estimates & Forecast, by Component, 2020β2027
10.3.8.2. Market Estimates & Forecast, by Application, 2020β2027
10.3.8.3. Market Estimates & Forecast, by End Use, 2020β2027
10.3.9. Rest of Europe
10.3.9.1. Market Estimates & Forecast, by Component, 2020β2027
10.3.9.2. Market Estimates & Forecast, by Application, 2020β2027
10.3.9.3. Market Estimates & Forecast, by End Use, 2020β2027
10.4. Asia-Pacific
10.4.1. Market Estimates & Forecast, by Country, 2020β2027
10.4.2. Market Estimates & Forecast, by Component, 2020β2027
10.4.3. Market Estimates & Forecast, by Application, 2020β2027
10.4.4. Market Estimates & Forecast, by End Use, 2020β2027
10.4.5. China
10.4.5.1. Market Estimates & Forecast, by Component, 2020β2027
10.4.5.2. Market Estimates & Forecast, by Application, 2020β2027
10.4.5.3. Market Estimates & Forecast, by End Use, 2020β2027
10.4.6. Japan
10.4.6.1. Market Estimates & Forecast, by Component, 2020β2027
10.4.6.2. Market Estimates & Forecast, by Application, 2020β2027
10.4.6.3. Market Estimates & Forecast, by End Use, 2020β2027
10.4.7. India
10.4.7.1. Market Estimates & Forecast, by Component, 2020β2027
10.4.7.2. Market Estimates & Forecast, by Application, 2020β2027
10.4.7.3. Market Estimates & Forecast, by End Use, 2020β2027
10.4.8. Australia
10.4.8.1. Market Estimates & Forecast, by Component, 2020β2027
10.4.8.2. Market Estimates & Forecast, by Application, 2020β2027
10.4.8.3. Market Estimates & Forecast, by End Use, 2020β2027
10.4.9. Rest of Asia-Pacific
10.4.9.1. Market Estimates & Forecast, by Component, 2020β2027
10.4.9.2. Market Estimates & Forecast, by Application, 2020β2027
10.4.9.3. Market Estimates & Forecast, by End Use, 2020β2027
10.5. Middle East & Africa
10.5.1. Market Estimates & Forecast, by Country, 2020β2027
10.5.2. Market Estimates & Forecast, by Application, 2020β2027
10.5.3. Market Estimates & Forecast, by End Use, 2020β2027
10.5.4. Saudi Arabia
10.5.4.1. Market Estimates & Forecast, by Component, 2020β2027
10.5.4.2. Market Estimates & Forecast, by Application, 2020β2027
10.5.4.3. Market Estimates & Forecast, by End Use, 2020β2027
10.5.5. UAE
10.5.5.1. Market Estimates & Forecast, by Component, 2020β2027
10.5.5.2. Market Estimates & Forecast, by Application, 2020β2027
10.5.5.3. Market Estimates & Forecast, by End Use, 2020β2027
10.5.6. Rest of the Middle East & Africa
10.5.6.1. Market Estimates & Forecast, by Component, 2020β2027
10.5.6.2. Market Estimates & Forecast, by Application, 2020β2027
10.5.6.3. Market Estimates & Forecast, by End Use, 2020β2027
10.6. Latin America
10.6.1. Market Estimates & Forecast, by Country, 2020β2027
10.6.2. Market Estimates & Forecast, by Component, 2020β2027
10.6.3. Market Estimates & Forecast, by Application, 2020β2027
10.6.4. Market Estimates & Forecast, by End Use, 2020β2027
10.6.5. Brazil
10.6.5.1. Market Estimates & Forecast, by Component, 2020β2027
10.6.5.2. Market Estimates & Forecast, by Application, 2020β2027
10.6.5.3. Market Estimates & Forecast, by End Use, 2020β2027
10.6.6. Rest of Latin America
10.6.6.1. Market Estimates & Forecast, by Component, 2020β2027
10.6.6.2. Market Estimates & Forecast, by Application, 2020β2027
10.6.6.3. Market Estimates & Forecast, by End Use, 2020β2027
11. Competitive Landscape
11.1. Competitive Overview
11.2. Competitor Dashboard
11.3. Major Growth Strategies in the Global Marine Chartplotter Market
11.4. Competitive Benchmarking
11.5. Market Share Analysis
11.6. Leading Player in Terms of Number of Developments in the Global Marine Chartplotter Market
11.7. Key Developments & Growth Strategies
11.7.1. New Product Launches/Service Deployments
11.7.2. Mergers & Acquisitions
11.7.3. Joint Ventures
12. Company Profiles
12.1. Key Market Players
12.1.1. Simrad
12.1.1.1. Company Overview
12.1.1.2. Product Offering
12.1.1.3. Financial Overview
12.1.1.4. Key Developments
12.1.1.5. SWOT Analysis
12.1.1.6. Key Strategies
12.1.2. Garmin Ltd
12.1.2.1. Company Overview
12.1.2.2. Product Offering
12.1.2.3. Financial Overview
12.1.2.4. Key Developments
12.1.2.5. SWOT Analysis
12.1.2.6. Key Strategies
12.1.3. FLIR Systems (Raymarine)
12.1.3.1. Company Overview
12.1.3.2. Product Offering
12.1.3.3. Financial Overview
12.1.3.4. Key Developments
12.1.3.5. SWOT Analysis
12.1.3.6. Key Strategies
12.1.4. B&G
12.1.4.1. Company Overview
12.1.4.2. Product Offering
12.1.4.3. Financial Overview
12.1.4.4. Key Developments
12.1.4.5. SWOT Analysis
12.1.4.6. Key Strategies
12.1.5. Lowrance
12.1.5.1. Company Overview
12.1.5.2. Product Offering
12.1.5.3. Financial Overview
12.1.5.4. Key Developments
12.1.5.5. SWOT Analysis
12.1.5.6. Key Strategies
12.1.6. Furuno Electric Co., Ltd.
12.1.6.1. Company Overview
12.1.6.2. Product Offering
12.1.6.3. Financial Overview
12.1.6.4. Key Developments
12.1.6.5. SWOT Analysis
12.1.6.6. Key Strategies
β
12.1.7. Humminbird
12.1.7.1. Company Overview
12.1.7.2. Product Offering
12.1.7.3. Financial Overview
12.1.7.4. Key Developments
12.1.7.5. SWOT Analysis
12.1.7.6. Key Strategies
12.1.8. Navionics srl
12.1.8.1. Company Overview
12.1.8.2. Product Offering
12.1.8.3. Financial Overview
12.1.8.4. Key Developments
12.1.8.5. SWOT Analysis
12.1.8.6. Key Strategies
12.1.9. ONWA Marine Chartplotter Co. Ltd.
12.1.9.1. Company Overview
12.1.9.2. Product Offering
12.1.9.3. Financial Overview
12.1.9.4. Key Developments
12.1.9.5. SWOT Analysis
12.1.9.6. Key Strategies
12.1.10. Japan Marina Co., Ltd.
12.1.10.1. Company Overview
12.1.10.2. Product Offering
12.1.10.3. Financial Overview
12.1.10.4. Key Developments
12.1.10.5. SWOT Analysis
12.1.10.6. Key Strategies
13. Appendix
13.1. References
13.2. Related Reports
14. List of Abbreviations
Note: This table of contents is tentative and subject to change as the research progresses.
β
List of Tables
Table 1 Global Marine Chartplotter Market, by Region, 2020β2027
Table 2 North America: Marine Chartplotter Market, by Country, 2020β2027
Table 3 Europe: Marine Chartplotter Market, by Country, 2020β2027
Table 4 Asia Pacific: Marine Chartplotter Market, by Country, 2020β2027
Table 5 Middle East & Africa: Marine Chartplotter Market, by Country, 2020β2027
Table 6 Latin America: Marine Chartplotter Market, by Country, 2020β2027
Table 7 Global Marine Chartplotter Market, by Region, 2020β2027
Table 8 Global Marine Chartplotter Market, by Component, 2020β2027
Table 9 Global Marine Chartplotter Market, by Application, 2020β2027
Table 10 Global Marine Chartplotter Market, by End Use, 2020β2027
Table 11 North America: Marine Chartplotter Market, by Country, 2020β2027
Table 12 North America: Marine Chartplotter Market, by Component, 2020β2027
Table 13 North America: Marine Chartplotter Market, by Application, 2020β2027
Table 14 North America: Marine Chartplotter Market, by End Use, 2020β2027
Table 15 Europe: Marine Chartplotter Market, by Country, 2020β2027
Table 16 Europe: Marine Chartplotter Market, by Component, 2020β2027
Table 17 Europe: Marine Chartplotter Market, by Application, 2020β2027
Table 18 Europe: Marine Chartplotter Market, by End Use, 2020β2027
Table 19 Asia-Pacific: Marine Chartplotter Market, by Country, 2020β2027
Table 20 Asia-Pacific: Marine Chartplotter Market, by Component, 2020β2027
Table 21 Asia-Pacific: Marine Chartplotter Market, by Application, 2020β2027
Table 22 Asia-Pacific: Marine Chartplotter Market, by End Use, 2020β2027
Table 23 Middle East & Africa: Marine Chartplotter Market, by Region, 2020β2027
Table 24 Middle East & Africa: Marine Chartplotter Market, by Component, 2020β2027
Table 25 Middle East & Africa: Marine Chartplotter Market, by Application, 2020β2027
Table 26 Middle East & Africa: Marine Chartplotter Market, by End Use, 2020β2027
Table 27 Latin America: Marine Chartplotter Market, by Region, 2020β2027
Table 28 Latin America: Marine Chartplotter Market, by Component, 2020β2027
Table 29 Latin America: Marine Chartplotter Market, by Application, 2020β2027
Table 30 Latin America: Marine Chartplotter Market, by End Use, 2020β2027
β
List of Figures
FIGURE 1 Research Process of MRFR
FIGURE 2 Top-Down & Bottom-Up Approaches
FIGURE 3 Market Dynamics
FIGURE 4 Impact Analysis: Market Drivers
FIGURE 5 Impact Analysis: Market Restraints
FIGURE 6 Porter's Five Forces Analysis
FIGURE 7 Value Chain Analysis
FIGURE 8 Global Marine Chartplotter Market Share, by Component, 2020 (%)
FIGURE 9 Global Marine Chartplotter Market, by Component, 2020β2027 (USD Million)
FIGURE 10 Global Marine Chartplotter Market Share, by Application, 2020 (%)
FIGURE 11 Global Marine Chartplotter Market, by Application, 2020β2027 (USD Million)
FIGURE 12 Global Marine Chartplotter Market Share, by End Use, 2020 (%)
FIGURE 13 Global Marine Chartplotter Market, by End Use, 2020β2027 (USD Million)
FIGURE 14 Global Marine Chartplotter Market Share (%), by Region, 2020
FIGURE 15 Global Marine Chartplotter Market, by Region, 2020β2027 (USD Million)
FIGURE 16 North America: Marine Chartplotter Market Share (%), 2020
FIGURE 17 North America: Marine Chartplotter Market, by Country, 2020β2027 (USD Million)
FIGURE 18 Europe: Marine Chartplotter Market Share (%), 2020
FIGURE 19 Europe: Marine Chartplotter Market, by Country, 2020β2027 (USD Million)
FIGURE 20 Asia-Pacific: Marine Chartplotter Market Share (%), 2020
FIGURE 21 Asia-Pacific: Marine Chartplotter Market, by Country, 2020β2027 (USD Million)
FIGURE 22 Middle East & Africa: Marine Chartplotter Market Share (%), 2020
FIGURE 23 Middle East & Africa: Marine Chartplotter Market, by Region, 2020β2027 (USD Million)
FIGURE 24 Latin America: Marine Chartplotter Market Share (%), 2020
FIGURE 25 Latin America: Marine Chartplotter Market, by Region, 2020β2027 (USD Million)
$1145 Million
7%
North American
2020-2030
Market Scenario
A chartplotter is a device that that uses global positioning system (GPS) to show a location on a map. This device is pre-installed with maps. Chartplotters are largely used in boats to assess the location of a vessel with and the surrounding environment of the boat to warn the operator of any underwater debris. The device shows real-time data such as the speed and direction of a vessel and calculates the voyage time.
Boat owners can preload navigation routes on the chartplotters and edit them anytime during the voyage. Chartplotters can store several routes for future use. Each route has multiple waypoints to avoid hazards such as reefs and shallow rocks. These obstacles are visually represented on maps using latitude and longitude references. The device warns the user if the boat strays off course.
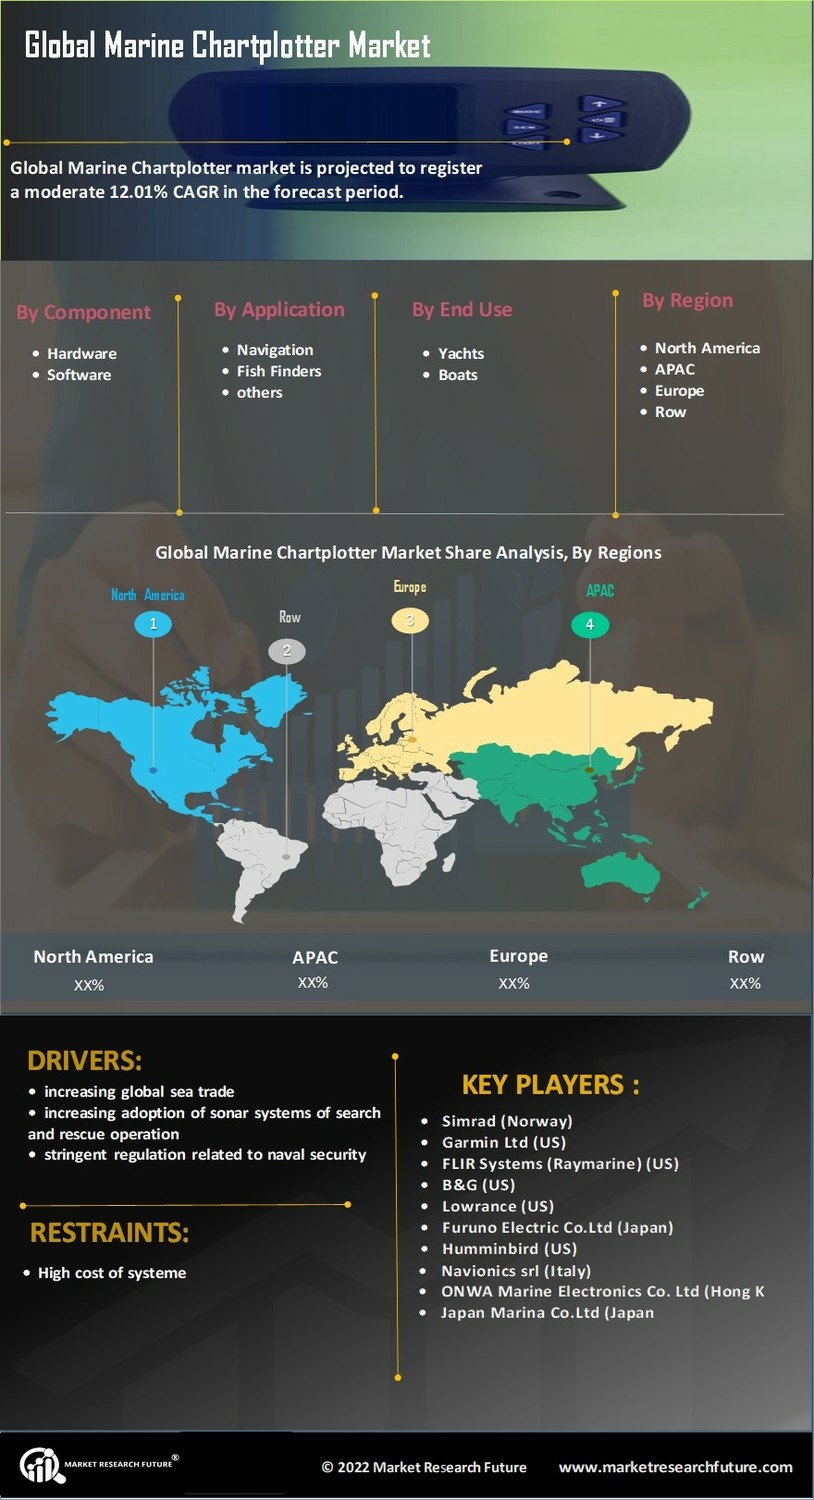
The global marine chartplotter market is anticipated to witness significant growth during the forecast period owing to the increase in global sea trade and stringent regulations regarding maritime security. Furthermore, growing adoption of sonar systems for search and rescue operations and rising use of anti-submarine warfare systems are expected to fuel the demand for marine chartplotters across the globe.
Segmentation of the Global Marine Chartplotter Market
On the basis of component, the global marine chartplotters market has been segmented into hardware and software. The software segment is expected to register the higher CAGR during the forecast period. Continuous improvements in chartplotter functions through software updates are expected to drive the growth of the segmental during the forecast period. Furthermore, regular software updates enable chartplotter manufacturers to add new navigation features and maps that can be downloaded by the user using the Internet.
Based on application, the market has been divided into navigation, fish finders, and others. The fish finders segment is expected to register the highest CAGR during the forecast period. The fish finder is a function in the chartplotters that uses the sonar technology to locate fish underwater. The fish finder function is gaining popularity in chartplotters, which, in turn, is driving the growth of the segment.
In terms of end user, the global marine chartplotter market has been classified as yachts and boats. The yachts segment is expected to register the higher CAGR during the forecast period due to increasing demand for the upgrade of yachts. Furthermore, multiple functionalities offered by chartplotters are expected to increase their use in yachts for navigation and security purposes.
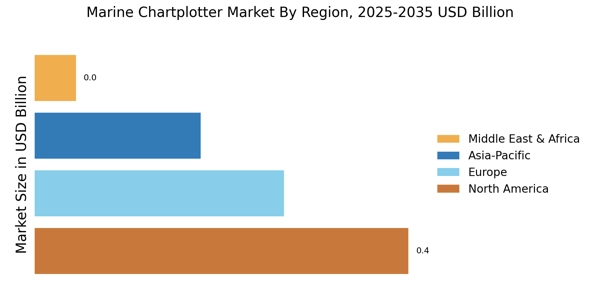
Based on region, the global marine chartplotter market has been categorized as North America, Europe, Asia-Pacific, Middle East & Africa, and Latin America. The North American market is projected to register the highest CAGR owing to the growing demand for personal yachts in the region. Furthermore, increase in per capita disposible income in countries such as the US enables the purchasing of yachts, which, in turn, is expected to boost the regional market growth during the forecast period. High investments in military and defense are expected to fuel the demand for marine chartplotters in the region.
Key Players
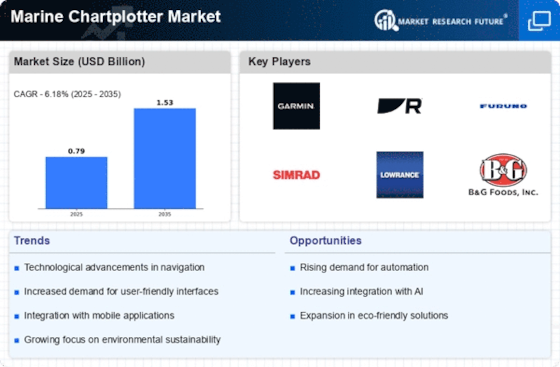
The key players in the global marine chartplotter market include Simrad (Norway), Garmin Ltd (US), FLIR Systems (Raymarine) (US), B&G (US), Lowrance (US), Furuno Electric Co., Ltd (Japan), Humminbird (US), Navionics srl (Italy), ONWA Marine Electronics Co. Ltd (Hong Kong), and Japan Marina Co., Ltd (Japan).
Research Methodology
The market values and forecast are derived using the MRFR research methodology, which includes secondary research, primary interviews, data triangulation and validation from an in-house data repository, and statistical modeling tools.
Secondary Research
In this process, data is collected from various secondary sources, including annual reports, SEC filings, journals, government associations, aerospace & defense magazines, white papers, corporate presentations, company websites, and paid databases.
Primary Research
In this process, both the demand- and supply-side parties are interviewed to extract facts and insights into the market forecast, production, trends, and projected market growth. Industry stakeholders such as CEOs, VPs, directors, and marketing executives across the value chain are approached to obtain key information.
Key Insights
Intended Audience
Frequently Asked Questions (FAQ) :
Global Marine Chartplotter market is projected to register a moderate 12.01% CAGR in the forecast period.
The hardware segment is expected to secure the highest CAGR.
The boats segment is slated to expand as the fastest-growing segment.
APAC, driven by its high navel investments is slated to drive the global market over the review period consequently.
A few eminent market players operating in the global Marine Chartplotter market Lowrance (US), Garmin Ltd (US), Simrad (Norway), are among others.