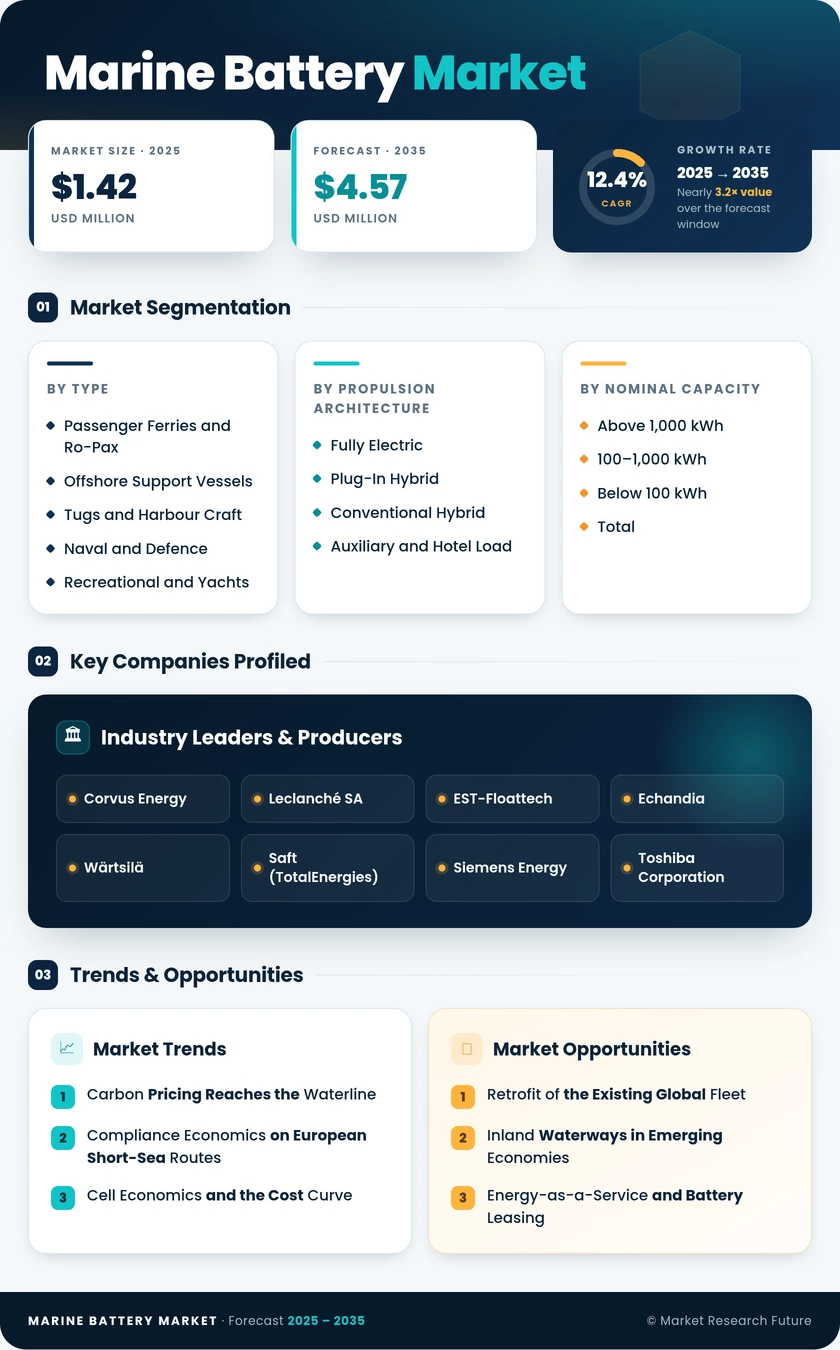
Marine Battery Market (2026 - 2035)

ID: MRFR/AD/8052-HCR 128 Pages Abbas Raut Last Updated: September 15, 2026
Marine Battery Market Size, Share, Industry Trend & Analysis Research Report: By Battery Type (Lithium Iron Phosphate, Nickel Manganese Cobalt, Advanced Lead-Acid, Nickel-Based and Other), By Vessel Type (Passenger Ferries and Ro-Pax, Offshore Support Vessels, Tugs and Harbour Craft, Naval and Defence, Recreational and Yachts, Cargo and Others), By Propulsion Architecture (Fully Electric, Plug-In Hybrid, Conventional Hybrid, Auxiliary and Hotel Load), By Nominal Capacity (Above 1,000 kWh, 100–1,000 kWh, Below 100 kWh), By Region (Europe, Asia-Pacific, North America, South America, Middle East & Africa) - Forecast to 2035.
Marine Battery Market
Market Size
Forecast Period2026-2035
CAGR (2026-2035)12.4%
2025 Market SizeUSD 1.42 Billion
2035 Market SizeUSD 4.57 Billion
Key Players
Corvus Energy
Leclanché SA
EST-Floattech
Echandia
Wärtsilä
Saft
Opportunities
  • Retrofit of the Existing Global Fleet
  • Inland Waterways in Emerging Economies
  • Energy-as-a-Service and Battery Leasing
  1. 1 Market Overview |
    1. 1.1 Study Assumptions & Market Definition |
    2. 1.2 Scope of the Study |
    3. 1.3 Research Methodology
  2. 2 Market Summary & Key Report Takeaways |
    1. 2.1 Takeaways by Technology |
    2. 2.2 Takeaways by Sector |
    3. 2.3 Takeaways by Geography
  3. 3 Global Market Size & Forecast (2021–2035) |
    1. 3.1 Historical Market Size (2021–2025) |
    2. 3.2 Current & Forecast Market Size (2026–2035) |
    3. 3.3 Market Size by Revenue (USD Billion) |
    4. 3.4 Year-over-Year Growth Analysis
  4. 4 Market Drivers Analysis |
    1. 4.1 Carbon Pricing Reaches the Waterline |
    2. 4.2 Compliance Economics on European Short-Sea Routes |
    3. 4.3 Cell Economics and the Cost Curve |
    4. 4.4 Public Funding for Fleet Renewal
  5. 5 Market Restraints Analysis |
    1. 5.1 The Capital Cost Barrier |
    2. 5.2 Charging Infrastructure Lags Vessel Orders |
    3. 5.3 Safety Certification and Insurance Friction
  6. 6 Market Opportunity Analysis |
    1. 6.1 Retrofit of the Existing Global Fleet |
    2. 6.2 Inland Waterways in Emerging Economies |
    3. 6.3 Energy-as-a-Service and Battery Leasing |
    4. 6.4 Operational Data Monetisation |
    5. 6.5 Second-Life and Recycling Streams |
    6. 6.6 Industry Value Chain Analysis |
    7. 6.7 Porter's Five Forces Analysis
  7. 7 Regional Analysis |
    1. 7.1 Europe | |
      1. 7.1.1 Norway | |
      2. 7.1.2 Netherlands | |
      3. 7.1.3 Germany | |
      4. 7.1.4 Denmark | |
      5. 7.1.5 France | |
      6. 7.1.6 Rest of Europe |
    2. 7.2 Asia-Pacific | |
      1. 7.2.1 China | |
      2. 7.2.2 South Korea | |
      3. 7.2.3 Japan | |
      4. 7.2.4 India | |
      5. 7.2.5 Rest of Asia-Pacific |
    3. 7.3 North America | |
      1. 7.3.1 United States | |
      2. 7.3.2 Canada | |
      3. 7.3.3 Mexico |
    4. 7.4 South America | |
      1. 7.4.1 Brazil | |
      2. 7.4.2 Chile | |
      3. 7.4.3 Argentina | |
      4. 7.4.4 Rest of South America |
    5. 7.5 Middle East & Africa | |
      1. 7.5.1 United Arab Emirates | |
      2. 7.5.2 Saudi Arabia | |
      3. 7.5.3 South Africa | |
      4. 7.5.4 Rest of Middle East & Africa
  8. 8 Future Outlook (2026–2035) |
    1. 8.1 Autonomy and Energy Management Convergence |
    2. 8.2 Electrification Supercycle in Deep-Water Shipping |
    3. 8.3 Chemistry Diversification |
    4. 8.4 Verified Emissions Reporting
  9. 9 Segmentation Analysis |
    1. 9.1 By Battery Type | |
      1. 9.1.1 Lithium Iron Phosphate | |
      2. 9.1.2 Nickel Manganese Cobalt | |
      3. 9.1.3 Advanced Lead-Acid | |
      4. 9.1.4 Nickel-Based and Other |
    2. 9.2 By Vessel Type | |
      1. 9.2.1 Passenger Ferries and Ro-Pax | |
      2. 9.2.2 Offshore Support Vessels | |
      3. 9.2.3 Tugs and Harbour Craft | |
      4. 9.2.4 Naval and Defence | |
      5. 9.2.5 Recreational and Yachts | |
      6. 9.2.6 Cargo and Others |
    3. 9.3 By Propulsion Architecture | |
      1. 9.3.1 Fully Electric | |
      2. 9.3.2 Plug-In Hybrid | |
      3. 9.3.3 Conventional Hybrid | |
      4. 9.3.4 Auxiliary and Hotel Load |
    4. 9.4 By Nominal Capacity | |
      1. 9.4.1 Above 1,000 kWh | |
      2. 9.4.2 100–1,000 kWh | |
      3. 9.4.3 Below 100 kWh
  10. 10 Competitive Landscape |
    1. 10.1 Market Share Analysis (2026) |
    2. 10.2 Competitive Benchmarking Matrix |
    3. 10.3 Company Profiles | |
      1. 10.3.1 Corvus Energy | |
      2. 10.3.2 Leclanché SA | |
      3. 10.3.3 EST-Floattech | |
      4. 10.3.4 Echandia | |
      5. 10.3.5 Wärtsilä | |
      6. 10.3.6 Saft (TotalEnergies) | |
      7. 10.3.7 Siemens Energy | |
      8. 10.3.8 Toshiba Corporation | |
      9. 10.3.9 Furukawa Battery | |
      10. 10.3.10 Exide Technologies
  11. 11 Recent Developments & News
  12. 12 Report Scope & Methodology |
    1. 12.1 Study Period & Base Year |
    2. 12.2 Data Sources & Citations |
    3. 12.3 Abbreviations
  13. 13 Detailed Sources and Citations
  14. 14 Frequently Asked Questions (FAQs)
  15. 15 LIST OF TABLES |
  16. TABLE 1 Global Marine Battery Market Size & Forecast, by Revenue (USD Billion), 2021–2035 |
  17. TABLE 2 Global Marine Battery Market – Year-over-Year Growth Analysis, 2021–2035 |
  18. TABLE 3 Driver Impact Analysis – Impact on CAGR, Geography and Timeline |
  19. TABLE 4 Restraint Impact Analysis – Drag on CAGR, Geography and Timeline |
  20. TABLE 5 Global Market Size, by Region, 2021–2035 (USD Billion) |
  21. TABLE 6 Europe Market Size, by Country, 2021–2035 (USD Billion) |
  22. TABLE 7 Asia-Pacific Market Size, by Country, 2021–2035 (USD Billion) |
  23. TABLE 8 North America Market Size, by Country, 2021–2035 (USD Billion) |
  24. TABLE 9 South America Market Size, by Country, 2021–2035 (USD Billion) |
  25. TABLE 10 Middle East & Africa Market Size, by Country, 2021–2035 (USD Billion) |
  26. TABLE 11 Global Market Size, by Battery Type, 2021–2035 (USD Billion) |
  27. TABLE 12 Global Market Size, by Vessel Type, 2021–2035 (USD Billion) |
  28. TABLE 13 Global Market Size, by Propulsion Architecture, 2021–2035 (USD Billion) |
  29. TABLE 14 Global Market Size, by Nominal Capacity, 2021–2035 (USD Billion) |
  30. TABLE 15 Europe Market Size, by Battery Type, 2021–2035 (USD Billion) |
  31. TABLE 16 Europe Market Size, by Vessel Type, 2021–2035 (USD Billion) |
  32. TABLE 17 Asia-Pacific Market Size, by Battery Type, 2021–2035 (USD Billion) |
  33. TABLE 18 Asia-Pacific Market Size, by Vessel Type, 2021–2035 (USD Billion) |
  34. TABLE 19 North America Market Size, by Battery Type, 2021–2035 (USD Billion) |
  35. TABLE 20 North America Market Size, by Vessel Type, 2021–2035 (USD Billion) |
  36. TABLE 21 South America Market Size, by Propulsion Architecture, 2021–2035 (USD Billion) |
  37. TABLE 22 Middle East & Africa Market Size, by Propulsion Architecture, 2021–2035 (USD Billion) |
  38. TABLE 23 Competitive Benchmarking Matrix – Global Marine Battery Market, 2026 |
  39. TABLE 24 Company Profiles – Key Players, Global Marine Battery Market |
  40. TABLE 25 Recent Developments & Strategic Announcements, 2023–2025 |
  41. TABLE 26 Report Scope & Methodology Summary |
  42. TABLE 27 Detailed Sources and Citations Index
  43. 16 LIST OF FIGURES |
  44. FIGURE 1 Market Dynamics – Drivers, Restraints and Opportunities Snapshot |
  45. FIGURE 2 Industry Value Chain Analysis – Cells to Certified Shipboard Systems |
  46. FIGURE 3 Porter's Five Forces Analysis |
  47. FIGURE 4 Global Market Size Trend, 2021–2035 (USD Billion) |
  48. FIGURE 5 Year-over-Year Growth Trajectory, 2022–2035 (%) |
  49. FIGURE 6 Market Share by Battery Type, 2025 vs 2035 (%) |
  50. FIGURE 7 Market Share by Vessel Type, 2025 (%) |
  51. FIGURE 8 Market Growth by Propulsion Architecture, CAGR 2026–2035 (%) |
  52. FIGURE 9 Market Share by Nominal Capacity, 2025 (%) |
  53. FIGURE 10 Regional Market Share, 2025 vs 2035 (%) |
  54. FIGURE 11 Europe Country-Level Share Distribution, 2025 (%) |
  55. FIGURE 12 Asia-Pacific Country-Level Growth Rates, 2026–2035 (%) |
  56. FIGURE 13 North America Country-Level Revenue Split, 2025 (USD Million) |
  57. FIGURE 14 Competitive Landscape – Estimated Revenue Share Bands, 2026 |
  58. FIGURE 15 Strategic Positioning Matrix – Specialist Integrators vs Diversified Groups

Segmentation Quick Reference

DimensionSub-SegmentsDominant SegmentFastest Growing Segment
By Battery TypeLithium Iron Phosphate; Nickel Manganese Cobalt; Advanced Lead-Acid; Nickel-Based and OtherLithium Iron PhosphateLithium Iron Phosphate
By Vessel TypePassenger Ferries and Ro-Pax; Offshore Support Vessels; Tugs and Harbour Craft; Naval and Defence; Recreational and Yachts; Cargo and OthersPassenger Ferries and Ro-PaxCargo and Others
By Propulsion ArchitectureFully Electric; Plug-In Hybrid; Conventional Hybrid; Auxiliary and Hotel LoadPlug-In HybridFully Electric
By Nominal CapacityAbove 1,000 kWh; 100–1,000 kWh; Below 100 kWhAbove 1,000 kWhAbove 1,000 kWh
By RegionEurope; Asia-Pacific; North America; South America; Middle East & AfricaEuropeAsia-Pacific


Market Segmentation Overview

By Battery Type

Sub-SegmentKey Trend
Lithium Iron PhosphatePreferred chemistry as class societies favour lower propagation risk and simpler enclosure design
Nickel Manganese CobaltRetained on high-speed craft and submarines where hull volume constrains system footprint
Advanced Lead-AcidSteady replacement demand in starting, emergency and auxiliary duty across the existing fleet
Nickel-Based and OtherNiche naval and legacy platforms; sodium-ion and semi-solid-state candidates entering trials


Chemistry selection has become a certification decision more than a performance one. Suppliers that standardise modules across vessel classes shorten approval cycles and win repeat yard business.

By Vessel Type

Sub-SegmentKey Trend
Passenger Ferries and Ro-PaxFixed routes and public ownership sustain the largest installed base
Offshore Support VesselsPeak-shaving on dynamic positioning delivers measurable fuel and maintenance savings
Tugs and Harbour CraftPort air-quality rules accelerate hybridisation in California, Rotterdam and Singapore
Naval and DefenceAcoustic signature reduction drives adoption on submarines and unmanned surface vessels
Recreational and YachtsSilent anchorage and hotel-load demand from premium builders
Cargo and OthersInland waterway mandates in China and India unlock the fastest incremental growth


Ferries remain the volume anchor, while inland cargo represents the steepest growth curve as Asian regulators restrict new diesel tonnage on designated routes.

By Propulsion Architecture

Sub-SegmentKey Trend
Fully ElectricExpansion tracks quayside charging availability rather than vessel technology readiness
Plug-In HybridPragmatic majority choice offering compliance flexibility without range anxiety
Conventional HybridDelivers fuel savings on routes with no shore power investment
Auxiliary and Hotel LoadLow-capex entry point for operators addressing anchorage emissions


Architecture choice reflects infrastructure reality. Owners hedge with plug-in hybrids until berth electrification catches up with fleet ambition.

By Nominal Capacity

Sub-SegmentKey Trend
Above 1,000 kWhLarge ferry and offshore propulsion systems dominate installed megawatt-hours
100–1,000 kWhWorkboat and small ferry segment benefiting from modular standardised packs
Below 100 kWhRecreational and auxiliary systems with shorter replacement cycles


Capacity distribution skews each year upward as propulsion applications displace auxiliary use cases in the installed base.

By Region

Sub-SegmentKey Trend
EuropeRegulatory leadership and dense short-sea ferry networks sustain the largest share
Asia-PacificInland waterway mandates and domestic cell manufacturing drive the fastest expansion
North AmericaState ferry replacement programmes and naval hybridisation anchor demand
South AmericaRiver passenger transport and aquaculture support vessels create early pilot demand
Middle East & AfricaTourism, government craft and port service fleets lead adoption


Regional divergence narrows over the forecast decade as global carbon pricing removes the compliance advantage European operators once faced alone.




Download PDF ×

We do not share your information with anyone. However, we may send you emails based on your report interest from time to time. You may contact us at any time to opt-out.