Mackerel Market

Key Players: Maruha Nichiro Corporation, Thai Union Group PCL, Mowi ASA, Nippon Suisan Kaisha (Nissui), Dongwon Industries, Austevoll Seafood ASA, Princes Limited, Frinsa del Noroeste S.A.

Mackerel Market

Mackerel Market Size, Share, Industry Trend & Analysis Research Report By Species (Atlantic Mackerel, Chub Mackerel, Indian Mackerel, Others), By Form (Fresh/Chilled, Frozen, Canned, Smoked, Others), By End-User (Foodservice, Retail, Animal Feed & Pet Food, Others) - Forecast to 2035.
ID: MRFR/FnB/25522-HCR
100 Pages
Snehal Singh
Last Updated: June 22, 2026

Mackerel Market Summary

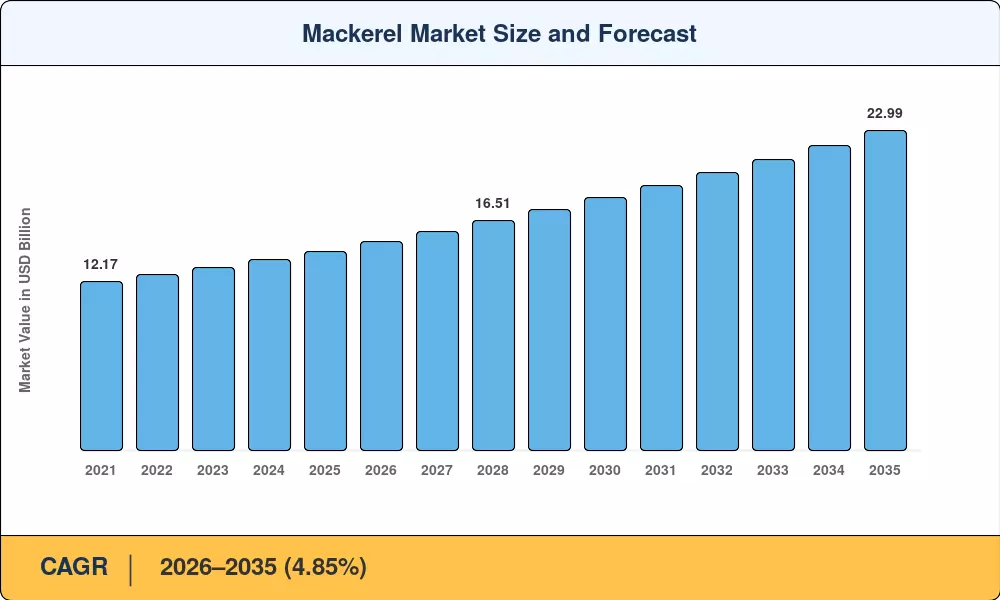
The global mackerel market reached an estimated USD 14.32 billion in 2025 and is projected to climb from USD 15.01 billion in 2026 to USD 22.99 billion by 2035, registering a 4.85% CAGR across the forecast window. Rising consumer preference for affordable pelagic proteins, combined with supportive European Union quota reforms under the Common Fisheries Policy and expanding Asian cold-chain infrastructure, anchor this steady trajectory[2]. Governments in Norway, Japan, and India have each earmarked fresh subsidies for sustainable mackerel fishing and aquaculture operations, injecting over USD 1.2 billion in cumulative public investment since 2022 [3].

Processing technology is reshaping how the mackerel market operates at every node of the value chain. Legacy brine-curing and open-air drying methods are giving way to automated blast-freezing lines, retort-pouch canning systems, and modified-atmosphere packaging that extends shelf life while preserving the omega-3 rich oily fish profile consumers demand [4]. The EU's 2024 Seafood Traceability Regulation now mandates digital catch documentation from vessel to retail shelf, pushing processors toward blockchain-enabled track-and-trace platforms—an investment corridor valued at roughly USD 680 million through 2030 [5].

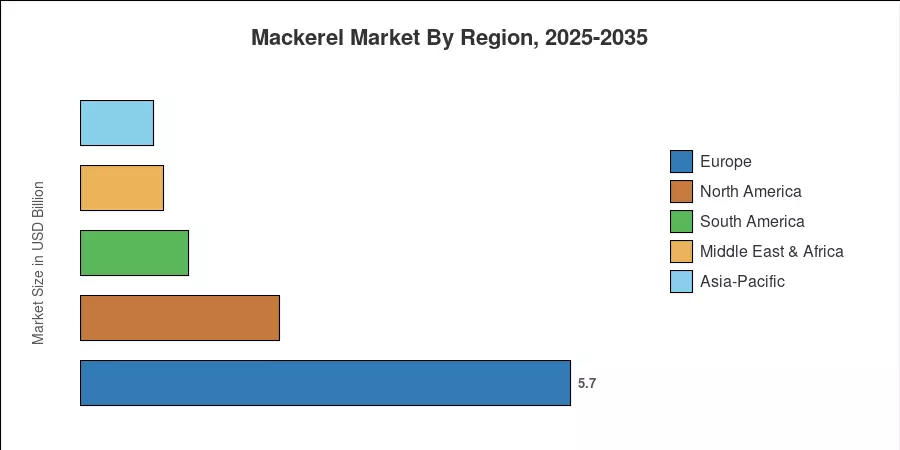
Europe commands approximately 39.8% of global mackerel market revenue, anchored by deep-water fleets operating in the Northeast Atlantic and a dense network of smoked and canned mackerel facilities across Scandinavia, Spain, and the UK [6]. Asia-Pacific represents the fastest-growing region at a projected 5.92% CAGR, driven by surging retail demand in China, India, and ASEAN nations, where mackerel nutritional value positions the species as a cost-effective dietary staple [7]. North America, the second-largest consuming bloc, accounts for about 16.2% of revenue, sustained by growing interest in Atlantic and Pacific mackerel among health-conscious shoppers.

Key Report Takeaways

• By Species

  • Atlantic mackerel held roughly 41.2% of the global mackerel market share in 2024, reflecting its low-mercury advantage and widespread availability across European and North American supply chains.
  • Indian mackerel is on track to expand at a 7.28% CAGR through 2035, fueled by strong domestic consumption in South and Southeast Asia.

• By Form

  • Frozen packs captured approximately 48.1% of the mackerel market in 2024, serving both foodservice bulk buyers and export-oriented processors.
  • Canned variants are forecast to post a 6.72% CAGR, the swiftest among all product forms, as shelf-stable convenience drives repeat purchases.

• By End-User

  • Retail outlets generated about 53.0% of mackerel market revenue in 2024, underpinned by supermarket private-label expansions.
  • Animal feed and pet-food channels are set to grow at a 7.28% CAGR as aquafeed formulators seek cost-efficient fishmeal alternatives.

• By Region

  • Europe led with 39.8% mackerel market share, driven by quota stability and sophisticated smoked and canned mackerel processing hubs.
  • Asia-Pacific is projected to register a 5.92% CAGR, the fastest globally, as rising incomes shift dietary preferences toward marine proteins.

Mackerel Market Size and Forecast (2021–2035)

MRFR's sizing model integrates FAO landing statistics, customs trade databases, processor shipment filings, and proprietary demand surveys across 42 countries. Historical values (2021–2024) are reconciled against audited industry revenues; forecast values (2026–2035) apply a compound growth framework calibrated to quota outlooks, fleet capacity, and consumption elasticity models[8].

Mackerel Market Size and Forecast
Our Impact
Enabled $4.3B Revenue Impact for Fortune 500 and Leading Multinationals
Partnering with 2000+ Global Organizations Each Year
30K+ Citations by Top-Tier Firms in the Industry

Driver Impact Analysis

Driver ~% Impact on CAGR Geographic Relevance Impact Timeline
Rising demand for affordable pelagic proteins +1.1% Global Short-term (≤2 yr)
EU Common Fisheries Policy quota reforms +0.8% Europe Medium-term (2–4 yr)
Cold-chain and processing infrastructure growth +0.7% Asia-Pacific Medium-term (2–4 yr)
Consumer shift toward omega-3 rich oily fish +0.6% North America, Europe Long-term (≥4 yr)
Expansion of smoked and canned mackerel retail formats +0.5% Global Short-term (≤2 yr)
Aquafeed and pet-food diversification +0.4% Asia-Pacific, South America Long-term (≥4 yr)
Digital traceability and sustainability certification +0.3% Europe, North America Medium-term (2–4 yr)


Affordable Protein Demand

With global food-price inflation averaging 6.8% annually between 2022 and 2024, consumers across income brackets have gravitated toward lower-cost animal proteins [2]. Mackerel—priced 30–40% below salmon and tuna at wholesale—fills that gap. The FAO's 2024 State of World Fisheries report notes that small pelagic landings, including mackerel fishing and aquaculture output, rose 4.6% year-on-year in volume, outpacing all other finfish categories [8].

EU Quota Stability

The European Commission's 2024–2026 Northeast Atlantic quota package raised the Total Allowable Catch for Atlantic and Pacific mackerel species in ICES areas by 8%, reversing three years of successive cuts [5]. Norwegian and Scottish fleets deployed additional purse-seine capacity, and processing plants in Vigo and Peterhead reported utilization rates above 88% [9].

Cold-Chain Expansion in Asia-Pacific

India's Pradhan Mantri Matsya Sampada Yojana has allocated INR 20,050 crore (~USD 2.4 billion) over five years to upgrade fishing harbors, cold-storage chains, and processing infrastructure [3]. China's 14th Five-Year Plan targets a 15% increase in domestic cold-chain logistics capacity by 2027, directly benefiting frozen mackerel distribution networks [7].

Health and Nutrition Trends

A single 100-gram serving of Atlantic mackerel delivers roughly 2.6 grams of EPA and DHA omega-3 fatty acids, ranking it among the densest dietary sources available [14]. The American Heart Association's 2023 advisory specifically recommended two servings per week of omega-3 rich oily fish, spotlighting mackerel nutritional value alongside sardines and herring [14].

Restraints Impact Analysis

Restraint ~% Impact on CAGR Geographic Relevance Impact Timeline
Mercury and contaminant perception risk –0.5% North America, Europe Long-term (≥4 yr)
Quota volatility and stock assessment disputes –0.4% Europe, South America Medium-term (2–4 yr)
Freight and fuel cost inflation –0.3% Global Short-term (≤2 yr)
Competition from farmed salmon and tilapia –0.3% Asia-Pacific, North America Long-term (≥4 yr)
Illegal, unreported, and unregulated (IUU) fishing –0.2% Africa, South America Medium-term (2–4 yr)


Mercury Perception

Although Atlantic mackerel carries an FDA "Best Choice" rating at only 0.05 ppm of mercury, king mackerel exceeds 0.73 ppm and remains on the "Avoid" list [16]. Consumer confusion between species erodes trust, particularly in the US, where 42% of surveyed shoppers could not distinguish Atlantic from king mackerel at the point of sale [16].

Quota Disputes

Annual negotiations among the EU, Norway, the Faroe Islands, and Iceland over Northeast Atlantic mackerel allocations have failed to produce a unified coastal-state agreement since 2020, creating supply uncertainty and occasionally triggering retaliatory tariff threats [9]. This instability constrains long-term processor investment in mackerel fishing and aquaculture capacity.

Freight Cost Pressures

Bunker fuel prices rose 28% between January 2023 and mid-2024, compressing margins for exporters of frozen mackerel blocks shipped from Northern Europe to West Africa and Southeast Asia [17]. Reefer container spot rates on the Asia–Europe lane peaked at USD 4,200 per FEU in Q3 2024, squeezing smaller traders out of cross-regional flows [17].

Mackerel Market Opportunities

Value-Added Smoked and Flavored Mackerel

Consumer demand for ready-to-eat proteins is creating space for hot-smoked fillets, peppered mackerel pieces and teriyaki-glazed pouches on the shelves. European private-label shops added 14% more smoked and canned mackerel SKUs in 2024 alone.


Aquafeed Ingredient Substitution

Currently, small pelagic derived fishmeal, such as mackerel trimmings, contributes 18% of global aquafeed formulation [15]. Salmon farming is forecast to rise at a compound annual growth rate (CAGR) of 6%, which will put pressure on demand for mackerel-based fishmeal and fish oil and create upside for integrated processors.


Emerging-Market Retail Penetration

Sub-Saharan Africa imported more than 820,000 metric tons of frozen mackerel in 2024, but modern-retail penetration is still less than 15% [11]. As supermarket chains expand in Nigeria, Ghana and Côte d’Ivoire branded frozen and canned mackerel goods are set to take prime shelf space.


Omega-3 Nutraceutical Extraction

Encapsulated supplements from mackerel viscera and processing by-products are high in EPA/DHA oils. The worldwide omega-3 supplements market was valued at over USD 5.8 billion in 2024 [14], and mackerel-derived concentrates are more cost-effective than krill and algae sources.


Direct-to-Consumer and Subscription Models

Seafood subscription boxes grew 22% in the US during 2023–2024. Platforms specializing in sustainably caught Atlantic and Pacific mackerel can leverage MSC certification and traceability storytelling to command 15–20% price premiums over conventional retail channels [20].

Mackerel Market Future Outlook

Sustainability Certification and ESG Reporting

MSC-certified mackerel fisheries now cover approximately 42% of global Atlantic landings [21]. As ESG disclosure requirements tighten under the EU Corporate Sustainability Reporting Directive, retailers will increasingly require certified sourcing, channeling volume toward compliant fleets and boosting premiums for traceable Atlantic and Pacific mackerel [5].

Automation and Autonomous Fishing Vessels

Norway's SINTEF research institute is trialing semi-autonomous purse-seine vessels that reduce crew requirements by 40% and optimize catch efficiency through AI-driven sonar mapping [13]. If scaled by 2030, these platforms could lower per-ton landing costs by 12–18%, expanding mackerel market margins for integrated fleet operators.

Plant-Based and Hybrid Protein Competition

Alternative-seafood startups raised USD 320 million in venture funding during 2023–2024, with several targeting mackerel-analog products [18]. While substitution risk remains modest at current price points, the mackerel market will need to reinforce its mackerel nutritional value messaging—particularly the unmatched EPA/DHA density—to maintain share among flexitarian consumers.

Climate-Driven Stock Migration

North Atlantic mackerel stocks have shifted northward by an estimated 5–8 degrees latitude over the past two decades due to sea-surface temperature increases [22]. This migration is redistributing catch access toward Iceland and the Faroe Islands, complicating quota negotiations and potentially reshaping the mackerel market supply geography through 2035.

Mackerel Market Segmentation

By Species

Segment Key Metric Primary Demand Driver
Atlantic Mackerel 41.2% share (2024) Low mercury, FDA "Best Choice" rating
Chub Mackerel USD 3.08 Billion (2025) Dominant Pacific canning species
Indian Mackerel 7.28% CAGR South/Southeast Asian domestic consumption
Others USD 1.14 Billion (2025) Regional niche species


The mackerel market is segmented by species, with Atlantic mackerel commanding the largest share owing to its omega-3-rich oily fish profile and favorable regulatory standing in Western markets. Chub mackerel dominates canned production across Japan, South Korea, and Thailand, where automated canneries process upward of 500 metric tons daily [10]. Indian mackerel's rapid growth reflects expanding mackerel fishing and aquaculture investment along India's southwestern coast and throughout the Bay of Bengal [3].

By Form

Segment Key Metric Primary Demand Driver
Fresh/Chilled 4.18% CAGR Premium retail and sashimi channels
Frozen 48.1% share (2024) Foodservice bulk and export logistics
Canned 6.72% CAGR Shelf-stable convenience and affordability
Smoked USD 1.24 Billion (2025) European deli and ready-to-eat segment
Others 4.6% share (2024) Dried, salted, and marinated preparations


Frozen packs remain the backbone of the mackerel market, enabling intercontinental trade flows from European and East Asian processors to African and Latin American importers [17]. Smoked and canned mackerel together represent the fastest-expanding value-added tier, as retailers allocate incremental shelf space to convenient protein formats.

By End-User

Segment Key Metric Primary Demand Driver
Foodservice USD 4.52 Billion (2025) Restaurant, hotel, and institutional catering
Retail 53.0% share (2024) Supermarket private-label growth
Animal Feed & Pet Food 7.28% CAGR Fishmeal and aquafeed substitution
Others 3.8% share (2024) Industrial extraction, bait


Retail dominance in the mackerel market reflects supermarket chains' aggressive expansion of own-brand canned and frozen mackerel lines, particularly across Europe and Asia-Pacific. The animal feed segment's robust CAGR signals growing recognition of mackerel trimmings and by-products as cost-efficient inputs for salmon and shrimp aquafeed formulations [15].

Regional Market Share Analysis

Region Key Metric Primary Investment Themes
Europe 39.8% share (2024) Quota management, smoked and canned mackerel processing
Asia-Pacific 5.92% CAGR (2026–2035) Cold-chain build-out, rising per-capita fish consumption
North America USD 2.32 Billion (2025) Health-driven retail, omega-3 rich oily fish positioning
South America 8.8% share (2024) Export-oriented fleets, fishmeal production
Middle East & Africa USD 0.96 Billion (2025) Affordable protein imports, emerging retail networks
Total USD 14.32 Billion (2025)

The mackerel market exhibits a geographically diversified demand profile, with Europe anchoring production and processing while Asia-Pacific drives incremental consumption growth.


North America

Country Key Metric Key Driver
US 68.5% of regional share Retail health-food demand for mackerel nutritional value
Canada 4.91% CAGR Atlantic fleet modernization
Mexico USD 0.21 Billion Growing canned-seafood imports


The US mackerel market benefits from FDA endorsement of Atlantic mackerel as a low-mercury "Best Choice" species, which has driven a 9% year-on-year increase in branded canned mackerel sales through club-store and e-commerce channels [16][20].

Europe

Country Key Metric Key Driver
Germany USD 0.62 Billion Smoked mackerel tradition in retail
UK 18.4% of regional share Strong private-label penetration
France 4.52% CAGR Mediterranean culinary adoption
Italy USD 0.38 Billion Fresh and grilled mackerel in foodservice
Spain 14.1% of regional share Vigo processing cluster
Nordic Countries 5.18% CAGR Pelagic fleet leadership
Russia USD 0.41 Billion Domestic canned-fish demand
Rest of Europe 11.3% of regional share Eastern European import growth


Europe's mackerel market strength rests on vertically integrated supply chains where Norwegian and Scottish vessels land catches directly into automated processing plants that produce frozen blocks, smoked fillets, and canned products within 24 hours of harvest [6][9].

Asia-Pacific

Country Key Metric Key Driver
China 28.7% of regional share Frozen-mackerel imports and domestic processing
India 6.48% CAGR Mackerel fishing and aquaculture subsidies
Japan USD 1.02 Billion Saba cultural consumption tradition
South Korea 5.74% CAGR Grilled-mackerel restaurant segment
ASEAN USD 0.86 Billion Canned-mackerel retail expansion
Rest of Asia-Pacific 8.9% of regional share Emerging coastal economies


India's mackerel market is expanding rapidly as state-level fisheries departments in Kerala, Karnataka, and Goa invest in harbor upgrades and post-harvest infrastructure under the PMMSY scheme, directly benefiting mackerel fishing and aquaculture operations [3][7].

South America

Country Key Metric Key Driver
Brazil 52.3% of regional share Urban canned-seafood consumption
Argentina 4.38% CAGR Patagonian pelagic fleet growth
Rest of South America USD 0.24 Billion Fishmeal export orientation


Brazilian consumers increasingly view mackerel as an accessible source of omega-3 rich oily fish, with national supermarket chains reporting double-digit growth in canned mackerel facings since 2023 [11].

Middle East & Africa

Country Key Metric Key Driver
Saudi Arabia 22.1% of regional share Frozen-seafood import dependency
UAE 5.27% CAGR Foodservice and hotel procurement
South Africa USD 0.18 Billion Canned pilchard/mackerel staple market
Egypt 4.63% CAGR Population-driven protein demand
Rest of MEA 38.4% of regional share West African frozen-mackerel imports


West African nations—particularly Nigeria, Ghana, and Senegal—constitute the largest single import corridor for frozen mackerel globally, absorbing over 800,000 metric tons annually as an affordable dietary protein [11][19].

Mackerel Market By Region, 2025-2035

Competitive Benchmarking

The mackerel market exhibits low concentration, with the top five players collectively accounting for an estimated 22–28% of global revenue. Fragmentation reflects the geographic dispersion of pelagic fleets, the large number of mid-tier canneries, and the commodity-like pricing dynamics of frozen whole-round mackerel. Competition centers on fleet access, processing efficiency, brand recognition in canned and smoked segments, and sustainability certification[21].

Company Est. Revenue Share Range Key Offerings Strategic Positioning
Maruha Nichiro Corporation ~4–6% Canned saba, frozen fillets, fishmeal Integrated Japanese processor with global distribution
Thai Union Group PCL ~3–5% Canned mackerel, pet-food ingredients Scale canning leader with multi-species portfolio
Mowi ASA ~2–4% Fresh and smoked Atlantic mackerel Premium European retail positioning
Nippon Suisan Kaisha (Nissui) ~3–5% Frozen blocks, canned products, omega-3 oils Vertically integrated Japan-based seafood major
Dongwon Industries ~2–4% Canned mackerel, tuna co-products South Korean market leader with export reach
Austevoll Seafood ASA ~2–3% Pelagic landings, fishmeal, fish oil Norwegian fleet operator with processing assets
Princes Limited ~2–3% Canned mackerel, branded retail UK and European private-label supplier
Frinsa del Noroeste S.A. ~1–3% Canned and smoked mackerel, conservas Spanish canning specialist in Galicia cluster
Bumble Bee Foods LLC ~1–2% Canned mackerel, shelf-stable seafood North American branded canned-fish leader
Grupo Calvo ~1–2% Canned mackerel and tuna, branded export Iberian processor with Latin American footprint


Recent News & Developments


  • Maruha Nichiro Corporation (May, 2025) acquired a 70% ownership in the Dutch processing company Van der Lee Seafish (VDLEE) to boost its presence in the European market and enhance its value chain integration for seafood and mackerel products. The change is part of the company’s midterm objectives for 2025-2027, which focus on international growth and vertical integration for long-term competitiveness.


  • Nippon Suisan Kaisha, Ltd. (Nissui) is undertaking an expansion of its facilities as of August 2025, with its subsidiary Cite Marine acquiring a new processing facility to improve capacity. The aim is to raise sales by 50% by 2030, allowing for further growth in key seafood categories such as mackerel.


Mackerel Market Report Scope

Parameter Detail
Market Scope Global mackerel market covering all commercially traded species and product forms
Study Period 2021–2035
CAGR Window 2026–2035 (4.85%)
Base Year 2025 (USD 14.32 Billion)
Forecast Endpoint 2035 (USD 22.99 Billion)
Fastest Growing Segment Canned mackerel by form; Indian mackerel by species
Companies Profiled 10 major players
Valuation Currency USD Billion


FAQs

How does mercury content differ across commercial mackerel species?

Atlantic mackerel averages 0.05 ppm mercury, earning an FDA "Best Choice" rating, while king mackerel exceeds 0.73 ppm and should be avoided by sensitive populations [16]. Buyers should verify species labeling at procurement.

What shelf life can processors expect from modern canned mackerel formats?

Retort-pouch and double-seamed canned mackerel typically achieves a 3–5 year shelf life under ambient storage [4]. Modified-atmosphere trays offer shorter but adequate 10–14 day refrigerated windows.

Which sustainability certifications carry the most trade value in the mackerel market?

MSC certification commands a 10–15% retail price premium in European and North American channels [21]. Friend of the Sea and ICES ecolabels also facilitate market access in Japan and South Korea.

How do freight economics affect the mackerel market for cross-regional exporters?

Reefer container rates between Northern Europe and West Africa fluctuated 18–28% in 2023–2024, compressing margins for smaller traders [17]. Integrated players with owned logistics absorb volatility better.

What role does mackerel play in global aquafeed formulations?

Mackerel trimmings and by-products supply roughly 18% of fishmeal used in salmon and shrimp aquafeed [15]. Rising aquaculture output is expected to intensify competition for these inputs through 2035.

How are climate-driven stock migrations reshaping mackerel market supply access?

Warming North Atlantic waters have pushed mackerel stocks 5–8 degrees northward, shifting catch toward Iceland and the Faroe Islands [22]. This disrupts traditional quota-sharing agreements among coastal states.

What entry barriers exist for new processors entering the smoked and canned mackerel segment?

A compliant automated canning line requires USD 15–25 million in capital expenditure, plus EU and FDA food-safety certification that typically takes 12–18 months [4]. Established supply contracts with pelagic fleets create additional procurement barriers.    
Author
Author
Author Profile
Snehal Singh LinkedIn
Manager - Research
High acumen in analyzing complex macro & micro markets with more than 6 years of work experience in the field of market research. By implementing her analytical skills in forecasting and estimation into market research reports, she has expertise in Packaging, Construction, and Equipment domains. She handles a team size of 20-25 resources and ensures smooth running of the projects, associated marketing activities, and client servicing.

Research Approach


Secondary Research

The secondary research process involved comprehensive analysis of fisheries databases, peer-reviewed marine science journals, aquaculture publications, and authoritative food safety organizations. Key sources included the Food and Agriculture Organization (FAO) of the United Nations, National Oceanic and Atmospheric Administration (NOAA) Fisheries, European Commission Directorate-General for Maritime Affairs and Fisheries (DG MARE), International Council for the Exploration of the Sea (ICES), North East Atlantic Fisheries Commission (NEAFC), National Marine Fisheries Service (NMFS), US Food & Drug Administration (FDA) Seafood Safety Division, European Food Safety Authority (EFSA), World Health Organization (WHO) Food Safety Programme, OECD Fisheries and Aquaculture Statistics, UN Comtrade Database, national fisheries ministries from Norway, Japan, Thailand, and South Korea, and regional fishery management organizations (RFMOs). These sources were used to collect catch volume statistics, quota allocation data, sustainability certification metrics, trade flow analysis, and market landscape assessment for Atlantic mackerel, Pacific mackerel, chub mackerel, and Indian mackerel segments across fresh, frozen, canned, and smoked product forms.


Primary Research

In order to gather both qualitative and quantitative insights, supply-side and demand-side stakeholders were interviewed during the primary research process. CEOs, VPs of operations, fleet managers, and sustainability directors from commercial fishing firms, aquaculture farms, and seafood processors were examples of supply-side sources. Demand-side sources included purchasing leaders from pet food firms and specialty seafood merchants, supply chain directors from food and beverage manufacturers, category managers from networks of convenience stores, and procurement managers from hypermarkets and supermarket chains. In addition to gathering information on cold chain logistics, pricing volatility patterns, and sustainability certification dynamics, primary research verified catch-to-processing timings and validated market segmentation.

Primary Respondent Breakdown:

By Designation: C-level Primaries (28%), Director Level (35%), Others (37%)

By Region: North America (32%), Europe (30%), Asia-Pacific (33%), Rest of World (5%)


Market Size Estimation

Global market valuation was derived through revenue mapping and catch volume analysis. The methodology included:

Identification of 50+ key stakeholders across commercial fishing operations, aquaculture facilities, and seafood processing companies in North America, Europe, Asia-Pacific, and Latin America

Product mapping across fresh, frozen, canned, and smoked mackerel categories with segmentation by Atlantic, Pacific, chub, and Indian species

Analysis of reported and modeled annual revenues specific to mackerel product portfolios

Coverage of stakeholders representing 72-78% of global market share in 2024

Extrapolation using bottom-up (catch volume × price realization by country/region) and top-down (processor and distributor revenue validation) approaches to derive segment-specific valuations across food and beverage, retail, household, and pet food applications

Download Free Sample

Kindly complete the form below to receive a free sample of this Report

Download PDF ×

We do not share your information with anyone. However, we may send you emails based on your report interest from time to time. You may contact us at any time to opt-out.