Segmentation Quick Reference
| Dimension | Sub-Segments | Dominant Segment | Fastest Growing Segment |
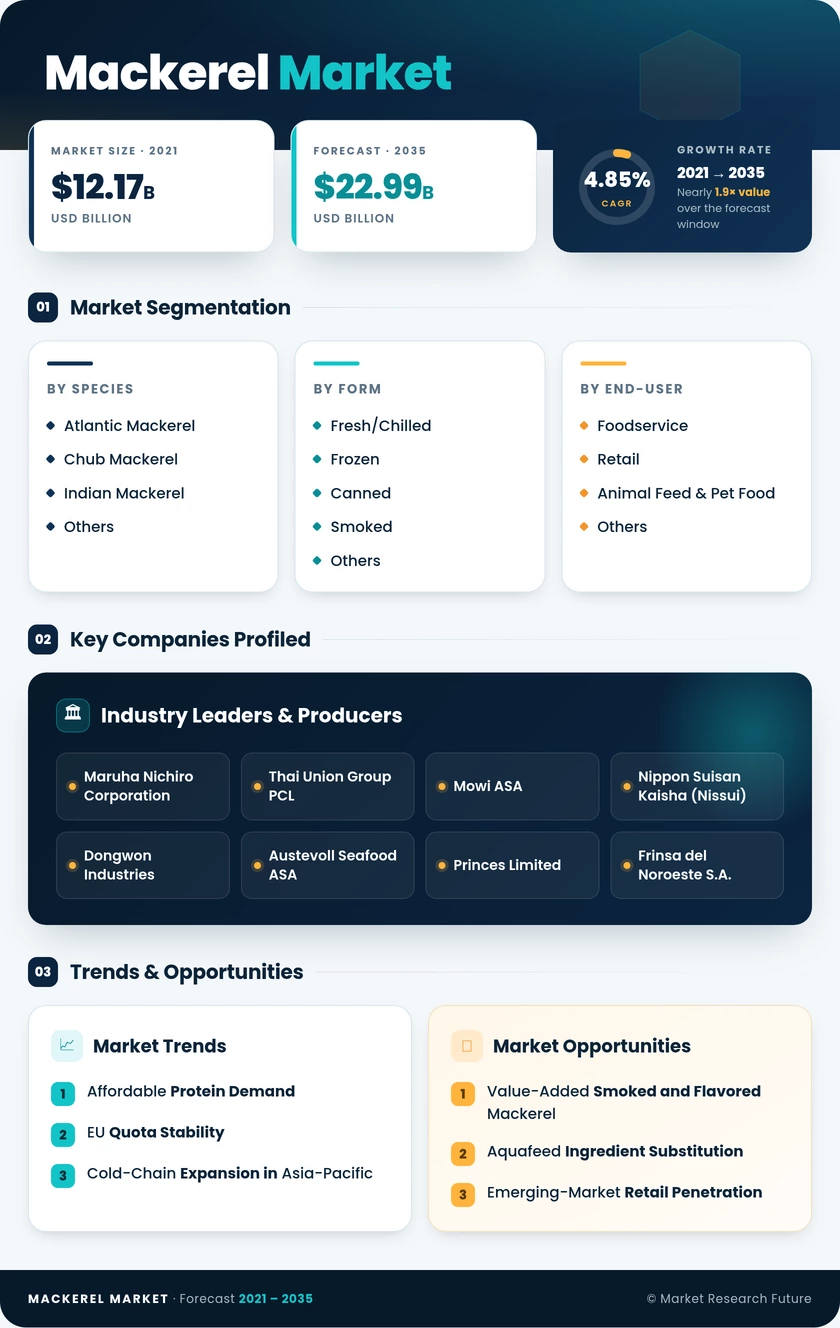
| By Species | Atlantic Mackerel, Chub Mackerel, Indian Mackerel, Others | Atlantic Mackerel (41.2% share) | Indian Mackerel (7.28% CAGR) |
| By Form | Fresh/Chilled, Frozen, Canned, Smoked, Others | Frozen (48.1% share) | Canned (6.72% CAGR) |
| By End-User | Foodservice, Retail, Animal Feed & Pet Food, Others | Retail (53.0% share) | Animal Feed & Pet Food (7.28% CAGR) |
Market Segmentation Overview
By Species
| Sub-Segment | Key Trend |
| Atlantic Mackerel | Low-mercury positioning drives premium retail and export demand across Europe and North America |
| Chub Mackerel | Dominant Pacific canning species with strong foothold in Japanese and Korean processed seafood |
| Indian Mackerel | Rapid domestic consumption growth along India's Malabar Coast and Southeast Asian wet markets |
| Others | Niche regional species including Spanish mackerel and blue mackerel serving localized markets |
Atlantic mackerel's combination of favorable mercury levels, high omega-3 density, and broad geographic availability cements its leadership position. Indian mackerel is the standout growth story, propelled by government investment in mackerel fishing and aquaculture infrastructure across South Asia.
By Form
| Sub-Segment | Key Trend |
| Fresh/Chilled | Premium channel growth in Japanese sashimi, European wet-fish counters, and upscale foodservice |
| Frozen | Backbone of intercontinental trade; bulk blocks supply processors, foodservice, and African imports |
| Canned | Fastest-growing form driven by shelf-stable convenience, affordability, and private-label expansion |
| Smoked | Strong European heritage product transitioning into ready-to-eat deli and snack formats |
| Others | Dried, salted, and marinated preparations serving traditional culinary markets |
Frozen packs will continue to dominate volume, but the highest value creation is shifting toward smoked and canned mackerel products where branding and packaging innovation command retail premiums.
By End-User
| Sub-Segment | Key Trend |
| Foodservice | Hotels, restaurants, and institutional caterers sourcing frozen fillets and whole-round mackerel |
| Retail | Supermarket and e-commerce channels expanding private-label canned and smoked mackerel ranges |
| Animal Feed & Pet Food | Fishmeal from mackerel trimmings increasingly substituted into aquafeed and premium pet-food recipes |
| Others | Industrial omega-3 extraction, bait supply, and non-food applications |
Retail's dominant revenue share reflects the global supermarket trend toward affordable, protein-rich convenience foods. Animal feed and pet food represents the most dynamic growth vector as aquaculture expansion intensifies demand for mackerel-derived fishmeal and fish oil.