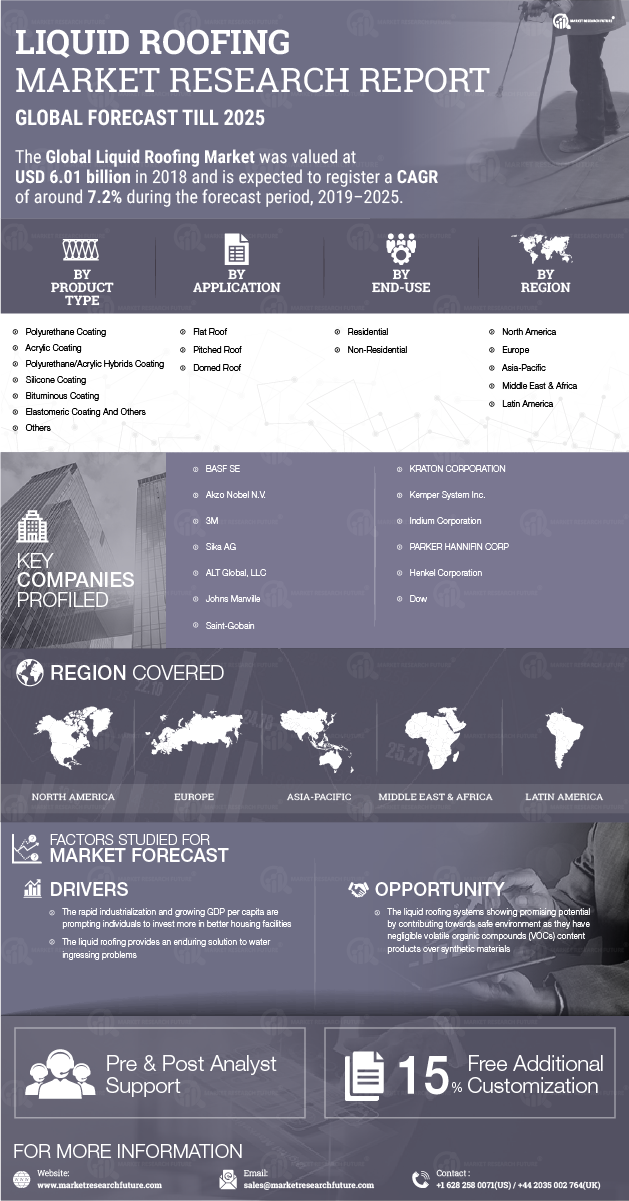
ID: MRFR/CnM/1178-CR | 223 Pages | Author: Anshula Mandaokar | February 2021
1 EXECUTIVE SUMMARY
1.1 MARKET ATTRACTIVENESS ANALYSIS 21
1.1.1 GLOBAL LIQUID ROOFING MARKET, BY TYPE 22
1.1.2 GLOBAL LIQUID ROOFING MARKET, BY APPLICATION 23
1.1.3 GLOBAL LIQUID ROOFING MARKET, BY END USE 24
1.1.4 GLOBAL LIQUID ROOFING MARKET, BY REGION 25
2 MARKET INTRODUCTION
2.1 DEFINITION 26
2.2 SCOPE OF THE STUDY 26
2.3 MARKET STRUCTURE 27
3 RESEARCH METHODOLOGY
3.1 RESEARCH PROCESS 28
3.2 PRIMARY RESEARCH 29
3.3 SECONDARY RESEARCH 30
3.4 MARKET SIZE ESTIMATION 30
3.5 TOP-DOWN AND BOTTOM-UP APPROACH 31
3.6 FORECAST MODEL 32
3.7 LIST OF ASSUMPTIONS & LIMITATIONS 33
4 MARKET DYNAMICS
4.1 INTRODUCTION 34
4.2 DRIVERS 35
4.2.1 GROWING DEMAND FOR COST-EFFICIENT AND FUNCTIONAL ROOFING SYSTEMS 35
4.2.2 INCREASED USAGE OF 2K-POLYURETHANE LIQUID ROOFING SYSTEMS 35
4.2.3 HIGH DEMAND FOR ECO-FRIENDLY AND SOLVENT-FREE COATINGS 35
4.2.4 DRIVERS IMPACT ANALYSIS 36
4.3 RESTRAINT 36
4.3.1 FLUCTUATING RAW MATERIAL PRICES 36
4.3.2 RESTRAINT IMPACT ANALYSIS 37
4.4 OPPORTUNITY 38
4.4.1 INCREASED FOCUS ON ADVANCING INFRASTRUCTURAL GROWTH 38
4.5 CHALLENGE 39
4.5.1 STRINGENT REGULATIONS 39
5 MARKET FACTOR ANALYSIS
5.1 SUPPLY CHAIN ANALYSIS 40
5.1.1 RAW MATERIAL SUPPLIERS 41
5.1.2 LIQUID ROOFING MANUFACTURERS 41
5.1.3 SALES & DISTRIBUTION CHANNEL 41
5.1.4 END USE 41
5.2 PORTER’S FIVE FORCES ANALYSIS 42
5.2.1 THREAT OF NEW ENTRANTS 42
5.2.2 RIVALRY 43
5.2.3 THREAT OF SUBSTITUTES 43
5.2.4 BARGAINING POWER OF SUPPLIERS 43
5.2.5 BARGAINING POWER OF BUYERS 43
5.3 IMPACT OF COVID-19 ON GLOBAL LIQUID ROOFING MARKET 44
5.3.1 PRODUCTION SCENARIO 44
5.3.2 IMPACT OF COVID-19 ON SUPPLY CHAIN OF LIQUID ROOFING MARKET 44
5.3.2.1.1 RAW MATERIAL SUPPLY 44
5.3.2.2 MANUFACTURING 44
5.3.2.3 SALES & DISTRIBUTION CHANNELS 44
5.3.2.4 END USERS 45
5.4 IMPACT OF COVID-19 ON THE GLOBAL ECONOMY 45
5.4.1 NUMBER OF COVID CASES TILL 8TH SEPTEMBER 2020 45
5.4.2 MAJOR GOVERNMENT POLICIES TO COUNTER THE IMPACT OF COVID-19 46
5.5 PERCENTAGE (%) OF ROOFING CHEMICALS IN OVERALL ROOFING MARKET 50
6 GLOBAL LIQUID ROOFING MARKET, BY TYPE
6.1 OVERVIEW 51
6.1.1 LIQUID ROOFING: MARKET ESTIMATES & FORECAST BY TYPE, 2023-2032 52
6.1.2 LIQUID ROOFING: MARKET ESTIMATES & FORECAST BY TYPE, 2023-2032 53
6.2 POLYURETHANE COATING 54
6.2.1 POLYURETHANE COATING: MARKET ESTIMATES & FORECAST BY REGION, 2023-2032 54
6.3 ACRYLIC COATING 55
6.3.1 ACRYLIC COATING: MARKET ESTIMATES & FORECAST BY REGION, 2023-2032 56
6.4 POLYURETHANE/ACRYLIC HYBRIDS COATING 57
6.4.1 POLYURETHANE/ACRYLIC HYBRIDS COATING: MARKET ESTIMATES & FORECAST BY REGION, 2023-2032 57
6.5 SILICONE COATING 58
6.5.1 SILICONE COATING: MARKET ESTIMATES & FORECAST BY REGION, 2023-2032 59
6.6 BITUMINOUS COATING 60
6.6.1 BITUMINOUS COATING: MARKET ESTIMATES & FORECAST BY REGION, 2023-2032 60
6.7 ELASTOMERIC COATING 61
6.7.1 ELASTOMERIC COATING: MARKET ESTIMATES & FORECAST BY REGION, 2023-2032 61
6.8 EPOXY COATINGS 62
6.8.1 EPOXY COATINGS: MARKET ESTIMATES & FORECAST BY REGION, 2023-2032 63
6.9 OTHERS 64
6.9.1 OTHERS: MARKET ESTIMATES & FORECAST BY REGION, 2023-2032 64
7 GLOBAL LIQUID ROOFING MARKET, BY APPLICATION
7.1 OVERVIEW 65
7.1.1 LIQUID ROOFING: MARKET ESTIMATES & FORECAST BY APPLICATION, 2023-2032 66
7.1.2 LIQUID ROOFING: MARKET ESTIMATES & FORECAST BY APPLICATION, 2023-2032 67
7.2 FLAT ROOF 68
7.2.1 FLAT ROOF: MARKET ESTIMATES & FORECAST BY REGION, 2023-2032 68
7.3 PITCHED ROOF 69
7.3.1 PITCHED ROOF: MARKET ESTIMATES & FORECAST BY REGION, 2023-2032 69
7.4 DOMED ROOF 70
7.4.1 DOMED ROOF: MARKET ESTIMATES & FORECAST BY REGION, 2023-2032 70
7.5 OTHERS 71
7.5.1 OTHERS: MARKET ESTIMATES & FORECAST BY REGION, 2023-2032 71
8 GLOBAL LIQUID ROOFING MARKET, BY END USE
8.1 OVERVIEW 72
8.1.1 LIQUID ROOFING: MARKET ESTIMATES & FORECAST BY END USE, 2023-2032 73
8.1.2 LIQUID ROOFING: MARKET ESTIMATES & FORECAST BY END USE, 2023-2032 74
8.2 RESIDENTIAL 75
8.2.1 RESIDENTIAL: MARKET ESTIMATES & FORECAST BY REGION, 2023-2032 75
8.2.2 RESIDENTIAL: MARKET ESTIMATES & FORECAST BY REGION, 2023-2032 76
8.3 NON-RESIDENTIAL 76
8.3.1 NON-RESIDENTIAL: MARKET ESTIMATES & FORECAST BY REGION, 2023-2032 76
8.3.2 NON-RESIDENTIAL: MARKET ESTIMATES & FORECAST BY REGION, 2023-2032 77
9 GLOBAL LIQUID ROOFING MARKET, BY REGION
9.1 OVERVIEW 78
9.2 NORTH AMERICA 81
9.2.1 US 86
9.2.2 CANADA 89
9.3 EUROPE 92
9.3.1 GERMANY 96
9.3.2 UK 99
9.3.3 RUSSIA 102
9.3.4 FRANCE 105
9.3.5 SPAIN 108
9.3.6 ITALY 111
9.3.7 REST OF EUROPE 114
9.4 ASIA-PACIFIC 117
9.4.1 CHINA 121
9.4.2 JAPAN 124
9.4.3 INDIA 127
9.4.4 SOUTH KOREA 130
9.4.5 AUSTRALIA & NEW ZEALAND 132
9.4.6 REST OF ASIA-PACIFIC 136
9.5 MIDDLE EAST & AFRICA 139
9.5.1 GCC COUNTRIES 143
9.5.2 TURKEY 146
9.5.3 SOUTH AFRICA 149
9.5.4 REST OF THE MIDDLE EAST & AFRICA 152
9.6 LATIN AMERICA 155
9.6.1 BRAZIL 160
9.6.2 MEXICO 163
9.6.3 ARGENTINA 166
9.6.4 REST OF LATIN AMERICA 169
10 COMPETITIVE LANDSCAPE
10.1 COMPETITIVE OVERVIEW 173
10.2 GLOBAL MARKET STRATEGY ANALYSIS 173
10.3 KEY DEVELOPMENTS 174
10.4 COMPETITIVE BENCHMARKING 175
11 COMPANY PROFILES
11.1 SIKA AG 176
11.1.1 COMPANY OVERVIEW 176
11.1.2 FINANCIAL OVERVIEW 176
11.1.3 PRODUCT OFFERED 177
11.1.4 KEY DEVELOPMENTS 177
11.1.5 SWOT ANALYSIS 178
11.1.6 KEY STRATEGIES 178
11.2 BASF SE 179
11.2.1 COMPANY OVERVIEW 179
11.2.2 FINANCIAL OVERVIEW 179
11.2.3 PRODUCT OFFERED 180
11.2.4 KEY DEVELOPMENTS 180
11.2.5 SWOT ANALYSIS 181
11.2.6 KEY STRATEGIES 181
11.3 DOW INC. 182
11.3.1 COMPANY OVERVIEW 182
11.3.2 FINANCIAL OVERVIEW 182
11.3.3 PRODUCT OFFERED 183
11.3.4 KEY DEVELOPMENTS 183
11.3.5 SWOT ANALYSIS 184
11.3.6 KEY STRATEGIES 184
11.4 3M 185
11.4.1 COMPANY OVERVIEW 185
11.4.2 FINANCIAL OVERVIEW 186
11.4.3 PRODUCT OFFERED 187
11.4.4 KEY DEVELOPMENTS 187
11.4.5 SWOT ANALYSIS 188
11.4.6 KEY STRATEGIES 188
11.5 SAINT-GOBAIN S.A. 189
11.5.1 COMPANY OVERVIEW 189
11.5.2 PRODUCT OFFERED 190
11.5.3 KEY DEVELOPMENTS 190
11.5.4 SWOT ANALYSIS 191
11.5.5 KEY STRATEGIES 191
11.6 HENKEL CORPORATION 192
11.6.1 COMPANY OVERVIEW 192
11.6.2 FINANCIAL OVERVIEW 192
11.6.3 PRODUCT OFFERED 193
11.6.4 KEY DEVELOPMENTS 193
11.6.5 SWOT ANALYSIS 194
11.6.6 KEY STRATEGIES 194
11.7 AKZONOBEL N.V. 195
11.7.1 COMPANY OVERVIEW 195
11.7.2 FINANCIAL OVERVIEW 196
11.7.3 PRODUCT OFFERED 197
11.7.4 KEY DEVELOPMENTS 197
11.7.5 SWOT ANALYSIS 198
11.7.6 KEY STRATEGIES 198
11.8 KRATON CORPORATION 199
11.8.1 COMPANY OVERVIEW 199
11.8.2 FINANCIAL OVERVIEW 199
11.8.3 PRODUCT OFFERED 200
11.8.4 KEY DEVELOPMENTS 200
11.8.5 SWOT ANALYSIS 200
11.8.6 KEY STRATEGIES 200
11.9 GAF MATERIALS 201
11.9.1 COMPANY OVERVIEW 201
11.9.2 FINANCIAL OVERVIEW 201
11.9.3 PRODUCT OFFERED 201
11.9.4 KEY DEVELOPMENTS 202
11.9.5 SWOT ANALYSIS 202
11.9.6 KEY STRATEGIES 202
11.10 ALT GLOBAL, LLC 203
11.10.1 COMPANY OVERVIEW 203
11.10.2 FINANCIAL OVERVIEW 203
11.10.3 PRODUCT OFFERED 203
11.10.4 KEY DEVELOPMENTS 204
11.10.5 SWOT ANALYSIS 204
11.10.6 KEY STRATEGIES 204
11.11 KEMPER SYSTEM INC. 205
11.11.1 COMPANY OVERVIEW 205
11.11.2 FINANCIAL OVERVIEW 205
11.11.3 PRODUCT OFFERED 205
11.11.4 KEY DEVELOPMENTS 205
11.11.5 SWOT ANALYSIS 206
11.11.6 KEY STRATEGIES 206
11.12 JOHNS MANVILLE 207
11.12.1 COMPANY OVERVIEW 207
11.12.2 FINANCIAL OVERVIEW 207
11.12.3 PRODUCT OFFERED 207
11.12.4 SWOT ANALYSIS 208
11.12.5 KEY STRATEGIES 208
11.13 NATIONAL COATINGS CORPORATION 209
11.13.1 COMPANY OVERVIEW 209
11.13.2 FINANCIAL OVERVIEW 209
11.13.3 PRODUCT OFFERED 209
11.13.4 SWOT ANALYSIS 210
11.13.5 KEY STRATEGIES 210
11.14 MARIS POLYMERS SA 211
11.14.1 COMPANY OVERVIEW 211
11.14.2 FINANCIAL OVERVIEW 211
11.14.3 PRODUCT OFFERED 211
11.14.4 KEY DEVELOPMENTS 211
11.14.5 SWOT ANALYSIS 212
11.14.6 KEY STRATEGIES 212
12 APPENDIX
12.1 REFERENCES 213
12.2 RELATED REPORTS 213
13 LIST OF TABLES
TABLE 1 LIST OF ASSUMPTIONS AND LIMITATIONS 33
TABLE 2 PERCENTAGE OF ROOFING CHEMICALS IN OVERALL ROOFING MARKET, BY MAJOR COUNTRIES, 2022 50
TABLE 3 LIQUID ROOFING MARKET ESTIMATES & FORECAST, BY TYPE, 2023-2032 (USD MILLION) 52
TABLE 4 LIQUID ROOFING MARKET ESTIMATES & FORECAST, BY TYPE, 2023-2032 (MILLION SQUARE METERS) 53
TABLE 5 POLYURETHANE COATING MARKET ESTIMATES & FORECAST, BY REGION, 2023-2032 (USD MILLION) 54
TABLE 6 POLYURETHANE COATING MARKET ESTIMATES & FORECAST, BY REGION, 2023-2032 (MILLION SQUARE METERS) 55
TABLE 7 ACRYLIC COATING MARKET ESTIMATES & FORECAST, BY REGION, 2023-2032 (USD MILLION) 56
TABLE 8 ACRYLIC COATING MARKET ESTIMATES & FORECAST, BY REGION, 2023-2032 (MILLION SQUARE METERS) 56
TABLE 9 POLYURETHANE/ACRYLIC HYBRIDS COATING MARKET ESTIMATES & FORECAST, BY REGION, 2023-2032 (USD MILLION) 57
TABLE 10 POLYURETHANE/ACRYLIC HYBRIDS COATING MARKET ESTIMATES & FORECAST, BY REGION, 2023-2032 (MILLION SQUARE METERS) 58
TABLE 11 SILICONE COATING MARKET ESTIMATES & FORECAST, BY REGION, 2023-2032 (USD MILLION) 59
TABLE 12 SILICONE COATING MARKET ESTIMATES & FORECAST, BY REGION, 2023-2032 (MILLION SQUARE METERS) 59
TABLE 13 BITUMINOUS COATING MARKET ESTIMATES & FORECAST, BY REGION, 2023-2032 (USD MILLION) 60
TABLE 14 BITUMINOUS COATING MARKET ESTIMATES & FORECAST, BY REGION, 2023-2032 (MILLION SQUARE METERS) 60
TABLE 15 ELASTOMERIC COATING MARKET ESTIMATES & FORECAST, BY REGION, 2023-2032 (USD MILLION) 61
TABLE 16 ELASTOMERIC COATING MARKET ESTIMATES & FORECAST, BY REGION, 2023-2032 (MILLION SQUARE METERS) 62
TABLE 17 EPOXY COATINGS MARKET ESTIMATES & FORECAST, BY REGION, 2023-2032 (USD MILLION) 63
TABLE 18 EPOXY COATINGS MARKET ESTIMATES & FORECAST, BY REGION, 2023-2032 (MILLION SQUARE METERS) 63
TABLE 19 OTHERS MARKET ESTIMATES & FORECAST, BY REGION, 2023-2032 (USD MILLION) 64
TABLE 20 OTHERS MARKET ESTIMATES & FORECAST, BY REGION, 2023-2032 (MILLION SQUARE METERS) 64
TABLE 21 LIQUID ROOFING MARKET ESTIMATES & FORECAST, BY APPLICATION, 2023-2032 (USD MILLION) 66
TABLE 22 LIQUID ROOFING MARKET ESTIMATES & FORECAST, BY APPLICATION, 2023-2032 (MILLION SQUARE METERS) 67
TABLE 23 FLAT ROOF MARKET ESTIMATES & FORECAST, BY REGION, 2023-2032 (USD MILLION) 68
TABLE 24 FLAT ROOF MARKET ESTIMATES & FORECAST, BY REGION, 2023-2032 (MILLION SQUARE METERS) 68
TABLE 25 PITCHED ROOF MARKET ESTIMATES & FORECAST, BY REGION, 2023-2032 (USD MILLION) 69
TABLE 26 PITCHED ROOF MARKET ESTIMATES & FORECAST, BY REGION, 2023-2032 (MILLION SQUARE METERS) 69
TABLE 27 DOMED ROOF MARKET ESTIMATES & FORECAST, BY REGION, 2023-2032 (USD MILLION) 70
TABLE 28 DOMED ROOF MARKET ESTIMATES & FORECAST, BY REGION, 2023-2032 (MILLION SQUARE METERS) 70
TABLE 29 OTHERS MARKET ESTIMATES & FORECAST, BY REGION, 2023-2032 (USD MILLION) 71
TABLE 30 OTHERS MARKET ESTIMATES & FORECAST, BY REGION, 2023-2032 (MILLION SQUARE METERS) 71
TABLE 31 LIQUID ROOFING MARKET ESTIMATES & FORECAST, BY END USE, 2023-2032 (USD MILLION) 73
TABLE 32 LIQUID ROOFING MARKET ESTIMATES & FORECAST, BY END USE, 2023-2032 (MILLION SQUARE METERS) 74
TABLE 33 RESIDENTIAL MARKET ESTIMATES & FORECAST, BY REGION, 2023-2032 (USD MILLION) 75
TABLE 34 RESIDENTIAL MARKET ESTIMATES & FORECAST, BY REGION, 2023-2032 (MILLION SQUARE METERS) 76
TABLE 35 NON-RESIDENTIAL MARKET ESTIMATES & FORECAST, BY REGION, 2023-2032 (USD MILLION) 76
TABLE 36 NON-RESIDENTIAL MARKET ESTIMATES & FORECAST, BY REGION, 2023-2032 (MILLION SQUARE METERS) 77
TABLE 37 GLOBAL LIQUID ROOFING MARKET, BY REGION, 2023-2032 (USD MILLION) 80
TABLE 38 LOBAL LIQUID ROOFING MARKET, BY REGION, 2023-2032 (MILLION SQUARE METERS) 81
TABLE 39 NORTH AMERICA: LIQUID ROOFING MARKET, BY COUNTRY, 2023-2032 (USD MILLION) 82
TABLE 40 NORTH AMERICA: LIQUID ROOFING MARKET, BY COUNTRY, 2023-2032 (MILLION SQUARE METERS) 82
TABLE 41 NORTH AMERICA: LIQUID ROOFING MARKET, BY TYPE, 2023-2032 (USD MILLION) 83
TABLE 42 NORTH AMERICA: LIQUID ROOFING MARKET, BY TYPE, 2023-2032 (MILLION SQUARE METERS) 83
TABLE 43 NORTH AMERICA: LIQUID ROOFING MARKET, BY APPLICATION, 2023-2032 (USD MILLION) 84
TABLE 44 NORTH AMERICA: LIQUID ROOFING MARKET, BY APPLICATION, 2023-2032 (MILLION SQUARE METERS) 84
TABLE 45 NORTH AMERICA: LIQUID ROOFING MARKET, BY END USE, 2023-2032 (USD MILLION) 85
TABLE 46 NORTH AMERICA: LIQUID ROOFING MARKET, BY END USE, 2023-2032 (MILLION SQUARE METERS) 85
TABLE 47 US: LIQUID ROOFING MARKET, BY TYPE, 2023-2032 (USD MILLION) 86
TABLE 48 US: LIQUID ROOFING MARKET, BY TYPE, 2023-2032 (MILLION SQUARE METERS) 86
TABLE 49 US: LIQUID ROOFING MARKET, BY APPLICATION, 2023-2032 (USD MILLION) 87
TABLE 50 US: LIQUID ROOFING MARKET, BY APPLICATION, 2023-2032 (MILLION SQUARE METERS) 87
TABLE 51 US: LIQUID ROOFING MARKET, BY END USE, 2023-2032 (USD MILLION) 88
TABLE 52 US: LIQUID ROOFING MARKET, BY END USE, 2023-2032 (MILLION SQUARE METERS) 88
TABLE 53 CANADA: LIQUID ROOFING MARKET, BY TYPE, 2023-2032 (USD MILLION) 89
TABLE 54 CANADA: LIQUID ROOFING MARKET, BY TYPE, 2023-2032 (MILLION SQUARE METERS) 89
TABLE 55 CANADA: LIQUID ROOFING MARKET, BY APPLICATION, 2023-2032 (USD MILLION) 90
TABLE 56 CANADA: LIQUID ROOFING MARKET, BY APPLICATION, 2023-2032 (MILLION SQUARE METERS) 90
TABLE 57 CANADA: LIQUID ROOFING MARKET, BY END USE, 2023-2032 (USD MILLION) 91
TABLE 58 CANADA: LIQUID ROOFING MARKET, BY END USE, 2023-2032 (MILLION SQUARE METERS) 91
TABLE 59 EUROPE: LIQUID ROOFING MARKET, BY COUNTRY, 2023-2032 (USD MILLION) 92
TABLE 60 EUROPE: LIQUID ROOFING MARKET, BY COUNTRY, 2023-2032 (MILLION SQUARE METERS) 93
TABLE 61 EUROPE: LIQUID ROOFING MARKET, BY TYPE, 2023-2032 (USD MILLION) 93
TABLE 62 EUROPE: LIQUID ROOFING MARKET, BY TYPE, 2023-2032 (MILLION SQUARE METERS) 94
TABLE 63 EUROPE: LIQUID ROOFING MARKET, BY APPLICATION, 2023-2032 (USD MILLION) 94
TABLE 64 EUROPE: LIQUID ROOFING MARKET, BY APPLICATION, 2023-2032 (MILLION SQUARE METERS) 95
TABLE 65 EUROPE: LIQUID ROOFING MARKET, BY END USE, 2023-2032 (USD MILLION) 95
TABLE 66 EUROPE: LIQUID ROOFING MARKET, BY END USE, 2023-2032 (MILLION SQUARE METERS) 96
TABLE 67 GERMANY: LIQUID ROOFING MARKET, BY TYPE, 2023-2032 (USD MILLION) 96
TABLE 68 GERMANY: LIQUID ROOFING MARKET, BY TYPE, 2023-2032 (MILLION SQUARE METERS) 97
TABLE 69 GERMANY: LIQUID ROOFING MARKET, BY APPLICATION, 2023-2032 (USD MILLION) 97
TABLE 70 GERMANY: LIQUID ROOFING MARKET, BY APPLICATION, 2023-2032 (MILLION SQUARE METERS) 98
TABLE 71 GERMANY: LIQUID ROOFING MARKET, BY END USE, 2023-2032 (USD MILLION) 98
TABLE 72 GERMANY: LIQUID ROOFING MARKET, BY END USE, 2023-2032 (MILLION SQUARE METERS) 99
TABLE 73 UK: LIQUID ROOFING MARKET, BY TYPE, 2023-2032 (USD MILLION) 99
TABLE 74 UK: LIQUID ROOFING MARKET, BY TYPE, 2023-2032 (MILLION SQUARE METERS) 100
TABLE 75 UK: LIQUID ROOFING MARKET, BY APPLICATION, 2023-2032 (USD MILLION) 100
TABLE 76 UK: LIQUID ROOFING MARKET, BY APPLICATION, 2023-2032 (MILLION SQUARE METERS) 101
TABLE 77 UK: LIQUID ROOFING MARKET, BY END USE, 2023-2032 (USD MILLION) 101
TABLE 78 UK: LIQUID ROOFING MARKET, BY END USE, 2023-2032 (MILLION SQUARE METERS) 102
TABLE 79 RUSSIA: LIQUID ROOFING MARKET, BY TYPE, 2023-2032 (USD MILLION) 102
TABLE 80 RUSSIA: LIQUID ROOFING MARKET, BY TYPE, 2023-2032 (MILLION SQUARE METERS) 103
TABLE 81 RUSSIA: LIQUID ROOFING MARKET, BY APPLICATION, 2023-2032 (USD MILLION) 103
TABLE 82 RUSSIA: LIQUID ROOFING MARKET, BY APPLICATION, 2023-2032 (MILLION SQUARE METERS) 104
TABLE 83 RUSSIA: LIQUID ROOFING MARKET, BY END USE, 2023-2032 (USD MILLION) 104
TABLE 84 RUSSIA: LIQUID ROOFING MARKET, BY END USE, 2023-2032 (MILLION SQUARE METERS) 105
TABLE 85 FRANCE: LIQUID ROOFING MARKET, BY TYPE, 2023-2032 (USD MILLION) 105
TABLE 86 FRANCE: LIQUID ROOFING MARKET, BY TYPE, 2023-2032 (MILLION SQUARE METERS) 106
TABLE 87 FRANCE: LIQUID ROOFING MARKET, BY APPLICATION, 2023-2032 (USD MILLION) 106
TABLE 88 FRANCE: LIQUID ROOFING MARKET, BY APPLICATION, 2023-2032 (MILLION SQUARE METERS) 107
TABLE 89 FRANCE: LIQUID ROOFING MARKET, BY END USE, 2023-2032 (USD MILLION) 107
TABLE 90 FRANCE: LIQUID ROOFING MARKET, BY END USE, 2023-2032 (MILLION SQUARE METERS) 107
TABLE 91 SPAIN: LIQUID ROOFING MARKET, BY TYPE, 2023-2032 (USD MILLION) 108
TABLE 92 SPAIN: LIQUID ROOFING MARKET, BY TYPE, 2023-2032 (MILLION SQUARE METERS) 108
TABLE 93 SPAIN: LIQUID ROOFING MARKET, BY APPLICATION, 2023-2032 (USD MILLION) 109
TABLE 94 SPAIN: LIQUID ROOFING MARKET, BY APPLICATION, 2023-2032 (MILLION SQUARE METERS) 109
TABLE 95 SPAIN: LIQUID ROOFING MARKET, BY END USE, 2023-2032 (USD MILLION) 110
TABLE 96 SPAIN: LIQUID ROOFING MARKET, BY END USE, 2023-2032 (MILLION SQUARE METERS) 110
TABLE 97 ITALY: LIQUID ROOFING MARKET, BY TYPE, 2023-2032 (USD MILLION) 111
TABLE 98 ITALY: LIQUID ROOFING MARKET, BY TYPE, 2023-2032 (MILLION SQUARE METERS) 111
TABLE 99 ITALY: LIQUID ROOFING MARKET, BY APPLICATION, 2023-2032 (USD MILLION) 112
TABLE 100 ITALY: LIQUID ROOFING MARKET, BY APPLICATION, 2023-2032 (MILLION SQUARE METERS) 112
TABLE 101 ITALY: LIQUID ROOFING MARKET, BY END USE, 2023-2032 (USD MILLION) 113
TABLE 102 ITALY: LIQUID ROOFING MARKET, BY END USE, 2023-2032 (MILLION SQUARE METERS) 113
TABLE 103 REST OF EUROPE: LIQUID ROOFING MARKET, BY TYPE, 2023-2032 (USD MILLION) 114
TABLE 104 REST OF EUROPE: LIQUID ROOFING MARKET, BY TYPE, 2023-2032 (MILLION SQUARE METERS) 114
TABLE 105 REST OF EUROPE: LIQUID ROOFING MARKET, BY APPLICATION, 2023-2032 (USD MILLION) 115
TABLE 106 REST OF EUROPE: LIQUID ROOFING MARKET, BY APPLICATION, 2023-2032 (MILLION SQUARE METERS) 115
TABLE 107 REST OF EUROPE: LIQUID ROOFING MARKET, BY END USE, 2023-2032 (USD MILLION) 116
TABLE 108 REST OF EUROPE: LIQUID ROOFING MARKET, BY END USE, 2023-2032 (MILLION SQUARE METERS) 116
TABLE 109 ASIA-PACIFIC: LIQUID ROOFING MARKET, BY COUNTRY, 2023-2032 (USD MILLION) 117
TABLE 110 ASIA-PACIFIC: LIQUID ROOFING MARKET, BY COUNTRY, 2023-2032 (MILLION SQUARE METERS) 118
TABLE 111 ASIA-PACIFIC: LIQUID ROOFING MARKET, BY TYPE, 2023-2032 (USD MILLION) 118
TABLE 112 ASIA-PACIFIC: LIQUID ROOFING MARKET, BY TYPE, 2023-2032 (MILLION SQUARE METERS) 119
TABLE 113 ASIA-PACIFIC: LIQUID ROOFING MARKET, BY APPLICATION, 2023-2032 (USD MILLION) 119
TABLE 114 ASIA-PACIFIC: LIQUID ROOFING MARKET, BY APPLICATION, 2023-2032 (MILLION SQUARE METERS) 120
TABLE 115 ASIA-PACIFIC: LIQUID ROOFING MARKET, BY END USE, 2023-2032 (USD MILLION) 120
TABLE 116 ASIA-PACIFIC: LIQUID ROOFING MARKET, BY END USE, 2023-2032 (MILLION SQUARE METERS) 121
TABLE 117 CHINA: LIQUID ROOFING MARKET, BY TYPE, 2023-2032 (USD MILLION) 121
TABLE 118 CHINA: LIQUID ROOFING MARKET, BY TYPE, 2023-2032 (MILLION SQUARE METERS) 122
TABLE 119 CHINA: LIQUID ROOFING MARKET, BY APPLICATION, 2023-2032 (USD MILLION) 122
TABLE 120 CHINA: LIQUID ROOFING MARKET, BY APPLICATION, 2023-2032 (MILLION SQUARE METERS) 123
TABLE 121 CHINA: LIQUID ROOFING MARKET, BY END USE, 2023-2032 (USD MILLION) 123
TABLE 122 CHINA: LIQUID ROOFING MARKET, BY END USE, 2023-2032 (MILLION SQUARE METERS) 123
TABLE 123 JAPAN: LIQUID ROOFING MARKET, BY TYPE, 2023-2032 (USD MILLION) 124
TABLE 124 JAPAN: LIQUID ROOFING MARKET, BY TYPE, 2023-2032 (MILLION SQUARE METERS) 124
TABLE 125 JAPAN: LIQUID ROOFING MARKET, BY APPLICATION, 2023-2032 (USD MILLION) 125
TABLE 126 JAPAN: LIQUID ROOFING MARKET, BY APPLICATION, 2023-2032 (MILLION SQUARE METERS) 125
TABLE 127 JAPAN: LIQUID ROOFING MARKET, BY END USE, 2023-2032 (USD MILLION) 126
TABLE 128 JAPAN: LIQUID ROOFING MARKET, BY END USE, 2023-2032 (MILLION SQUARE METERS) 126
TABLE 129 INDIA: LIQUID ROOFING MARKET, BY TYPE, 2023-2032 (USD MILLION) 127
TABLE 130 INDIA: LIQUID ROOFING MARKET, BY TYPE, 2023-2032 (MILLION SQUARE METERS) 127
TABLE 131 INDIA: LIQUID ROOFING MARKET, BY APPLICATION, 2023-2032 (USD MILLION) 128
TABLE 132 INDIA: LIQUID ROOFING MARKET, BY APPLICATION, 2023-2032 (MILLION SQUARE METERS) 128
TABLE 133 INDIA: LIQUID ROOFING MARKET, BY END USE, 2023-2032 (USD MILLION) 129
TABLE 134 INDIA: LIQUID ROOFING MARKET, BY END USE, 2023-2032 (MILLION SQUARE METERS) 129
TABLE 135 SOUTH KOREA: LIQUID ROOFING MARKET, BY TYPE, 2023-2032 (USD MILLION) 130
TABLE 136 SOUTH KOREA: LIQUID ROOFING MARKET, BY TYPE, 2023-2032 (MILLION SQUARE METERS) 130
TABLE 137 SOUTH KOREA: LIQUID ROOFING MARKET, BY APPLICATION, 2023-2032 (USD MILLION) 131
TABLE 138 SOUTH KOREA: LIQUID ROOFING MARKET, BY APPLICATION, 2023-2032 (MILLION SQUARE METERS) 131
TABLE 139 SOUTH KOREA: LIQUID ROOFING MARKET, BY END USE, 2023-2032 (USD MILLION) 132
TABLE 140 SOUTH KOREA: LIQUID ROOFING MARKET, BY END USE, 2023-2032 (MILLION SQUARE METERS) 132
TABLE 141 AUSTRALIA & NEW ZEALAND: LIQUID ROOFING MARKET, BY TYPE, 2023-2032 (USD MILLION) 133
TABLE 142 AUSTRALIA & NEW ZEALAND: LIQUID ROOFING MARKET, BY TYPE, 2023-2032 (MILLION SQUARE METERS) 133
TABLE 143 AUSTRALIA & NEW ZEALAND: LIQUID ROOFING MARKET, BY APPLICATION, 2023-2032 (USD MILLION) 134
TABLE 144 AUSTRALIA & NEW ZEALAND: LIQUID ROOFING MARKET, BY APPLICATION, 2023-2032 (MILLION SQUARE METERS) 134
TABLE 145 AUSTRALIA & NEW ZEALAND: LIQUID ROOFING MARKET, BY END USE, 2023-2032 (USD MILLION) 135
TABLE 146 AUSTRALIA & NEW ZEALAND: LIQUID ROOFING MARKET, BY END USE, 2023-2032 (MILLION SQUARE METERS) 135
TABLE 147 REST OF ASIA-PACIFIC: LIQUID ROOFING MARKET, BY TYPE, 2023-2032 (USD MILLION) 136
TABLE 148 REST OF ASIA-PACIFIC: LIQUID ROOFING MARKET, BY TYPE, 2023-2032 (MILLION SQUARE METERS) 136
TABLE 149 REST OF ASIA-PACIFIC: LIQUID ROOFING MARKET, BY APPLICATION, 2023-2032 (USD MILLION) 137
TABLE 150 REST OF ASIA-PACIFIC: LIQUID ROOFING MARKET, BY APPLICATION, 2023-2032 (MILLION SQUARE METERS) 137
TABLE 151 REST OF ASIA-PACIFIC: LIQUID ROOFING MARKET, BY END USE, 2023-2032 (USD MILLION) 138
TABLE 152 REST OF ASIA-PACIFIC: LIQUID ROOFING MARKET, BY END USE, 2023-2032 (MILLION SQUARE METERS) 138
TABLE 153 MIDDLE EAST & AFRICA: LIQUID ROOFING MARKET, BY COUNTRY, 2023-2032 (USD MILLION) 139
TABLE 154 MIDDLE EAST & AFRICA: LIQUID ROOFING MARKET, BY COUNTRY, 2023-2032 (MILLION SQUARE METERS) 140
TABLE 155 MIDDLE EAST & AFRICA: LIQUID ROOFING MARKET, BY TYPE, 2023-2032 (USD MILLION) 140
TABLE 156 MIDDLE EAST & AFRICA: LIQUID ROOFING MARKET, BY TYPE, 2023-2032 (MILLION SQUARE METERS) 141
TABLE 157 MIDDLE EAST & AFRICA: LIQUID ROOFING MARKET, BY APPLICATION, 2023-2032 (USD MILLION) 141
TABLE 158 MIDDLE EAST & AFRICA: LIQUID ROOFING MARKET, BY APPLICATION, 2023-2032 (MILLION SQUARE METERS) 142
TABLE 159 MIDDLE EAST & AFRICA: LIQUID ROOFING MARKET, BY END USE, 2023-2032 (USD MILLION) 142
TABLE 160 MIDDLE EAST & AFRICA: LIQUID ROOFING MARKET, BY END USE, 2023-2032 (MILLION SQUARE METERS) 143
TABLE 161 GCC COUNTRIES: LIQUID ROOFING MARKET, BY TYPE, 2023-2032 (USD MILLION) 143
TABLE 162 GCC COUNTRIES: LIQUID ROOFING MARKET, BY TYPE, 2023-2032 (MILLION SQUARE METERS) 144
TABLE 163 GCC COUNTRIES: LIQUID ROOFING MARKET, BY APPLICATION, 2023-2032 (USD MILLION) 144
TABLE 164 GCC COUNTRIES: LIQUID ROOFING MARKET, BY APPLICATION, 2023-2032 (MILLION SQUARE METERS) 145
TABLE 165 GCC COUNTRIES: LIQUID ROOFING MARKET, BY END USE, 2023-2032 (USD MILLION) 145
TABLE 166 GCC COUNTRIES: LIQUID ROOFING MARKET, BY END USE, 2023-2032 (MILLION SQUARE METERS) 146
TABLE 167 TURKEY: LIQUID ROOFING MARKET, BY TYPE, 2023-2032 (USD MILLION) 146
TABLE 168 TURKEY: LIQUID ROOFING MARKET, BY TYPE, 2023-2032 (MILLION SQUARE METERS) 147
TABLE 169 TURKEY: LIQUID ROOFING MARKET, BY APPLICATION, 2023-2032 (USD MILLION) 147
TABLE 170 TURKEY: LIQUID ROOFING MARKET, BY APPLICATION, 2023-2032 (MILLION SQUARE METERS) 148
TABLE 171 TURKEY: LIQUID ROOFING MARKET, BY END USE, 2023-2032 (USD MILLION) 148
TABLE 172 TURKEY: LIQUID ROOFING MARKET, BY END USE, 2023-2032 (MILLION SQUARE METERS) 149
TABLE 173 SOUTH AFRICA: LIQUID ROOFING MARKET, BY TYPE, 2023-2032 (USD MILLION) 149
TABLE 174 SOUTH AFRICA: LIQUID ROOFING MARKET, BY TYPE, 2023-2032 (MILLION SQUARE METERS) 150
TABLE 175 SOUTH AFRICA: LIQUID ROOFING MARKET, BY APPLICATION, 2023-2032 (USD MILLION) 150
TABLE 176 SOUTH AFRICA: LIQUID ROOFING MARKET, BY APPLICATION, 2023-2032 (MILLION SQUARE METERS) 151
TABLE 177 SOUTH AFRICA: LIQUID ROOFING MARKET, BY END USE, 2023-2032 (USD MILLION) 151
TABLE 178 SOUTH AFRICA: LIQUID ROOFING MARKET, BY END USE, 2023-2032 (MILLION SQUARE METERS) 152
TABLE 179 REST OF THE MIDDLE EAST & AFRICA: LIQUID ROOFING MARKET, BY TYPE, 2023-2032 (USD MILLION) 152
TABLE 180 REST OF THE MIDDLE EAST & AFRICA: LIQUID ROOFING MARKET, BY TYPE, 2023-2032 (MILLION SQUARE METERS) 153
TABLE 181 REST OF THE MIDDLE EAST & AFRICA: LIQUID ROOFING MARKET, BY APPLICATION, 2023-2032 (USD MILLION) 153
TABLE 182 REST OF THE MIDDLE EAST & AFRICA: LIQUID ROOFING MARKET, BY APPLICATION, 2023-2032 (MILLION SQUARE METERS) 154
TABLE 183 REST OF THE MIDDLE EAST & AFRICA: LIQUID ROOFING MARKET, BY END USE, 2023-2032 (USD MILLION) 154
TABLE 184 REST OF THE MIDDLE EAST & AFRICA: LIQUID ROOFING MARKET, BY END USE, 2023-2032 (MILLION SQUARE METERS) 155
TABLE 185 LATIN AMERICA: LIQUID ROOFING MARKET, BY COUNTRY, 2023-2032 (USD MILLION) 156
TABLE 186 LATIN AMERICA: LIQUID ROOFING MARKET, BY COUNTRY, 2023-2032 (MILLION SQUARE METERS) 156
TABLE 187 LATIN AMERICA: LIQUID ROOFING MARKET, BY TYPE, 2023-2032 (USD MILLION) 157
TABLE 188 LATIN AMERICA: LIQUID ROOFING MARKET, BY TYPE, 2023-2032 (MILLION SQUARE METERS) 157
TABLE 189 LATIN AMERICA: LIQUID ROOFING MARKET, BY APPLICATION, 2023-2032 (USD MILLION) 158
TABLE 190 LATIN AMERICA: LIQUID ROOFING MARKET, BY APPLICATION, 2023-2032 (MILLION SQUARE METERS) 158
TABLE 191 LATIN AMERICA: LIQUID ROOFING MARKET, BY END USE, 2023-2032 (USD MILLION) 159
TABLE 192 INDIA: LIQUID ROOFING MARKET, BY END USE, 2023-2032 (MILLION SQUARE METERS) 159
TABLE 193 BRAZIL: LIQUID ROOFING MARKET, BY TYPE, 2023-2032 (USD MILLION) 160
TABLE 194 BRAZIL: LIQUID ROOFING MARKET, BY TYPE, 2023-2032 (MILLION SQUARE METERS) 160
TABLE 195 BRAZIL: LIQUID ROOFING MARKET, BY APPLICATION, 2023-2032 (USD MILLION) 161
TABLE 196 BRAZIL: LIQUID ROOFING MARKET, BY APPLICATION, 2023-2032 (MILLION SQUARE METERS) 161
TABLE 197 BRAZIL: LIQUID ROOFING MARKET, BY END USE, 2023-2032 (USD MILLION) 162
TABLE 198 BRAZIL: LIQUID ROOFING MARKET, BY END USE, 2023-2032 (MILLION SQUARE METERS) 162
TABLE 199 MEXICO: LIQUID ROOFING MARKET, BY TYPE, 2023-2032 (USD MILLION) 163
TABLE 200 MEXICO: LIQUID ROOFING MARKET, BY TYPE, 2023-2032 (MILLION SQUARE METERS) 163
TABLE 201 MEXICO: LIQUID ROOFING MARKET, BY APPLICATION, 2023-2032 (USD MILLION) 164
TABLE 202 MEXICO: LIQUID ROOFING MARKET, BY APPLICATION, 2023-2032 (MILLION SQUARE METERS) 164
TABLE 203 MEXICO: LIQUID ROOFING MARKET, BY END USE, 2023-2032 (USD MILLION) 165
TABLE 204 MEXICO: LIQUID ROOFING MARKET, BY END USE, 2023-2032 (MILLION SQUARE METERS) 165
TABLE 205 ARGENTINA: LIQUID ROOFING MARKET, BY TYPE, 2023-2032 (USD MILLION) 166
TABLE 206 ARGENTINA: LIQUID ROOFING MARKET, BY TYPE, 2023-2032 (MILLION SQUARE METERS) 167
TABLE 207 ARGENTINA: LIQUID ROOFING MARKET, BY APPLICATION, 2023-2032 (USD MILLION) 167
TABLE 208 ARGENTINA: LIQUID ROOFING MARKET, BY APPLICATION, 2023-2032 (MILLION SQUARE METERS) 168
TABLE 209 ARGENTINA: LIQUID ROOFING MARKET, BY END USE, 2023-2032 (USD MILLION) 168
TABLE 210 ARGENTINA: LIQUID ROOFING MARKET, BY END USE, 2023-2032 (MILLION SQUARE METERS) 169
TABLE 211 REST OF LATIN AMERICA: LIQUID ROOFING MARKET, BY TYPE, 2023-2032 (USD MILLION) 169
TABLE 212 REST OF LATIN AMERICA: LIQUID ROOFING MARKET, BY TYPE, 2023-2032 (MILLION SQUARE METERS) 170
TABLE 213 REST OF LATIN AMERICA: LIQUID ROOFING MARKET, BY APPLICATION, 2023-2032 (USD MILLION) 170
TABLE 214 REST OF LATIN AMERICA: LIQUID ROOFING MARKET, BY APPLICATION, 2023-2032 (MILLION SQUARE METERS) 171
TABLE 215 REST OF LATIN AMERICA: LIQUID ROOFING MARKET, BY END USE, 2023-2032 (USD MILLION) 171
TABLE 216 REST OF LATIN AMERICA: LIQUID ROOFING MARKET, BY END USE, 2023-2032 (MILLION SQUARE METERS) 172
TABLE 217 KEY DEVELOPMENTS 174
TABLE 218 SIKA AG: PRODUCTS OFFERED 177
TABLE 219 SIKA AG: KEY DEVELOPMENTS 177
TABLE 220 BASF SE: PRODUCTS OFFERED 180
TABLE 221 DOW INC.: PRODUCTS OFFERED 183
TABLE 222 3M: PRODUCT OFFERED 187
TABLE 223 3M: KEY DEVELOPMENTS 187
TABLE 224 SAINT-GOBAIN S.A.: PRODUCTS OFFERED 190
TABLE 225 HENKEL CORPORATION: PRODUCTS OFFERED 193
TABLE 226 AKZO NOBEL NV: PRODUCTS OFFERED 197
TABLE 227 AKZO NOBEL NV: KEY DEVELOPMENTS 197
TABLE 228 KRATON CORPORATION: PRODUCTS OFFERED 200
TABLE 229 GAF MATERIALS: PRODUCTS OFFERED 201
TABLE 230 ALT GLOBAL, LLC: PRODUCTS OFFERED 203
TABLE 231 KEMPER SYSTEM INC.: PRODUCTS OFFERED 205
TABLE 232 KEMPER SYSTEM INC.: KEY DEVELOPMENTS 205
TABLE 233 JOHNS MANVILLE: PRODUCTS OFFERED 207
TABLE 234 JOHNS MANVILLE: KEY DEVELOPMENTS 208
TABLE 235 NATIONAL COATINGS CORPORATION: PRODUCTS OFFERED 209
TABLE 236 NATIONAL COATINGS CORPORATION: KEY DEVELOPMENTS 210
TABLE 237 MARIS POLYMERS SA: PRODUCTS OFFERED 211
TABLE 238 MARIS POLYMERS SA: KEY DEVELOPMENTS 211
14 LIST OF FIGURES
FIGURE 1 MARKET SYNOPSIS 20
FIGURE 2 MARKET ATTRACTIVENESS ANALYSIS: GLOBAL LIQUID ROOFING MARKET, 2022 21
FIGURE 3 GLOBAL LIQUID ROOFING MARKET ANALYSIS BY TYPE 22
FIGURE 4 GLOBAL LIQUID ROOFING MARKET ANALYSIS BY APPLICATION 23
FIGURE 5 GLOBAL LIQUID ROOFING MARKET ANALYSIS BY END USE 24
FIGURE 6 GLOBAL LIQUID ROOFING MARKET ANALYSIS BY REGION 25
FIGURE 7 GLOBAL LIQUID ROOFING MARKET: MARKET STRUCTURE 27
FIGURE 8 RESEARCH PROCESS OF MRFR 28
FIGURE 9 MARKET DYNAMICS OF THE GLOBAL FLUOROPOLYMERS MARKET 34
FIGURE 10 DRIVERS IMPACT ANALYSIS: LIQUID ROOFING MARKET 36
FIGURE 11 BRENT CRUDE OIL PRICES (2014–2022) 37
FIGURE 12 RESTRAINTS IMPACT ANALYSIS: GLOBAL FLUOROPOLYMERS MARKET 37
FIGURE 13 NEW RESIDENTIAL UNITS COMPLETED IN LAST 5 YEARS IN US 39
FIGURE 14 SUPPLY CHAIN ANALYSIS FOR GLOBAL LIQUID ROOFING MARKET 40
FIGURE 15 PORTER’S FIVE FORCES ANALYSIS OF THE GLOBAL LIQUID ROOFING MARKET 42
FIGURE 16 TOP 10 AFFECTED COUNTRIES, AS OF 8TH SEPTEMBER 2020 45
FIGURE 17 NEW CASES FOUND IN 10 AFFECTED COUNTRIES, AS OF 8TH SEPTEMBER 2020 46
FIGURE 18 GLOBAL LIQUID ROOFING MARKET, BY TYPE, 2022 (% SHARE) 51
FIGURE 19 GLOBAL LIQUID ROOFING MARKET, BY TYPE, 2023 TO 2032 (USD MILLION) 52
FIGURE 20 GLOBAL LIQUID ROOFING MARKET, BY TYPE, 2023 TO 2032 (MILLION SQUARE METERS) 53
FIGURE 21 GLOBAL LIQUID ROOFING MARKET, BY APPLICATION, 2022 (% SHARE) 65
FIGURE 22 GLOBAL LIQUID ROOFING MARKET, BY APPLICATION, 2023 TO 2032 (USD MILLION) 66
FIGURE 23 GLOBAL LIQUID ROOFING MARKET, BY APPLICATION, 2023 TO 2032 (MILLION SQUARE METERS) 67
FIGURE 24 GLOBAL LIQUID ROOFING MARKET, BY END USE, 2022 (% SHARE) 72
FIGURE 25 GLOBAL LIQUID ROOFING MARKET, BY END USE, 2023 TO 2032 (USD MILLION) 73
FIGURE 26 GLOBAL LIQUID ROOFING MARKET, BY END USE, 2023 TO 2032 (MILLION SQUARE METERS) 74
FIGURE 27 GLOBAL LIQUID ROOFING MARKET, BY REGION, 2022 (% SHARE) 79
FIGURE 28 GLOBAL LIQUID ROOFING MARKET, BY REGION, 2023-2032 (USD MILLION) 79
FIGURE 29 GLOBAL LIQUID ROOFING MARKET, BY REGION, 2023-2032 (MILLION SQUARE METERS) 80
FIGURE 30 NORTH AMERICA: LIQUID ROOFING MARKET SHARE, BY COUNTRY, 2022 (% SHARE) 81
FIGURE 31 EUROPE: LIQUID ROOFING MARKET SHARE, BY COUNTRY, 2022 (% SHARE) 92
FIGURE 32 ASIA-PACIFIC: LIQUID ROOFING MARKET SHARE, BY COUNTRY, 2022 (% SHARE) 117
FIGURE 33 MIDDLE EAST & AFRICA: LIQUID ROOFING MARKET SHARE, BY COUNTRY, 2022 (% SHARE) 139
FIGURE 34 LATIN AMERICA: LIQUID ROOFING MARKET SHARE, BY COUNTRY, 2022 (% SHARE) 155
FIGURE 35 MAJOR MANUFACTURER STRATEGY ANALYSIS, 2022 174
FIGURE 36 SIKA AG: FINANCIAL OVERVIEW SNAPSHOT 176
FIGURE 37 SIKA AG: SWOT ANALYSIS 178
FIGURE 38 BASF SE: FINANCIAL OVERVIEW SNAPSHOT 179
FIGURE 39 BASF SE: SWOT ANALYSIS 181
FIGURE 40 DOW INC.: FINANCIAL OVERVIEW SNAPSHOT 182
FIGURE 41 DOW INC.: SWOT ANALYSIS 184
FIGURE 42 3M: FINANCIAL OVERVIEW SNAPSHOT 186
FIGURE 43 3M: SWOT ANALYSIS 188
FIGURE 44 SAINT-GOBAIN S.A.: FINANCIAL OVERVIEW SNAPSHOT 189
FIGURE 45 SAINT-GOBAIN S.A.: SWOT ANALYSIS 191
FIGURE 46 HENKEL CORPORATION: FINANCIAL OVERVIEW SNAPSHOT 192
FIGURE 47 HENKEL CORPORATION: SWOT ANALYSIS 194
FIGURE 48 AKZO NOBEL NV: FINANCIAL OVERVIEW SNAPSHOT 196
FIGURE 49 AKZO NOBEL NV: SWOT ANALYSIS 198
FIGURE 50 KRATON CORPORATION: FINANCIAL OVERVIEW SNAPSHOT 199
FIGURE 51 KRATON CORPORATION: SWOT ANALYSIS 200
FIGURE 52 GAF MATERIALS: SWOT ANALYSIS 202
FIGURE 53 ALT GLOBAL, LLC: SWOT ANALYSIS 204
FIGURE 54 KEMPER SYSTEM INC.: SWOT ANALYSIS 206
FIGURE 55 JOHNS MANVILLE: SWOT ANALYSIS 208
FIGURE 56 NATIONAL COATINGS CORPORATION: SWOT ANALYSIS 210
FIGURE 57 MARIS POLYMERS SA: SWOT ANALYSIS 212
Liquid Roofing Type Outlook (USD Billion, 2019-2032)
Acrylic Coating
Polyurethane/Acrylic Hybrids Coating
Silicone Coating
Bituminous Coating
Elastomeric Coating
Epoxy Coatings
Others
Liquid Roofing Application Outlook (USD Billion, 2019-2032)
Flat Roof
Pitched Roof
Domed Roof
Others
Liquid Roofing End-Use Outlook (USD Billion, 2019-2032)
Residential
Non-Residential
Liquid Roofing Regional Outlook (USD Billion, 2019-2032)
North America Outlook (USD Billion, 2019-2032)
North America Liquid Roofing by Type
Acrylic Coating
Polyurethane/Acrylic Hybrids Coating
Silicone Coating
Bituminous Coating
Elastomeric Coating
Epoxy Coatings
Others
North America Liquid Roofing by Application
Flat Roof
Pitched Roof
Domed Roof
Others
North America Liquid Roofing by End-Use
Residential
Non-Residential
US Outlook (USD Billion, 2019-2032)
US Liquid Roofing by Type
Acrylic Coating
Polyurethane/Acrylic Hybrids Coating
Silicone Coating
Bituminous Coating
Elastomeric Coating
Epoxy Coatings
Others
US Liquid Roofing by Application
Flat Roof
Pitched Roof
Domed Roof
Others
US Liquid Roofing by End-Use
Residential
Non-Residential
Canada Outlook (USD Billion, 2019-2032)
Canada Liquid Roofing by Type
Acrylic Coating
Polyurethane/Acrylic Hybrids Coating
Silicone Coating
Bituminous Coating
Elastomeric Coating
Epoxy Coatings
Others
Canada Liquid Roofing by Application
Flat Roof
Pitched Roof
Domed Roof
Others
Canada Liquid Roofing by End-Use
Residential
Non-Residential
Europe Outlook (USD Billion, 2019-2032)
Europe Liquid Roofing by Type
Acrylic Coating
Polyurethane/Acrylic Hybrids Coating
Silicone Coating
Bituminous Coating
Elastomeric Coating
Epoxy Coatings
Others
Europe Liquid Roofing by Application
Flat Roof
Pitched Roof
Domed Roof
Others
Europe Liquid Roofing by End-Use
Residential
Non-Residential
Germany Outlook (USD Billion, 2019-2032)
Germany Liquid Roofing by Type
Acrylic Coating
Polyurethane/Acrylic Hybrids Coating
Silicone Coating
Bituminous Coating
Elastomeric Coating
Epoxy Coatings
Others
Germany Liquid Roofing by Application
Flat Roof
Pitched Roof
Domed Roof
Others
Germany Liquid Roofing by End-Use
Residential
Non-Residential
France Outlook (USD Billion, 2019-2032)
France Liquid Roofing by Type
Acrylic Coating
Polyurethane/Acrylic Hybrids Coating
Silicone Coating
Bituminous Coating
Elastomeric Coating
Epoxy Coatings
Others
France Liquid Roofing by Application
Flat Roof
Pitched Roof
Domed Roof
Others
France Liquid Roofing by End-Use
Residential
Non-Residential
UK Outlook (USD Billion, 2019-2032)
UK Liquid Roofing by Type
Acrylic Coating
Polyurethane/Acrylic Hybrids Coating
Silicone Coating
Bituminous Coating
Elastomeric Coating
Epoxy Coatings
Others
UK Liquid Roofing by Application
Flat Roof
Pitched Roof
Domed Roof
Others
UK Liquid Roofing by End-Use
Residential
Non-Residential
Italy Outlook (USD Billion, 2019-2032)
Italy Liquid Roofing by Type
Acrylic Coating
Polyurethane/Acrylic Hybrids Coating
Silicone Coating
Bituminous Coating
Elastomeric Coating
Epoxy Coatings
Others
Italy Liquid Roofing by Application
Flat Roof
Pitched Roof
Domed Roof
Others
Italy Liquid Roofing by End-Use
Residential
Non-Residential
Spain Outlook (USD Billion, 2019-2032)
Spain Liquid Roofing by Type
Acrylic Coating
Polyurethane/Acrylic Hybrids Coating
Silicone Coating
Bituminous Coating
Elastomeric Coating
Epoxy Coatings
Others
Spain Liquid Roofing by Application
Flat Roof
Pitched Roof
Domed Roof
Others
Spain Liquid Roofing by End-Use
Residential
Non-Residential
Rest of Europe Outlook (USD Billion, 2019-2032)
Rest of Europe Liquid Roofing by Type
Acrylic Coating
Polyurethane/Acrylic Hybrids Coating
Silicone Coating
Bituminous Coating
Elastomeric Coating
Epoxy Coatings
Others
Rest of Europe Liquid Roofing by Application
Flat Roof
Pitched Roof
Domed Roof
Others
Rest of Europe Liquid Roofing by End-Use
Residential
Non-Residential
Asia-Pacific Outlook (USD Billion, 2019-2032)
Asia-Pacific Liquid Roofing by Type
Acrylic Coating
Polyurethane/Acrylic Hybrids Coating
Silicone Coating
Bituminous Coating
Elastomeric Coating
Epoxy Coatings
Others
Asia-Pacific Liquid Roofing by Application
Flat Roof
Pitched Roof
Domed Roof
Others
Asia-Pacific Liquid Roofing by End-Use
Residential
Non-Residential
China Outlook (USD Billion, 2019-2032)
China Liquid Roofing by Type
Acrylic Coating
Polyurethane/Acrylic Hybrids Coating
Silicone Coating
Bituminous Coating
Elastomeric Coating
Epoxy Coatings
Others
China Liquid Roofing by Application
Flat Roof
Pitched Roof
Domed Roof
Others
China Liquid Roofing by End-Use
Residential
Non-Residential
Japan Outlook (USD Billion, 2019-2032)
Japan Liquid Roofing by Type
Acrylic Coating
Polyurethane/Acrylic Hybrids Coating
Silicone Coating
Bituminous Coating
Elastomeric Coating
Epoxy Coatings
Others
Japan Liquid Roofing by Application
Flat Roof
Pitched Roof
Domed Roof
Others
Japan Liquid Roofing by End-Use
Residential
Non-Residential
India Outlook (USD Billion, 2019-2032)
India Liquid Roofing by Type
Acrylic Coating
Polyurethane/Acrylic Hybrids Coating
Silicone Coating
Bituminous Coating
Elastomeric Coating
Epoxy Coatings
Others
India Liquid Roofing by Application
Flat Roof
Pitched Roof
Domed Roof
Others
India Liquid Roofing by End-Use
Residential
Non-Residential
Australia Outlook (USD Billion, 2019-2032)
Australia Liquid Roofing by Type
Acrylic Coating
Polyurethane/Acrylic Hybrids Coating
Silicone Coating
Bituminous Coating
Elastomeric Coating
Epoxy Coatings
Others
Australia Liquid Roofing by Application
Flat Roof
Pitched Roof
Domed Roof
Others
Australia Liquid Roofing by End-Use
Residential
Non-Residential
Rest of Asia-Pacific Outlook (USD Billion, 2019-2032)
Rest of Asia-Pacific Liquid Roofing by Type
Acrylic Coating
Polyurethane/Acrylic Hybrids Coating
Silicone Coating
Bituminous Coating
Elastomeric Coating
Epoxy Coatings
Others
Rest of Asia-Pacific Liquid Roofing by Application
Flat Roof
Pitched Roof
Domed Roof
Others
Rest of Asia-Pacific Liquid Roofing by End-Use
Residential
Non-Residential
Rest of the World Outlook (USD Billion, 2019-2032)
Rest of the World Liquid Roofing by Type
Acrylic Coating
Polyurethane/Acrylic Hybrids Coating
Silicone Coating
Bituminous Coating
Elastomeric Coating
Epoxy Coatings
Others
Rest of the World Liquid Roofing by Application
Flat Roof
Pitched Roof
Domed Roof
Others
Rest of the World Liquid Roofing by End-Use
Residential
Non-Residential
Middle East Outlook (USD Billion, 2019-2032)
Middle East Liquid Roofing by Type
Acrylic Coating
Polyurethane/Acrylic Hybrids Coating
Silicone Coating
Bituminous Coating
Elastomeric Coating
Epoxy Coatings
Others
Middle East Liquid Roofing by Application
Flat Roof
Pitched Roof
Domed Roof
Others
Middle East Liquid Roofing by End-Use
Residential
Non-Residential
Africa Outlook (USD Billion, 2019-2032)
Africa Liquid Roofing by Type
Acrylic Coating
Polyurethane/Acrylic Hybrids Coating
Silicone Coating
Bituminous Coating
Elastomeric Coating
Epoxy Coatings
Others
Africa Liquid Roofing by Application
Flat Roof
Pitched Roof
Domed Roof
Others
Africa Liquid Roofing by End-Use
Residential
Non-Residential
Latin America Outlook (USD Billion, 2019-2032)
Latin America Liquid Roofing by Type
Acrylic Coating
Polyurethane/Acrylic Hybrids Coating
Silicone Coating
Bituminous Coating
Elastomeric Coating
Epoxy Coatings
Others
Latin America Liquid Roofing by Application
Flat Roof
Pitched Roof
Domed Roof
Others
Latin America Liquid Roofing by End-Use
Residential
Non-Residential
Research Methodology on Liquid Roofing Market
Introduction
This research aims to evaluate the market potential of liquid roofing – an effective technique for protecting structures against degradation caused by water, UV radiation, and other harsh environmental conditions. This research methodology will outline the approach and strategies to obtain comprehensible findings through both qualitative and quantitative data analysis. Primarily, it will identify and explain the research objectives, review relevant literature, data sources and collection methods, sampling techniques, analysis framework, data analysis techniques and strategies, anticipated challenges, and ethical considerations.
Research Objectives
The primary objective of this research is to evaluate the market potential of liquid roofing based on its market drivers, challenges, upcoming trends, and competitive landscape. This study will attempt to determine the growth prospects and future scope of the market segment, as well as identify key industries that are likely to adopt liquid roofing in the near future. The secondary objective of this research is to assess the global liquid roofing market in terms of market share, size (in value and volume), average selling price (ASP), and top manufacturers and countries with maximum access to the market.
Review of Relevant Literature
The early phase of this research study will focus on a systematic review of the existing literature related to liquid roofing. During this stage, the research team will review books, research papers, magazines, whitepapers, and other published works in order to find existing knowledge, analyze previous studies on the topic, and draw connections to the existing framework of knowledge. The scope of the literature review is expected to include studies related to the technical aspects of liquid roofing, case studies, market potential reports, competitive landscape analysis, and previous market surveys and research.
Data Sources and Collection Methods
The data collection and analysis process for this research involves both primary and secondary research. Primary data will be collected through online and in-person surveys, interviews, and focus group sessions with industry experts, stakeholders, and consumers. Secondary data sources for this research comprise industry databases, press releases, reports, research papers, and trade journals. The analysis of the collected data will involve the use of both qualitative and quantitative methods to validate findings.
Sampling Techniques
This research employs a convenience sampling technique to analyze the market potential of liquid roofing. Convenience sampling is a type of sampling technique where the target population is chosen based on availability and other constraints. This method is useful in situations where the researcher has limited resources and time to collect data. It is anticipated that the sample size for this research study will be around 10-15 respondents from each region.
Analysis Framework
The data collection and analysis process for this research involves the use of a mixed-methods approach. This approach involves employing both quantitative and qualitative data analysis techniques to generate comprehensive insights. Quantitative analysis involves data analysis and interpretation techniques such as descriptive statistics, correlation analysis, multiple regression analysis, conjoint analysis, factor analysis, and hierarchical linear modelling. Qualitative analysis will include methods such as content analysis, simple triangulation, and grounded theory.
Data Analysis Techniques and Strategies
The data collected during the primary research phase will be analyzed by using both quantitative and qualitative data analysis techniques. Quantitative data analysis will involve the application of descriptive statistics, correlation analysis, multiple regression analysis, conjoint analysis, factor analysis, and hierarchical linear modelling. Qualitative data analysis techniques will include content analysis, simple triangulation, and grounded theory.
Anticipated Challenges
The primary research phase is expected to be challenging owing to the limited resources and time for data collection. In addition, obtaining accurate and up-to-date information about the liquid roofing market is likely to be difficult due to the nature of the research topic. Moreover, international market access and language barriers may also hinder data collection.
Ethical Considerations
The research team will adhere to all ethical norms and protocols throughout the research process. The team will obtain written permission from survey and interview respondents and will ensure that the personal information of respondents is kept confidential. In addition, the research team will take all necessary precautions to prevent any potential harm to survey or interview respondents or any third-party entities.
Conclusion
This research methodology has outlined the primary research objectives, literature review, data sources and collection methods, sampling techniques, and analysis framework. In addition, data analysis techniques and strategies, anticipated challenges, and ethical considerations have been discussed. This research methodology is expected to provide a comprehensive and reliable basis for evaluating the market potential of liquid roofing for the period 2023 to 2030.