Liquid Dietary Supplements Market (2026 - 2035)

ID: MRFR/FnB/9932-CR 200 Pages Snehal Singh Last Updated: October 09, 2026
Liquid Dietary Supplements Market Size, Share, Industry Trend & Analysis Research Report By Ingredient Type (Vitamins & Minerals, Botanicals/Herbals, Proteins & Amino Acids, Omega-3 & Fatty Acids, Probiotics, Others), By Application (Sports Nutrition, Immune Health, Digestive Health, Cognitive & Stress Support, Energy & Weight Management, Bone & Joint Health, Others), By End User (Adults, Geriatric Population, Pregnant Women, Children), By Distribution Channel (Supermarkets/Hypermarkets, Pharmacies, Online Retail Stores, Specialty Stores, Other Channels), By Region (North America, Europe, Asia-Pacific, South America, Middle East & Africa) - Forecast to 2035
Liquid Dietary Supplements Market
Market Size
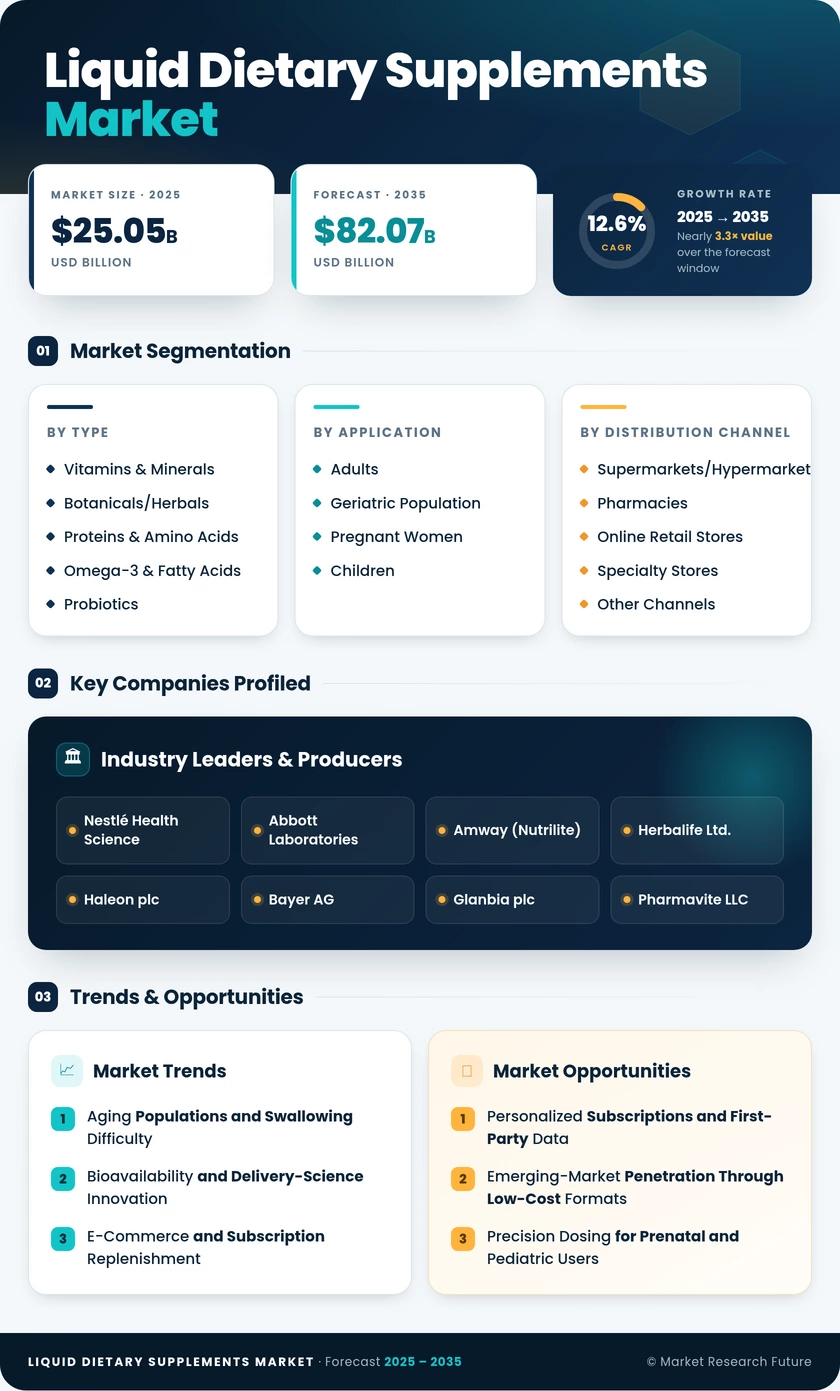
Forecast Period2026-2035
CAGR (2026-2035)12.6%
2025 Market SizeUSD 25.05 Billion
2035 Market SizeUSD 82.07 Billion
Key Players
Nestlé Health Science
Abbott Laboratories
Amway
Herbalife Ltd.
Haleon plc
Bayer AG
Opportunities
  • Personalized Subscriptions and First-Party Data
  • Emerging-Market Penetration Through Low-Cost Formats
  • Precision Dosing for Prenatal and Pediatric Users
  1. 1 Market Summary | |
  2. 2 Key Report Takeaways | |
    1. 2.1 By Ingredient Type | |
    2. 2.2 By Application | |
    3. 2.3 By End User | |
    4. 2.4 By Distribution Channel | |
    5. 2.5 By Region | |
  3. 3 Market Size and Forecast (2021–2035) | |
  4. 4 Driver Impact Analysis | |
    1. 4.1 Aging Populations and Swallowing Difficulty | |
    2. 4.2 Bioavailability and Delivery-Science Innovation | |
    3. 4.3 E-Commerce and Subscription Replenishment | |
    4. 4.4 Preventive Health and Immune Awareness | |
    5. 4.5 Sports and Active-Lifestyle RTD Formats | |
    6. 4.6 Regulatory Formalization in Asia | |
  5. 5 Restraints Impact Analysis | |
    1. 5.1 Formulation Stability and Shelf-Life Limits | |
    2. 5.2 Claims Scrutiny and Regulatory Fragmentation | |
    3. 5.3 Packaging and Logistics Cost Premium | |
    4. 5.4 Adulteration and Counterfeit Products Online | |
    5. 5.5 Sugar and Excipient Concerns | |
  6. 6 Opportunities | |
    1. 6.1 Personalized Subscriptions and First-Party Data | |
    2. 6.2 Emerging-Market Penetration Through Low-Cost Formats | |
    3. 6.3 Precision Dosing for Prenatal and Pediatric Users | |
    4. 6.4 Sustainable and Algal-Sourced Omega-3 | |
    5. 6.5 Institutional Elder-Care and Clinical Channels | |
  7. 7 Regional Market Share and Country-Level Analysis | |
    1. 7.1 North America | | |
      1. 7.1.1 US | | |
      2. 7.1.2 Canada | | |
      3. 7.1.3 Mexico | |
    2. 7.2 Europe | | |
      1. 7.2.1 Germany | | |
      2. 7.2.2 UK | | |
      3. 7.2.3 France | | |
      4. 7.2.4 Italy | | |
      5. 7.2.5 Spain | | |
      6. 7.2.6 Nordic Countries | | |
      7. 7.2.7 Russia | | |
      8. 7.2.8 Rest of Europe | |
    3. 7.3 Asia-Pacific | | |
      1. 7.3.1 China | | |
      2. 7.3.2 India | | |
      3. 7.3.3 Japan | | |
      4. 7.3.4 South Korea | | |
      5. 7.3.5 ASEAN | | |
      6. 7.3.6 Rest of Asia-Pacific | |
    4. 7.4 South America | | |
      1. 7.4.1 Brazil | | |
      2. 7.4.2 Argentina | | |
      3. 7.4.3 Rest of South America | |
    5. 7.5 Middle East & Africa | | |
      1. 7.5.1 Saudi Arabia | | |
      2. 7.5.2 UAE | | |
      3. 7.5.3 South Africa | | |
      4. 7.5.4 Egypt | | |
      5. 7.5.5 Rest of MEA | |
  8. 8 Future Outlook (2026–2035) | |
    1. 8.1 AI-Driven Personalization | |
    2. 8.2 Platform and Subscription Economics | |
    3. 8.3 Healthy-Aging Demand | |
    4. 8.4 Sustainability and Packaging Compliance | |
  9. 9 Segmentation Analysis | |
    1. 9.1 By Ingredient Type | | |
      1. 9.1.1 Vitamins & Minerals | | |
      2. 9.1.2 Botanicals/Herbals | | |
      3. 9.1.3 Proteins & Amino Acids | | |
      4. 9.1.4 Omega-3 & Fatty Acids | | |
      5. 9.1.5 Probiotics | | |
      6. 9.1.6 Others | |
    2. 9.2 By Application | | |
      1. 9.2.1 Sports Nutrition | | |
      2. 9.2.2 Immune Health | | |
      3. 9.2.3 Digestive Health | | |
      4. 9.2.4 Cognitive & Stress Support | | |
      5. 9.2.5 Energy & Weight Management | | |
      6. 9.2.6 Bone & Joint Health | | |
      7. 9.2.7 Others | |
    3. 9.3 By End User | | |
      1. 9.3.1 Adults | | |
      2. 9.3.2 Geriatric Population | | |
      3. 9.3.3 Pregnant Women | | |
      4. 9.3.4 Children | |
    4. 9.4 By Distribution Channel | | |
      1. 9.4.1 Supermarkets/Hypermarkets | | |
      2. 9.4.2 Pharmacies | | |
      3. 9.4.3 Online Retail Stores | | |
      4. 9.4.4 Specialty Stores | | |
      5. 9.4.5 Other Channels | |
  10. 10 Competitive Landscape | |
  11. 11 Recent News & Developments | |
  12. 12 Report Scope and Methodology | |
  13. 13 Detailed Sources and Citations | |
  14. 14 Frequently Asked Questions (FAQs) | | LIST OF TABLES | |
  15. TABLE 1 Report Snapshot — Key Market Parameters | |
  16. TABLE 2 Global Market Size & Forecast, by Revenue (USD Billion), 2021–2035 | |
  17. TABLE 3 Driver Impact Analysis, 2026–2035 | |
  18. TABLE 4 Restraints Impact Analysis, 2026–2035 | |
  19. TABLE 5 Regional Summary — Market Metrics and Investment Themes, 2025 | |
  20. TABLE 6 North America Market, by Country, 2025 | |
  21. TABLE 7 Europe Market, by Country, 2025 | |
  22. TABLE 8 Asia-Pacific Market, by Country, 2025 | |
  23. TABLE 9 South America Market, by Country, 2025 | |
  24. TABLE 10 Middle East & Africa Market, by Country, 2025 | |
  25. TABLE 11 Global Market, by Ingredient Type, 2025 | |
  26. TABLE 12 Global Market, by Application, 2025 | |
  27. TABLE 13 Global Market, by End User, 2025 | |
  28. TABLE 14 Global Market, by Distribution Channel, 2025 | |
  29. TABLE 15 Competitive Benchmarking Matrix, 2025 | |
  30. TABLE 16 Report Scope and Methodology | |
  31. TABLE 17 Detailed Sources and Citations | |
  32. TABLE 18 Segmentation Quick Reference | | LIST OF FIGURES | |
  33. FIGURE 1 Market Dynamics — Drivers, Restraints and Opportunities | |
  34. FIGURE 2 Industry Value Chain Analysis | |
  35. FIGURE 3 Porter's Five Forces Analysis | |
  36. FIGURE 4 Global Market Size Trend, 2021–2035 (USD Billion) | |
  37. FIGURE 5 Market Share by Ingredient Type, 2025 | |
  38. FIGURE 6 Market Share by Application, 2025 | |
  39. FIGURE 7 Market Share by End User, 2025 | |
  40. FIGURE 8 Market Share by Distribution Channel, 2025 | |
  41. FIGURE 9 Regional Market Share, 2025 | |
  42. FIGURE 10 Asia-Pacific Country Growth Comparison, 2026–2035 | |
  43. FIGURE 11 Competitive Landscape — Estimated Revenue Share Ranges, 2025 | |
  44. FIGURE 12 Top-5 Player Concentration, 2025

Segmentation Quick Reference

DimensionSub-SegmentsDominant SegmentFastest Growing Segment
By Ingredient TypeVitamins & Minerals, Botanicals/Herbals, Proteins & Amino Acids, Omega-3 & Fatty Acids, Probiotics, OthersVitamins & Minerals (29.9% share)Omega-3 & Fatty Acids (13.8% CAGR)
By ApplicationSports Nutrition, Immune Health, Digestive Health, Cognitive & Stress Support, Energy & Weight Management, Bone & Joint Health, OthersSports Nutrition (26.4% share)Cognitive & Stress Support (12.9% CAGR)
By End UserAdults, Geriatric Population, Pregnant Women, ChildrenAdults (43.5% share)Pregnant Women (USD 2.71 Billion)
By Distribution ChannelSupermarkets/Hypermarkets, Pharmacies, Online Retail Stores, Specialty Stores, Other ChannelsSupermarkets/Hypermarkets (38.9% share)Online Retail Stores (15.6% CAGR)
By RegionNorth America, Europe, Asia-Pacific, South America, Middle East & AfricaNorth America (38.2% share)Asia-Pacific (15.1% CAGR)


Market Segmentation Overview

By Ingredient Type

Sub-SegmentKey Trend
Vitamins & MineralsMethylated and chelated forms improve tolerance
Botanicals/HerbalsSolubilization aids reduce sediment and bitterness
Proteins & Amino AcidsClear whey and collagen shots for recovery and aging
Omega-3 & Fatty AcidsAlgal oils and micro-emulsions remove fishy taste
ProbioticsEncapsulation enables ambient-stable cultures
OthersSpecialty actives for beauty and sleep


Vitamins & Minerals lead ingredient demand because daily multivitamin, vitamin D and iron liquids are entrenched in household routines and pharmacist recommendations. Omega-3 & Fatty Acids grow fastest, since micro-emulsion processing and algal sourcing solve the taste and sustainability problems that held back liquid fish oils. Probiotics follow closely as encapsulation removes the refrigeration requirement and opens mainstream shelf space.

By Application

Sub-SegmentKey Trend
Sports NutritionPortable RTD shots for training and recovery
Immune HealthZinc, vitamin D and elderberry seasonal tonics
Digestive HealthSynbiotic shots linked to gut-health apps
Cognitive & Stress SupportNootropic and adaptogen liquids
Energy & Weight ManagementLow-sugar metabolism and energy shots
Bone & Joint HealthCollagen and vitamin K2 blends
OthersSleep and beauty formulations


Sports Nutrition holds the largest application share because ready-to-drink shots fit gym and commuting routines better than powders. Cognitive & Stress Support grows fastest, drawing demand from gamers, knowledge workers and older adults worried about memory decline. Immune Health provides a stable seasonal base that smooths revenue for brands with broad portfolios.

By End User

Sub-SegmentKey Trend
AdultsOnline subscriptions for everyday wellness
Geriatric PopulationEasy-to-swallow textures and joint support
Pregnant WomenGentle-flavoured liquid prenatal formulas
ChildrenPipette droppers and sugar-free taste-masking


Adults remain the dominant end-user group, buying everyday wellness liquids largely through e-commerce. Pregnant Women are the fastest-growing group because liquid prenatal formulas ease nausea and improve compliance where tablets often fall short. The Geriatric Population is a structural growth pillar as swallowing difficulty pushes older consumers away from large tablets.

By Distribution Channel

Sub-SegmentKey Trend
Supermarkets/HypermarketsExpanded wellness aisles and promotions
PharmaciesTherapeutic liquids backed by pharmacist advice
Online Retail StoresAI-driven subscription replenishment
Specialty StoresIn-store sampling of single-dose formats
Other ChannelsCheckout energy shots and direct selling


Supermarkets/Hypermarkets lead distribution through broad shelf presence and frequent promotions on mainstream liquid vitamins. Online Retail Stores grow fastest because subscription models match the predictable replenishment cycle of liquid products and generate valuable customer data. Pharmacies hold their position for therapeutic lines such as liquid iron and high-dose vitamin D, where pharmacist trust drives purchase.


Download PDF ×

We do not share your information with anyone. However, we may send you emails based on your report interest from time to time. You may contact us at any time to opt-out.