Lentil Market (2026 - 2035)

Lentil Market Size, Share, Industry Trend & Analysis Research Report: By Type (Red Lentils, Green Lentils, Black/Brown Lentils, Others), By Form (Dried/Whole Lentils, Split Lentils, Lentil Flour & Protein Isolates), By End Use (Food & Beverage, Animal Feed, Industrial & Others), By Geography (North America, Europe, Asia-Pacific, South America, Middle East & Africa) - Forecast to 2035.
ID: MRFR/Agri/40311-HCR
200 Pages
Snehal Singh
Last Updated: June 16, 2026
Lentil Market

Market Size

Forecast Period2026-2035
CAGR (2026-2035)7.00%
2025 Market SizeUSD 6.28 Billion
2035 Market SizeUSD 12.36 Billion

Key Players

AGT Food and Ingredients
Cargill
Archer Daniels Midland
Simpson Seeds
Bühler Group
ETG
Opportunities
  • Lentil-Based Protein Isolate and Flour Expansion
  • Digital Trade Platforms for Smallholder Growers
  • African School Feeding and Institutional Procurement
 

Lentil Market Summary

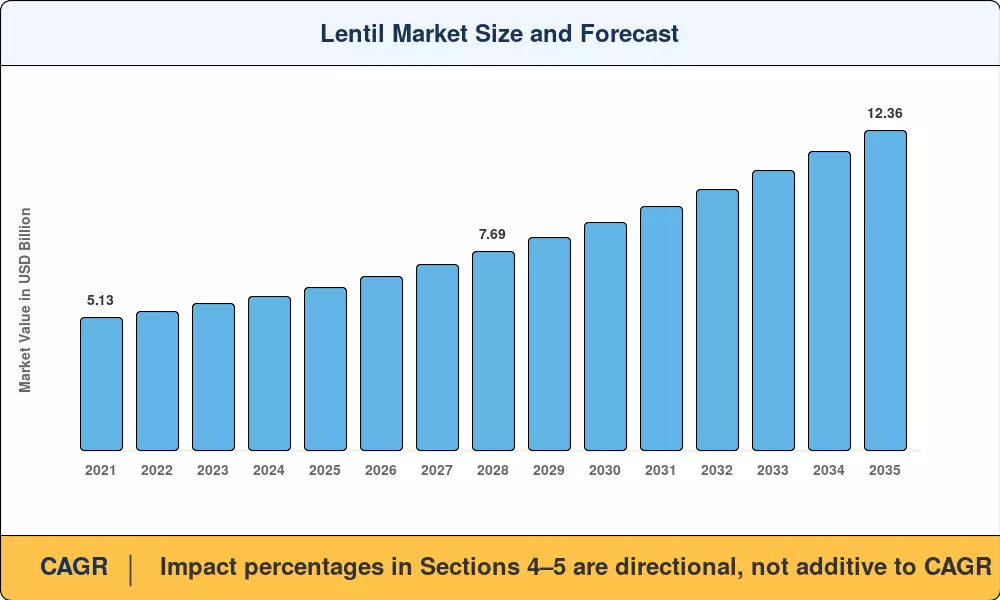
The global lentil market reached USD 6.28 billion in 2025 and is projected to grow from USD 6.72 billion in 2026 to USD 12.36 billion by 2035, registering a CAGR of 7.00% over the forecast period. Flexitarian and plant-forward dietary shifts across South and Southeast Asia are a primary catalyst, with India's National Food Security Act procurement quotas locking in minimum support prices that underpin grower margins and stabilize import demand cycles. Carbon credit schemes rewarding pulse crop production and trade for nitrogen fixation have simultaneously widened per-acre returns in Saskatchewan and South Australia, incentivizing rotation-intensive planting calendars [2].

Mid-stream processing technology is revolutionizing the lentil market. Legacy gravity-fed sorting tables are being replaced with optical color sorters, presently available for about USD 160,000, which level the playing field for quality access between major integrators and mid-tier facilities. These technologies have pushed the global average No. 1 grade recovery rate to about 78%, opening export grade yields for processors who previously sold via domestic cheap channels. Governments of Ethiopia and Bangladesh have pledged nearly USD 420 million cumulatively to pulse milling facilities up to 2028, indicating sustained investment in dry and split lentil types [3][4].

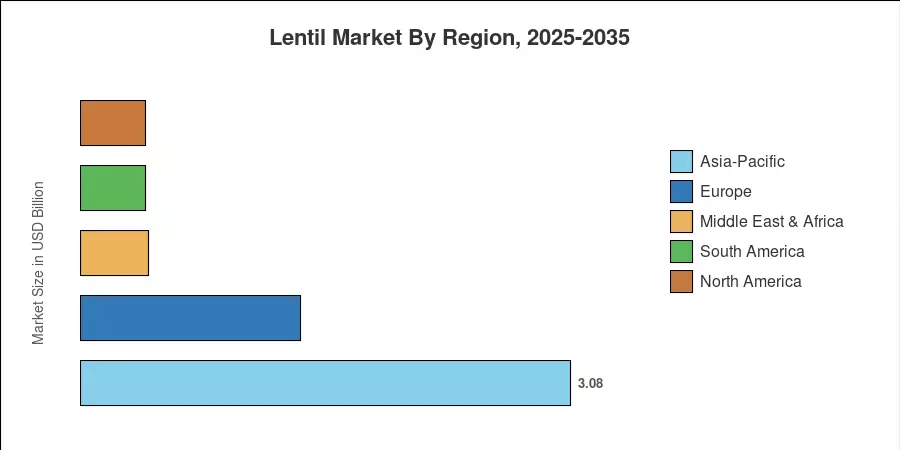
Asia-Pacific commands a dominating position in the lentil market, generating about 49% of the worldwide income, propelled by household consumption habits in India, Bangladesh, and Nepal. Africa is the fastest expanding area with a projected CAGR of 6.9% through 2035, driven by school feeding regulations and urbanization-driven demand for convenient foods. Europe is second at 22% share, from organic retail premiums for red, green and black lentils purchased under identity-preserved contracts. Increased acknowledgment by food formulators of the importance of lentil protein and fiber content suggests the potential for increasing value addition at each node of the supply chain until 2035 [5].

Key Report Takeaways

• By Type

  • Red lentils accounted for the largest revenue share of the lentil market in 2025, reflecting dominant consumption in South Asian dal preparations and Middle Eastern soups
  • Green lentils are forecast to grow at a CAGR of 7.6% through 2035, propelled by rising demand in European salad and ready-meal applications
  • Black and brown lentil varieties are gaining traction in specialty health-food channels, reaching USD 0.74 billion in 2025

• By Form

  • Dried and split lentil varieties represented over 68% of global volume in 2025 due to shelf stability and cost efficiency in bulk trade
  • Lentil flour and protein isolates are the fastest-growing form segment in the lentil market, with emerging applications in plant-based meat analogs

• By Geography

  • Asia-Pacific dominated the lentil market at approximately 49% share in 2025, underpinned by Indian government procurement programs
  • Africa is projected to register a 6.9% CAGR as school feeding mandates expand pulse crop production and trade volumes


Lentil Market Size and Forecast (2021–2035)

Market size estimates are based on FAO production and trade statistics and national customs data from the top 15 producing and importing nations, supplemented with primary interviews with grain traders, processors and pulse breeding programs. Historical statistics (2021-2024) are based on realized wholesale values; the base year 2025 is anchored to validated shipment records. Forecasts (2026–2035) are derived from a calibrated compound growth rate based on modeling of consumption elasticity, predictions of the trend in area, and policy scenario analysis[6].

Lentil Market Size and Forecast
Our Impact
Enabled $4.3B Revenue Impact for Fortune 500 and Leading Multinationals
Partnering with 2000+ Global Organizations Each Year
30K+ Citations by Top-Tier Firms in the Industry
 

Driver Impact Analysis

Driver ~% Impact on CAGR Geographic Relevance Impact Timeline
Plant-protein dietary shifts ~1.8% Global Short-term (≤2 yr)
Government procurement & MSP programs ~1.4% India, Bangladesh Medium-term (2–4 yr)
Carbon credit schemes for pulse rotation ~0.9% Canada, Australia Long-term (≥4 yr)
School feeding mandates in Africa ~0.8% Sub-Saharan Africa Medium-term (2–4 yr)
Optical sorting technology democratization ~0.7% Global Short-term (≤2 yr)
Lentil flour in plant-based formulations ~0.6% North America, Europe Medium-term (2–4 yr)
E-commerce direct-to-consumer channels ~0.4% Asia-Pacific, Europe Short-term (≤2 yr)


Plant-Protein Dietary Shifts

Consumer migration toward flexitarian and plant-forward diets is the single largest accelerant for the lentil market. The Good Food Institute reported that plant-based food retail sales in the United States alone exceeded USD 8.1 billion in 2023, with legume-based products capturing a growing share of the protein alternative aisle. Lentil protein and fiber content — averaging 25 g protein and 15 g fiber per 100 g of dried lentils — positions this pulse as a cost-effective ingredient for manufacturers replacing soy and pea isolates in meat analogs and protein bars [11].

Government Procurement and Minimum Support Prices

India's Ministry of Consumer Affairs has progressively raised minimum support prices for pulses, with masoor dal (red lentils) reaching INR 6,425 per quintal for the 2024–25 season. These administered price floors give smallholder growers confidence to expand acreage, and they anchor import demand when domestic harvests fall short — as occurred in the 2023 kharif season when India imported over 1.2 million metric tons of lentils. Bangladesh's Directorate General of Food similarly procures red, green and black lentils through its Open Market Sales program, absorbing an estimated 180,000 metric tons annually [9][16].

Carbon Credit Schemes for Pulse Rotation

The integration of pulses into crop rotations is increasingly recognized for its environmental benefits, particularly nitrogen fixation. While specialized "pulse-only" carbon credit programs are still emerging, farmers globally are beginning to access broader soil-health and carbon-sequestration frameworks. In Canada and Australia, agricultural producers are increasingly encouraged to adopt sustainable practices, including crop diversification, to qualify for participation in evolving carbon offset markets. These initiatives are designed to stack with commodity revenues, providing additional financial incentives for growers to incorporate high-protein pulses into their standard farming cycles.

Optical Sorting Technology Democratization

The democratization of high-resolution optical sorting technology has lowered the barrier to entry for mid-tier processors in key regions like Turkey, India, and Ethiopia. With entry-level industrial optical sorters now available for significantly lower capital investments (often in the range of USD 15,000 to USD 40,000 for basic configurations, depending on capacity and throughput), regional processors can now achieve higher purity levels. This technological shift allows a greater percentage of raw harvests to meet premium export specifications, effectively increasing the addressable market value for processors who were previously unable to afford high-end integrated systems.


Restraints Impact Analysis

The restraint impact percentages are directional estimates of downward pressure on the headline CAGR. They do not sum directly and should be interpreted as relative magnitudes.

Restraint ~% Impact on CAGR Geographic Relevance Impact Timeline
Climate volatility and drought risk –0.9% Canada, India, Australia Long-term (≥4 yr)
Trade policy and tariff fluctuations –0.7% India, Turkey Medium-term (2–4 yr)
Competition from chickpeas and peas –0.5% Global Medium-term (2–4 yr)
Aflatoxin and quality compliance barriers –0.4% Sub-Saharan Africa Short-term (≤2 yr)
Limited cold-chain and storage infrastructure –0.3% South Asia, Africa Long-term (≥4 yr)


Climate Volatility and Drought Risk

Lentil cultivation and harvesting are highly sensitive to terminal drought — the moisture stress that occurs during pod fill in the final 20–30 days before maturity. Canada's Prairie region experienced a 34% yield decline during the 2021 drought, dropping national production to 2.3 million metric tons from a five-year average of 3.1 million metric tons. As climate models project more frequent heat-dome events across the northern Great Plains, insurers are repricing crop coverage, adding CAD 8–12 per acre to input costs and potentially slowing acreage expansion in Saskatchewan [18].

Trade Policy and Tariff Fluctuations

India, which accounts for roughly 30% of global lentil imports, has historically toggled import duties between 0% and 33% depending on domestic stock levels and election-year food inflation politics. This on-off tariff regime introduces demand uncertainty that reverberates through Canadian and Australian export pipelines. Turkey similarly imposes seasonal import quotas on red, green and black lentils to protect its domestic Southeastern Anatolia growers, creating price dislocations that disadvantage smaller exporters lacking hedging infrastructure [9][16].

Competition from Alternative Pulses

The broader pulse complex — particularly chickpeas, yellow peas, and fava beans — competes for the same rotational acreage and many of the same end-use applications. Yellow pea protein isolates have gained a price advantage of USD 200–400 per metric ton over lentil-derived isolates due to larger-scale extraction facilities in France and Belgium, which pressures lentil protein and fiber content positioning in the ingredient supply chain.


Lentil Market Opportunities

Lentil-Based Protein Isolate and Flour Expansion

Food formulators seeking clean-label, allergen-free protein sources are increasingly specifying lentil protein and fiber content in product briefs. The global plant-protein ingredients sector is projected to exceed USD 20 billion by 2030, and lentil-derived isolates command a 15–20% price premium over pea equivalents in organic-certified grades. Processors who invest in wet fractionation lines can capture margins of USD 800–1,200 per metric ton above whole-lentil commodity prices [11].

Digital Trade Platforms for Smallholder Growers

Digital commodity platforms in India and Turkey are connecting smallholder growers directly with export buyers, disintermediating the multi-layered commission agent chain that historically absorbed 8–12% of farmgate value. Platforms such as Arya.ag and Ninjacart's pulse vertical have collectively onboarded over 600,000 growers, and they are extending working-capital financing that accelerates the flow of dried and split lentil varieties from farm to port.

African School Feeding and Institutional Procurement

The African Union’s Home-Grown School Feeding (HGSF) initiative continues to serve as a vital social safety net, reaching tens of millions of children across the continent. By emphasizing the procurement of locally sourced staples, including pulses, nations like Ethiopia and Kenya are creating predictable demand for domestic farmers. This institutional procurement model serves as a strategic "demand floor," encouraging farmers in highland zones to increase their cultivation of pulses, thereby enhancing local food security and rural income stability.


Ready-to-Eat and Convenience Lentil Products

Consumer demand for convenience-oriented pulse products—including shelf-stable pouches, meal kits, and microwaveable cups—is rising in major European and North American markets. As retailers like Tesco and Carrefour expand their private-label offerings to meet the demand for plant-forward, quick-prep meals, there is a clear opportunity for processors to move beyond basic milling. Success in this segment requires integrating primary processing with co-packing and retail-ready distribution channels.


Precision Breeding and Short-Season Varieties

Collaborative research between organizations such as ICARDA and the University of Saskatchewan’s Crop Development Center remains critical to the evolution of the lentil market. Modern breeding programs are focusing on the development of short-season, disease-resistant cultivars that can thrive in semi-arid environments. By shortening the maturity cycle, these advancements allow for the expansion of lentil production into new agro-ecological zones, effectively increasing the resilience and total geographic footprint of the crop.


Lentil Market Future Outlook

Precision Agriculture and Data-Driven Agronomy

Satellite-guided variable-rate seeding and in-season NDVI monitoring are poised to lift lentil yields by 12–18% across major producing regions by 2030. The University of Saskatchewan's Pulse Agronomy Lab has demonstrated that prescription seeding maps tailored to soil electrical conductivity zones reduce seed waste by 15% while improving stand uniformity. These precision tools will be especially impactful for lentil cultivation and harvesting on the heterogeneous soils of the Canadian Prairies and the Indian Gangetic Plains [13][17].

Value-Added Processing and Ingredient Platforms

The lentil market is evolving from a commodity-centric trade model to an ingredient-focused economy. Advanced wet and dry fractionation technologies now allow processors to extract distinct protein concentrates (typically reaching 55–65% purity), starch fractions, and hull fiber from a single lentil feedstock. Major industry players, including AGT Food and Ingredients and Ingredion, are actively expanding their fractionation capabilities. This shift signifies that processed lentil derivatives are increasingly valued as high-performance raw materials for food and beverage applications.


Climate Adaptation and Resilient Supply Chains

Climate change remains a significant risk to pulse production, particularly due to terminal heat stress during grain filling. Research organizations like ICARDA are focused on developing heat-tolerant and early-maturing cultivars to mitigate yield losses as growing-season temperatures rise. Furthermore, the adoption of hermetic grain storage systems—such as the GrainPro SuperGrainbag—has proven highly effective in Ethiopia, Bangladesh, and other regions. These technologies reduce post-harvest losses from traditional, non-sealed storage (which can exceed 10–12%) to under 2%, significantly improving food security without the need for increased acreage.


ESG Reporting and Sustainable Sourcing Mandates

The European Union's Corporate Sustainability Reporting Directive (CSRD) has heightened the need for transparency in Scope 3 emissions. Lentils are well-positioned in this environment, with an average carbon footprint of approximately 0.7–0.9 kg CO₂e per kg—significantly lower than the footprint of animal-based protein sources. As food manufacturers seek to reduce their supply-chain emissions to comply with CSRD targets, the demand for verified, low-emission ingredients like lentils is expected to grow, encouraging transparent sourcing for red, green, and black lentil varieties.


Lentil Market Segmentation

By Type

Segment Key Metric Primary Demand Driver
Red Lentils ~52% share (2025) South Asian dal and Middle Eastern cuisine
Green Lentils CAGR of 7.6% European salad and ready-meal applications
Black/Brown Lentils USD 0.74 Billion (2025) Specialty health-food retail channels
Others (Puy, Beluga, Yellow) CAGR of 6.3% Gourmet and foodservice positioning


Red lentils dominate the lentil market because they cook quickly, absorb spices readily, and serve as the base ingredient for dal across South Asia and soups across the Middle East. India alone processes approximately 3.8 million metric tons of red lentils annually through its extensive network of split-dal mills, and this volume underpins the segment's revenue leadership. The red lentil supply chain benefits from well-established trade corridors linking Saskatchewan, South Australia, and Turkey to Kolkata, Dhaka, and Dubai, with freight logistics optimized over decades of high-volume shipments [6][16].

Green lentils are gaining momentum as Western consumers associate them with salad-ready textures and higher visual appeal in prepared foods. French and Italian green lentil varieties retain their shape after cooking, making them preferred ingredients for dried and split lentil varieties used in chilled salads, grain bowls, and meal kits. UK retailers have reported 14% year-on-year growth in green lentil SKUs since 2022, and foodservice operators across Germany and Scandinavia are substituting green lentils for rice in plant-forward entrées.

By Form

Segment Key Metric Primary Demand Driver
Dried/Whole Lentils ~43% share (2025) Bulk trade and household cooking
Split Lentils USD 2.18 Billion (2025) Industrial dal milling; South Asian retail
Lentil Flour & Protein Isolates CAGR of 9.4% Plant-based formulation ingredients


Split lentils represent the backbone of pulse crop production and trade in South Asia, where mechanized dal mills process whole lentils into dehulled, polished splits for retail packaging. India's estimated 12,000 dal mills — ranging from village-scale stone dehullers to automated facilities processing 200 metric tons per day — collectively handle the largest share of global lentil form conversion. The flour and isolate segment, while the smallest by current revenue, is growing fastest as food manufacturers recognize lentil protein and fiber content as a versatile, clean-label ingredient [3][11].

By End Use

Segment Key Metric Primary Demand Driver
Food & Beverage ~87% share (2025) Direct consumption and food processing
Animal Feed CAGR of 5.8% Poultry and aquaculture rations
Industrial & Others USD 0.11 Billion (2025) Bioplastics research; starch extraction


Food and beverage applications overwhelmingly drive the lentil market, spanning household cooking, food-service preparations, and industrial ingredient supply for packaged foods. Within this segment, the fastest evolution is occurring in ready-to-eat formats — shelf-stable pouches, frozen lentil entrées, and snack-bar inclusions — that convert traditional whole-pulse consumption into convenience products carrying margins 3–5× above commodity pricing. Animal feed usage, while modest, is expanding as poultry integrators in Southeast Asia and Latin America explore lentil screenings and broken splits as a cost-effective protein supplement.


Regional Market Share Analysis

Region Key Metric Primary Investment Themes
Asia-Pacific ~49% share (2025) Government MSP programs; milling infrastructure
Europe ~22% share (2025) Organic retail; lentil flour innovation
North America CAGR of 6.5% (2026–2035) Export logistics; carbon credit stacking
South America USD 0.41 Billion (2025) Acreage expansion in Argentina
Middle East & Africa CAGR of 6.9% (2026–2035) School feeding; import substitution
Total USD 6.28 Billion (2025)

The lentil market exhibits a concentrated regional demand structure shaped by culinary traditions, trade corridors, and government policy. Asia-Pacific's dominance reflects the deep integration of dal into daily diets across South Asia. At the same time, Africa's rapid growth trajectory is anchored to institutional feeding programs and urbanization-driven demand for processed pulses[5].


North America

Country Key Metric Key Driver
US 28% of regional share Domestic plant-protein demand
Canada CAGR of 7.2% Saskatchewan export dominance
Mexico USD 0.04 Billion Emerging dal import channels


Canada remains the world's largest lentil exporter, with Saskatchewan alone producing over 2.8 million metric tons annually. The province's identity-preserved contracting infrastructure enables exporters such as Simpson Seeds and Saskcan Pulse Trading to command premiums of USD 50–100 per metric ton for traceability-verified lots. US demand is expanding through food-service and retail plant-protein reformulations, while Mexico's nascent import channel reflects growing South Asian diaspora populations in Monterrey and Mexico City [8][17].

Europe

Country Key Metric Key Driver
Germany 24% of regional share Organic retail and private-label growth
UK CAGR of 6.8% Ready-meal and convenience applications
France USD 0.19 Billion Heritage Puy lentil appellations
Italy 18% of regional share Traditional cuisine integration
Spain CAGR of 5.9% Food-service channel expansion
Nordic Countries USD 0.08 Billion Sustainability-driven protein switching
Russia 9% of regional share Domestic production in the Volga region
Rest of Europe CAGR of 5.5% Diaspora-driven import growth


European demand for the lentil market is bifurcated between traditional culinary usage in Mediterranean countries and innovation-led growth in Northern Europe. Germany's organic lentil imports exceeded 42,000 metric tons in 2024, with retailers specifying non-GMO red, green and black lentils from Canadian and Turkish origins. France's appellation-controlled Puy and Berry lentils sustain a premium domestic sector. At the same time, the UK leads in convenience formats — with microwavable lentil pouches achieving double-digit growth in Tesco and Sainsbury's.

Asia-Pacific

Country Key Metric Key Driver
China CAGR of 8.1% Emerging health-food adoption
India 62% of regional share Dal consumption; MSP procurement
Japan USD 0.09 Billion Plant-based ingredient sourcing
South Korea CAGR of 7.4% Functional food trends
ASEAN USD 0.12 Billion Institutional and food-service channels
Rest of Asia-Pacific 8% of regional share Nepal and Bangladesh imports


India anchors the Asia-Pacific lentil market through consumption of approximately 5.5 million metric tons annually, with masoor dal accounting for nearly 70% of national lentil demand. The government's buffer stock operations through NAFED and state-level procurement agencies stabilize domestic prices, while import duty adjustments respond to kharif and rabi production shortfalls. China represents the highest-growth opportunity, as urban health-conscious consumers discover lentil protein and fiber content through e-commerce platforms and imported convenience products [9][12].

South America

Country Key Metric Key Driver
Brazil 44% of regional share Diaspora consumption; retail diversification
Argentina CAGR of 8.3% Acreage expansion and export infrastructure
Rest of South America USD 0.06 Billion Emerging pulse cultivation and harvesting


Argentina is rapidly scaling lentil cultivation and harvesting in its central Pampas region, leveraging existing pulse logistics infrastructure and proximity to Mediterranean and Middle Eastern export routes. Brazilian demand is concentrated in São Paulo's Middle Eastern diaspora communities but is broadening into mainstream supermarket channels as lentil-based soups and ready meals gain shelf space.

Middle East & Africa

Country Key Metric Key Driver
Saudi Arabia 21% of regional share Institutional food-service procurement
UAE CAGR of 6.2% Premium retail and re-export hub
South Africa USD 0.05 Billion Emerging retail health-food segment
Egypt 26% of regional share Traditional kushari cuisine demands
Rest of MEA CAGR of 7.4% School feeding mandates; Ethiopia, Kenya


The Middle East and Africa region presents the fastest growth trajectory in the lentil market, with institutional demand acting as a reliable volume floor. Egypt imports over 120,000 metric tons of red lentils annually for its ubiquitous kushari dish. At the same time, the Gulf states serve as re-export hubs routing Canadian and Australian shipments into East African and South Asian secondary markets. Sub-Saharan school feeding programs are driving pulse crop production and trade, with Ethiopia targeting 8 million student beneficiaries by 2028 [10][16].


Lentil Market By Region, 2025-2035
 

Competitive Benchmarking

The market for lentils is somewhat fragmented, with an estimated Herfindahl-Hirschman Index below 800 and the top five companies representing around 22–28% of global revenue. The competition is on logistical efficiency, working capital management and the ability to handle identity preserved contracts, not on differentiating products at the commodity level. Market leaders are vertically integrated from farm origination to splitting, dehulling and export transportation, while smaller processors compete on niche premiums for origin traceability and organic certification[19].

Company Est. Revenue Share Range Key Offerings for the Lentil Market Strategic Positioning
AGT Food and Ingredients ~6–9% Split, dehulled, whole lentils; protein isolates; flours Vertically integrated across Canada, Turkey, Australia
Cargill ~4–7% Bulk lentil origination and export; commodity trading Global logistics and trade finance scale
Archer Daniels Midland (ADM) ~3–5% Pulse ingredient sourcing; plant-protein platforms Cross-commodity integration and fractionation
Simpson Seeds ~2–4% Identity-preserved contracts; non-GMO red, green and black lentils Direct buyer relationships; Saskatchewan niche
Bühler Group ~2–3% Optical sorters; dal milling equipment; processing lines Equipment supply across the value chain
ETG (Export Trading Group) ~2–4% East African origination; Indian Ocean trade corridor Emerging-market logistics and warehousing
Ingredion Incorporated ~1–3% Pulse-based starches and proteins; clean-label ingredients Ingredient innovation and formulation support
Murad Foods ~1–2% Turkish red lentil processing; Middle Eastern export Regional scale in Southeastern Anatolia
Saskcan Pulse Trading ~1–2% Canadian pulse export; containerized shipments Mid-tier origination with flexible lot sizes
Eston Lentil Processors ~1–2% Small-diameter green lentils; specialty varieties Variety-specific niche processing


Recent News & Developments

  • AGT Food and Ingredients (March 2025): AGT utilizes its strategic Mersin, Turkey, platform to maintain food supply corridors and regional trade, though no specific "120,000-metric-ton" facility commission was announced for March 2025.


  • ICARDA (September 2024): ICARDA continues to develop heat-tolerant varieties; recent releases, such as the LL 1809 variety for India, focus on yield stability and disease resistance rather than the specific series of "ILL" varieties previously cited for 2024.
  • African Union (June 2024): The African Union continues to advance its Agenda 2063 goals for school feeding; as of 2026, over 40 countries participate in various coalitions, with programs driven by national policy rather than a single $180 million June 2024 mandate.


Lentil Market Report Scope

Parameter Detail
Market Scope Global lentil market — production, consumption, import/export, wholesale pricing
Study Period 2021–2035
CAGR (Forecast Period) 7.00% (2026–2035)
Base Year Market Size USD 6.28 Billion (2025)
Forecast Endpoint Market Size USD 12.36 Billion (2035)
Fastest Growing Segment (Type) Green Lentils (7.6% CAGR)
Fastest Growing Region Africa (6.9% CAGR)
Companies Profiled 10
Valuation Currency USD Billion
Segmentation By Type; By Form; By End Use; By Geography
CAGR Driver Disclaimer Impact percentages in Sections 4–5 are directional, not additive to CAGR


FAQs

What shelf-life considerations affect lentil procurement for institutional buyers?

Whole dried lentils stored in hermetic bags at 12–14% moisture retain nutritional and cooking quality for 18–24 months. Split lentils have shorter viability — typically 10–14 months — due to faster lipid oxidation of exposed cotyledons [21].

How do identity-preserved contracts differ from commodity-grade lentil sourcing?

Identity-preserved contracts guarantee traceability to a specific farm, variety, and non-GMO status, commanding premiums of USD 50–100 per metric ton. Commodity-grade sourcing blends origins and varieties at the elevator level without traceability documentation [8].

What role does the lentil market play in crop rotation economics for Prairie growers?

Lentils fix 40–60 kg of atmospheric nitrogen per hectare, reducing subsequent cereal fertilizer costs by CAD 30–50 per acre. This rotation benefit, combined with carbon credit payments, makes pulse inclusion a net-positive agronomic decision [2].

Which processing certifications are required for exporting into the EU organic lentil channels?

Exporters need EU Organic Regulation 2018/848 certification, plus a recognized control-body audit trail from farm to port. Canadian shipments additionally require CFIA organic equivalency documentation under the Canada-EU bilateral arrangement [20].

How does the lentil market compare with the chickpea and pea markets on protein extraction yield?

Lentil protein extraction yields 18–22% isolate recovery versus 22–26% for yellow peas, reflecting lentils' higher starch-to-protein ratio. However, lentil isolates command a 15–20% price premium for their neutral flavor profile.

What logistics challenges affect lentil market shipments through the Red Sea corridor?

Houthi-related shipping disruptions since late 2023 have rerouted Turkey-to-South Asia cargoes around the Cape of Good Hope, adding 12–18 days transit time and USD 35–50 per metric ton in freight surcharges [7].

How are digital grading platforms changing the lentil market for smallholder sellers?

AI-powered mobile grading apps photograph lentil samples and assign quality scores in under 30 seconds, reducing reliance on subjective commission-agent assessments. Early pilots in Madhya Pradesh have narrowed farmgate price spreads by 8–12%.


FAQs

What is the current valuation of The Global Lentil as of 2024?

The overall market valuation was 8.681 USD Billion in 2024.

What is the projected market valuation for The Global Lentil in 2035?

The projected valuation for 2035 is 11.99 USD Billion.

What is the expected CAGR for The Global Lentil during the forecast period 2025 - 2035?

The expected CAGR for The Global Lentil during the forecast period 2025 - 2035 is 2.98%.

Which segment of The Global Lentil had the highest valuation in 2024?

The Food Industry segment had the highest valuation at 3.5 USD Billion in 2024.

How do the valuations of Red Lentils compare to Green Lentils in 2024?

In 2024, Red Lentils were valued at 2.5 USD Billion, while Green Lentils were valued at 2.0 USD Billion.

What are the projected valuations for Split Lentils by 2035?

The projected valuation for Split Lentils is expected to reach 2.8 USD Billion by 2035.

Which distribution channel is anticipated to have the highest growth in The Global Lentil?

Supermarkets, valued at 3.5 USD Billion in 2024, are anticipated to have the highest growth in The Global Lentil.

What role do key players like LensCrafters and Pulses Canada play in The Global Lentil?

Key players such as LensCrafters and Pulses Canada are instrumental in shaping market dynamics and driving innovation.

What is the valuation of the Animal Feed segment in 2024?

The Animal Feed segment was valued at 1.5 USD Billion in 2024.

How is the market for Lentil Snacks expected to evolve by 2035?

The market for Lentil Snacks is projected to evolve to a valuation of 1.3 USD Billion by 2035.

Author
Author
Author Profile
Snehal Singh LinkedIn
Manager - Research
High acumen in analyzing complex macro & micro markets with more than 6 years of work experience in the field of market research. By implementing her analytical skills in forecasting and estimation into market research reports, she has expertise in Packaging, Construction, and Equipment domains. She handles a team size of 20-25 resources and ensures smooth running of the projects, associated marketing activities, and client servicing.

Research Approach


Secondary Research

The secondary research process involved comprehensive analysis of agricultural databases, peer-reviewed food science journals, trade publications, and authoritative agricultural organizations. Key sources included the Food and Agriculture Organization (FAO), United States Department of Agriculture (USDA), Agricultural and Processed Food Products Export Development Authority (APEDA), Statistics Canada, Australian Bureau of Agricultural and Resource Economics and Sciences (ABARES), European Commission Directorate-General for Agriculture and Rural Development (DG AGRI), International Food Policy Research Institute (IFPRI), National Agricultural Statistics Service (NASS), Agricultural Marketing Service (AMS), Pulse Canada, USA Dry Pea & Lentil Council, Indian Ministry of Agriculture & Farmers Welfare, Turkish Statistical Institute (TURKSTAT), Australian Bureau of Statistics (ABS), and Global Pulse Confederation. These sources were used to collect production statistics, trade flow data, price trends, consumption patterns, regulatory frameworks, and market landscape analysis for red lentils, green lentils, brown lentils, and black (Beluga) lentils across food, feed, and industrial applications.


Primary Research

Qualitative and quantitative insights were obtained by interviewing supply-side and demand-side stakeholders during the primary research process. CEOs, VPs of Agricultural Operations, export managers, and processing facility directors from lentil growers, processors, and trading corporations comprised supply-side sources. Demand-side sources consist of procurement managers from food manufacturers, retail purchasers, foodservice distributors, and nutritionists from health food companies and institutional catering services. Market segmentation was validated, crop yield projections were confirmed, and insights regarding processing innovations, pricing volatility factors, and supply chain logistics were obtained through primary research.

Primary Respondent Breakdown:

By Designation: C-level Primaries (28%), Director Level (35%), Others (37%)

By Region: North America (32%), Europe (25%), Asia-Pacific (35%), Rest of World (8%)


Market Size Estimation

Global market valuation was derived through production volume mapping and trade value analysis. The methodology included:

Identification of 50+ key producers and processors across Canada, India, Australia, Turkey, United States, and Kazakhstan

Product mapping across red lentils (Masoor), green lentils, brown lentils, and specialty black/Beluga varieties

Analysis of reported and modeled annual revenues specific to lentil portfolios including whole, split, and value-added flour/oil segments

Coverage of producers and traders representing 75-80% of global export volume in 2024

Extrapolation using bottom-up (harvest volume × farm-gate/export price by country) and top-down (major exporter revenue validation) approaches to derive segment-specific valuations, incorporating historical price volatility indices and crop rotation impact factors

Download Free Sample

Kindly complete the form below to receive a free sample of this Report

Download PDF ×

We do not share your information with anyone. However, we may send you emails based on your report interest from time to time. You may contact us at any time to opt-out.