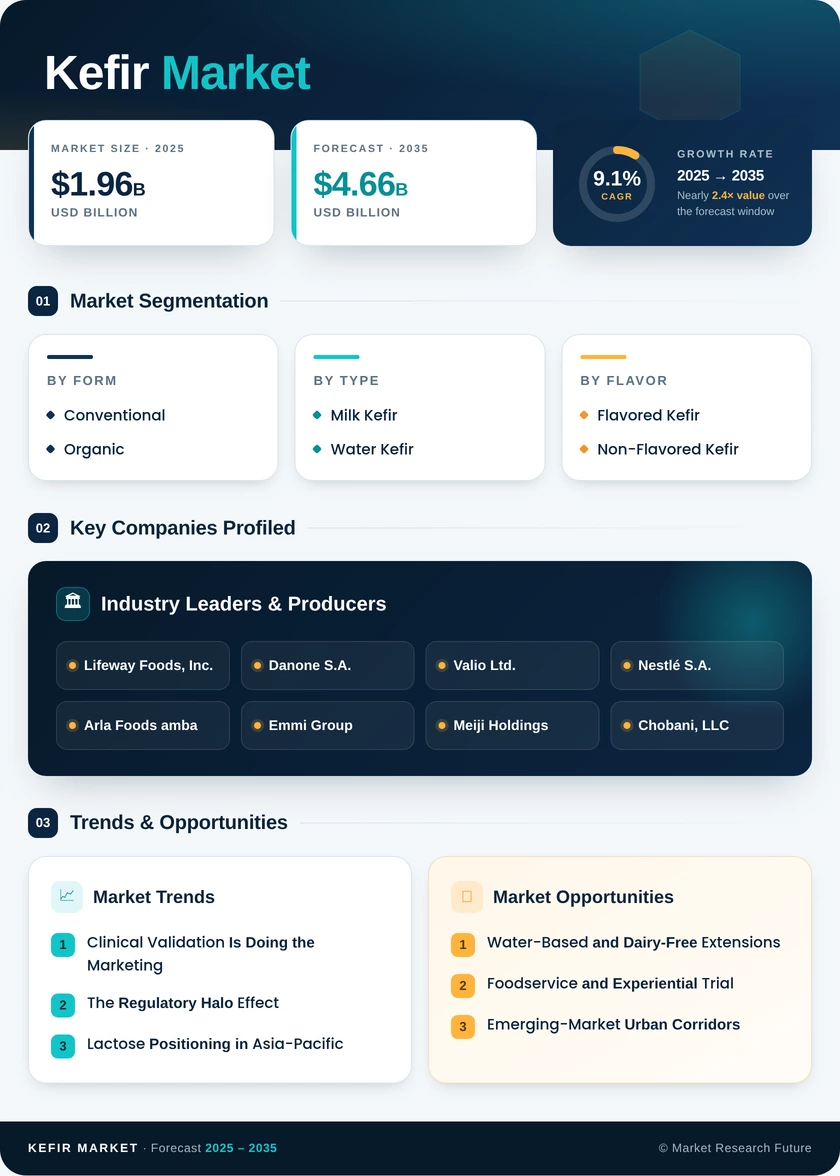
Kefir Market (2026 - 2035)

ID: MRFR/FnB/2976-HCR 110 Pages Pradeep Nandi Last Updated: October 23, 2026
Kefir Market Size, Share, Industry Trend & Analysis Research Report Information By Form (Organic, Conventional), By Flavor (Flavored Kefir, Non-Flavored Kefir), By Product Type (Milk Kefir, Water Kefir), By Distribution Channel (Off-Trade, On-Trade), By Packaging Type (Bottles, Pouches), By Geography (North America, Europe, Asia-Pacific, South America, Middle East & Africa) – Forecast Till 2035
Kefir Market
Market Size
Forecast Period2026-2035
CAGR (2026-2035)9.1%
2025 Market SizeUSD 1.96 Billion
2035 Market SizeUSD 4.66 Billion
Key Players
Lifeway Foods, Inc.
Danone S.A.
Valio Ltd.
Nestlé S.A.
Arla Foods amba
Emmi Group
Opportunities
  • Water-Based and Dairy-Free Extensions
  • Foodservice and Experiential Trial
  • Emerging-Market Urban Corridors
  1. 1 Market Summary |
    1. 1.1 Study Assumptions & Market Definition |
    2. 1.2 Scope of the Study |
    3. 1.3 Research Methodology
  2. 2 Key Report Takeaways |
    1. 2.1 By Product & Form |
    2. 2.2 By Channel & Packaging |
    3. 2.3 By Geography
  3. 3 Market Size & Forecast (2021–2035) |
    1. 3.1 Historical Market Size (2021–2025) |
    2. 3.2 Current & Forecast Market Size (2026–2035) |
    3. 3.3 Year-over-Year Growth Analysis
  4. 4 Driver Impact Analysis |
    1. 4.1 Clinical Validation of Gut-Health Benefits |
    2. 4.2 Regulatory Health-Claim Halo |
    3. 4.3 Lactose Positioning in Asia-Pacific |
    4. 4.4 Cold-Chain and Modern-Trade Expansion
  5. 5 Restraints Impact Analysis |
    1. 5.1 Raw Milk Price Volatility |
    2. 5.2 Probiotic Claim Restrictions in Europe |
    3. 5.3 Cold-Chain Economics and Shelf Life
  6. 6 Opportunity Analysis |
    1. 6.1 Water-Based and Dairy-Free Extensions |
    2. 6.2 Foodservice and Experiential Trial |
    3. 6.3 Emerging-Market Urban Corridors |
    4. 6.4 Culture Licensing and Ingredient Monetization |
    5. 6.5 Data-Driven Personalization
  7. 7 Regional Market Share & Country-Level Analysis |
    1. 7.1 North America | |
      1. 7.1.1 US | |
      2. 7.1.2 Canada | |
      3. 7.1.3 Mexico |
    2. 7.2 Europe | |
      1. 7.2.1 Germany | |
      2. 7.2.2 UK | |
      3. 7.2.3 France | |
      4. 7.2.4 Italy | |
      5. 7.2.5 Spain | |
      6. 7.2.6 Nordic Countries | |
      7. 7.2.7 Russia | |
      8. 7.2.8 Rest of Europe |
    3. 7.3 Asia-Pacific | |
      1. 7.3.1 China | |
      2. 7.3.2 India | |
      3. 7.3.3 Japan | |
      4. 7.3.4 South Korea | |
      5. 7.3.5 ASEAN | |
      6. 7.3.6 Rest of Asia-Pacific |
    4. 7.4 South America | |
      1. 7.4.1 Brazil | |
      2. 7.4.2 Argentina | |
      3. 7.4.3 Rest of South America |
    5. 7.5 Middle East & Africa | |
      1. 7.5.1 Saudi Arabia | |
      2. 7.5.2 UAE | |
      3. 7.5.3 South Africa | |
      4. 7.5.4 Egypt | |
      5. 7.5.5 Rest of Middle East & Africa
  8. 8 Future Outlook (2026–2035) |
    1. 8.1 Precision Fermentation & Strain Engineering |
    2. 8.2 Sugar Reduction as Category Reset |
    3. 8.3 Sustainability Disclosure & Scope 3 |
    4. 8.4 Ambient Formats & Distribution Unlock
  9. 9 Market Segmentation Analysis |
    1. 9.1 By Form | |
      1. 9.1.1 Organic | |
      2. 9.1.2 Conventional |
    2. 9.2 By Flavor | |
      1. 9.2.1 Flavored Kefir | |
      2. 9.2.2 Non-Flavored Kefir |
    3. 9.3 By Product Type | |
      1. 9.3.1 Milk Kefir | |
      2. 9.3.2 Water Kefir |
    4. 9.4 By Distribution Channel | |
      1. 9.4.1 Off-Trade | |
      2. 9.4.2 On-Trade |
    5. 9.5 By Packaging Type | |
      1. 9.5.1 Bottles | |
      2. 9.5.2 Pouches
  10. 10 Competitive Landscape |
    1. 10.1 Market Share Analysis (2026) |
    2. 10.2 Competitive Benchmarking Matrix |
    3. 10.3 Company Profiles | |
      1. 10.3.1 Lifeway Foods, Inc. | |
      2. 10.3.2 Danone S.A. | |
      3. 10.3.3 Valio Ltd. | |
      4. 10.3.4 Nestlé S.A. | |
      5. 10.3.5 Arla Foods amba | |
      6. 10.3.6 Emmi Group | |
      7. 10.3.7 Meiji Holdings | |
      8. 10.3.8 Chobani, LLC | |
      9. 10.3.9 Bio-tiful Dairy | |
      10. 10.3.10 Maple Hill Creamery | |
      11. 10.3.11 Karoun Dairies
  11. 11 Recent News & Developments
  12. 12 Report Scope & Methodology |
    1. 12.1 Study Period & Base Year |
    2. 12.2 Data Sources & Citations |
    3. 12.3 Abbreviations
  13. 13 Detailed Sources & Citations
  14. 14 Frequently Asked Questions
  15. 15 LIST OF TABLES |
  16. TABLE 1 Global Kefir Market Size & Forecast, by Revenue (USD Billion), 2021–2035 |
  17. TABLE 2 Global Kefir Market – Year-over-Year Growth Analysis, 2021–2035 |
  18. TABLE 3 Driver Impact Analysis – Global Kefir Market, 2026–2035 |
  19. TABLE 4 Restraint Impact Analysis – Global Kefir Market, 2026–2035 |
  20. TABLE 5 Global Kefir Market Size, by Region, 2021–2035 (USD Billion) |
  21. TABLE 6 North America Kefir Market Size, by Country, 2021–2035 (USD Billion) |
  22. TABLE 7 Europe Kefir Market Size, by Country, 2021–2035 (USD Billion) |
  23. TABLE 8 Asia-Pacific Kefir Market Size, by Country, 2021–2035 (USD Billion) |
  24. TABLE 9 South America Kefir Market Size, by Country, 2021–2035 (USD Billion) |
  25. TABLE 10 Middle East & Africa Kefir Market Size, by Country, 2021–2035 (USD Billion) |
  26. TABLE 11 Global Kefir Market Size, by Form, 2021–2035 (USD Billion) |
  27. TABLE 12 Global Kefir Market Size, by Flavor, 2021–2035 (USD Billion) |
  28. TABLE 13 Global Kefir Market Size, by Product Type, 2021–2035 (USD Billion) |
  29. TABLE 14 Global Kefir Market Size, by Distribution Channel, 2021–2035 (USD Billion) |
  30. TABLE 15 Global Kefir Market Size, by Packaging Type, 2021–2035 (USD Billion) |
  31. TABLE 16 Competitive Benchmarking Matrix – Global Kefir Market, 2026 |
  32. TABLE 17 Company Profiles – Key Players, Global Kefir Market |
  33. TABLE 18 Recent Developments & Strategic Announcements, 2023–2025 |
  34. TABLE 19 Report Scope & Methodology Summary |
  35. TABLE 20 Detailed Sources & Citations Index
  36. 16 LIST OF FIGURES |
  37. FIGURE 1 Global Kefir Market Dynamics – Drivers, Restraints & Opportunities |
  38. FIGURE 2 Industry Value Chain Analysis – Cultured Dairy |
  39. FIGURE 3 Porter's Five Forces Analysis – Global Kefir Market |
  40. FIGURE 4 Global Kefir Market Size Trend, 2021–2035 (USD Billion) |
  41. FIGURE 5 Year-over-Year Growth Trend, 2022–2035 (%) |
  42. FIGURE 6 Market Share by Form, 2025 vs 2035 (%) |
  43. FIGURE 7 Market Share by Flavor, 2025 vs 2035 (%) |
  44. FIGURE 8 Market Share by Product Type, 2025 vs 2035 (%) |
  45. FIGURE 9 Market Share by Distribution Channel, 2025 vs 2035 (%) |
  46. FIGURE 10 Market Share by Packaging Type, 2025 vs 2035 (%) |
  47. FIGURE 11 Regional Market Share, 2025 (%) |
  48. FIGURE 12 Regional CAGR Comparison, 2026–2035 (%) |
  49. FIGURE 13 Country-Level Growth Heat Map, 2026–2035 |
  50. FIGURE 14 Competitive Landscape – Estimated Revenue Share Bands, 2026 |
  51. FIGURE 15 Strategic Positioning Matrix – Key Players

Segmentation Quick Reference

DimensionSub-SegmentsDominant SegmentFastest Growing Segment
By FormOrganic, ConventionalConventionalOrganic
By FlavorFlavored Kefir, Non-Flavored KefirFlavored KefirNon-Flavored Kefir
By Product TypeMilk Kefir, Water KefirMilk KefirWater Kefir
By Distribution ChannelOff-Trade, On-TradeOff-TradeOn-Trade
By Packaging TypeBottles, PouchesBottlesPouches
By GeographyNorth America, Europe, Asia-Pacific, South America, Middle East & AfricaEuropeAsia-Pacific


Market Segmentation Overview

By Form

Sub-SegmentKey Trend
OrganicPremium pricing holds through inflation; certified supply constrains volume growth.
ConventionalPrivate-label entry pressures branded pricing at mainstream shelf


Conventional supply carries the category on accessibility, while organic captures the margin pool. Certified milk availability, not consumer demand, is the binding constraint on organic expansion through 2030.

By Flavor

Sub-SegmentKey Trend
Flavored KefirReformulation toward stevia and fruit-forward profiles under sugar rules
Non-Flavored KefirGains from clean-label preference and culinary use as a cooking base


Flavored lines remain the recruitment vehicle for new consumers, but regulatory sugar thresholds are steadily narrowing the formulation window. Plain variants benefit twice — from label simplicity and from culinary substitution for buttermilk.

By Product Type

Sub-SegmentKey Trend
Milk KefirProtein positioning competes directly with drinkable yogurt
Water KefirDairy-free, low-calorie entry point with ambient format potential


Milk-based formats retain nutritional advantage and shelf presence. Water-based variants matter strategically because they escape both dairy allergen restrictions and, potentially, the cold chain.

By Distribution Channel

Sub-SegmentKey Trend
Off-TradeSupermarket planogram defence and private-label share gain
On-TradeCafé and wellness venue menus drive trial and brand equity.


Retail delivers volume; foodservice delivers discovery. Brands increasingly treat on-trade placement as a marketing line item rather than a profit centre.

By Packaging Type

Sub-SegmentKey Trend
BottlesMulti-serve household format; recyclability pressure on PET
PouchesSingle-serve portability unlocking price-sensitive emerging markets.


Bottles remain the default for household purchase and refrigerator storage. Pouch growth is fastest where low unit price and portability determine whether daily consumption is affordable at all.


You’ve used 75% of your weekly limit.

Download PDF ×

We do not share your information with anyone. However, we may send you emails based on your report interest from time to time. You may contact us at any time to opt-out.