Request Free Sample ×

Kindly complete the form below to receive a free sample of this Report

* Please use a valid business email

Leading companies partner with us for data-driven Insights

clients tt-cursor
Hero Background

Japan Laboratory Informatics Market

ID: MRFR/MED/49185-HCR
200 Pages
Rahul Gotadki
Last Updated: February 06, 2026

Japan Laboratory Informatics Market Research Report By Application (Laboratory Information Management Systems, Electronic Lab Notebooks, Chromatography Data Systems, Scientific Data Management Systems), By Deployment Type (On-Premise, Cloud-Based, Hybrid), By End User (Pharmaceuticals, Biotechnology, Clinical Laboratories, Academic Institutes, Environmental Testing) andBy Component (Software, Services, Hardware) - Growth & Industry Forecast 2025 To 2035

Share:
Download PDF ×

We do not share your information with anyone. However, we may send you emails based on your report interest from time to time. You may contact us at any time to opt-out.

  1. 1 SECTION I: EXECUTIVE SUMMARY AND KEY HIGHLIGHTS
    1. 1.1 EXECUTIVE SUMMARY
      1. 1.1.1 Market Overview
      2. 1.1.2 Key Findings
      3. 1.1.3 Market Segmentation
      4. 1.1.4 Competitive Landscape
      5. 1.1.5 Challenges and Opportunities
      6. 1.1.6 Future Outlook
  2. 2 SECTION II: SCOPING, METHODOLOGY AND MARKET STRUCTURE
    1. 2.1 MARKET INTRODUCTION
      1. 2.1.1 Definition
      2. 2.1.2 Scope of the study
        1. 2.1.2.1 Research Objective
        2. 2.1.2.2 Assumption
        3. 2.1.2.3 Limitations
    2. 2.2 RESEARCH METHODOLOGY
      1. 2.2.1 Overview
      2. 2.2.2 Data Mining
      3. 2.2.3 Secondary Research
      4. 2.2.4 Primary Research
        1. 2.2.4.1 Primary Interviews and Information Gathering Process
        2. 2.2.4.2 Breakdown of Primary Respondents
      5. 2.2.5 Forecasting Model
      6. 2.2.6 Market Size Estimation
        1. 2.2.6.1 Bottom-Up Approach
        2. 2.2.6.2 Top-Down Approach
      7. 2.2.7 Data Triangulation
      8. 2.2.8 Validation
  3. 3 SECTION III: QUALITATIVE ANALYSIS
    1. 3.1 MARKET DYNAMICS
      1. 3.1.1 Overview
      2. 3.1.2 Drivers
      3. 3.1.3 Restraints
      4. 3.1.4 Opportunities
    2. 3.2 MARKET FACTOR ANALYSIS
      1. 3.2.1 Value chain Analysis
      2. 3.2.2 Porter's Five Forces Analysis
        1. 3.2.2.1 Bargaining Power of Suppliers
        2. 3.2.2.2 Bargaining Power of Buyers
        3. 3.2.2.3 Threat of New Entrants
        4. 3.2.2.4 Threat of Substitutes
        5. 3.2.2.5 Intensity of Rivalry
      3. 3.2.3 COVID-19 Impact Analysis
        1. 3.2.3.1 Market Impact Analysis
        2. 3.2.3.2 Regional Impact
        3. 3.2.3.3 Opportunity and Threat Analysis
  4. 4 SECTION IV: QUANTITATIVE ANALYSIS
    1. 4.1 Pharmaceutical, BY Type (USD Million)
      1. 4.1.1 Laboratory Information Management System (LIMS)
      2. 4.1.2 Electronic Lab Notebooks (ELN)
      3. 4.1.3 Scientific Data Management System (SDMS)
      4. 4.1.4 Chromatography Data System (CDS)
      5. 4.1.5 Analytics Software
    2. 4.2 Pharmaceutical, BY Deployment Type (USD Million)
      1. 4.2.1 On-Premise
      2. 4.2.2 Cloud-Based
      3. 4.2.3 Hybrid
    3. 4.3 Pharmaceutical, BY End User (USD Million)
      1. 4.3.1 Pharmaceuticals
      2. 4.3.2 Biotechnology
      3. 4.3.3 Clinical Laboratories
      4. 4.3.4 Academic Research
      5. 4.3.5 Environmental Testing
    4. 4.4 Pharmaceutical, BY Application (USD Million)
      1. 4.4.1 Drug Discovery
      2. 4.4.2 Quality Control
      3. 4.4.3 Clinical Research
      4. 4.4.4 Environmental Testing
      5. 4.4.5 Food and Beverage Testing
  5. 5 SECTION V: COMPETITIVE ANALYSIS
    1. 5.1 Competitive Landscape
      1. 5.1.1 Overview
      2. 5.1.2 Competitive Analysis
      3. 5.1.3 Market share Analysis
      4. 5.1.4 Major Growth Strategy in the Pharmaceutical
      5. 5.1.5 Competitive Benchmarking
      6. 5.1.6 Leading Players in Terms of Number of Developments in the Pharmaceutical
      7. 5.1.7 Key developments and growth strategies
        1. 5.1.7.1 New Product Launch/Service Deployment
        2. 5.1.7.2 Merger & Acquisitions
        3. 5.1.7.3 Joint Ventures
      8. 5.1.8 Major Players Financial Matrix
        1. 5.1.8.1 Sales and Operating Income
        2. 5.1.8.2 Major Players R&D Expenditure. 2023
    2. 5.2 Company Profiles
      1. 5.2.1 Thermo Fisher Scientific (US)
        1. 5.2.1.1 Financial Overview
        2. 5.2.1.2 Products Offered
        3. 5.2.1.3 Key Developments
        4. 5.2.1.4 SWOT Analysis
        5. 5.2.1.5 Key Strategies
      2. 5.2.2 Abbott Laboratories (US)
        1. 5.2.2.1 Financial Overview
        2. 5.2.2.2 Products Offered
        3. 5.2.2.3 Key Developments
        4. 5.2.2.4 SWOT Analysis
        5. 5.2.2.5 Key Strategies
      3. 5.2.3 PerkinElmer (US)
        1. 5.2.3.1 Financial Overview
        2. 5.2.3.2 Products Offered
        3. 5.2.3.3 Key Developments
        4. 5.2.3.4 SWOT Analysis
        5. 5.2.3.5 Key Strategies
      4. 5.2.4 Agilent Technologies (US)
        1. 5.2.4.1 Financial Overview
        2. 5.2.4.2 Products Offered
        3. 5.2.4.3 Key Developments
        4. 5.2.4.4 SWOT Analysis
        5. 5.2.4.5 Key Strategies
      5. 5.2.5 Waters Corporation (US)
        1. 5.2.5.1 Financial Overview
        2. 5.2.5.2 Products Offered
        3. 5.2.5.3 Key Developments
        4. 5.2.5.4 SWOT Analysis
        5. 5.2.5.5 Key Strategies
      6. 5.2.6 LabWare (GB)
        1. 5.2.6.1 Financial Overview
        2. 5.2.6.2 Products Offered
        3. 5.2.6.3 Key Developments
        4. 5.2.6.4 SWOT Analysis
        5. 5.2.6.5 Key Strategies
      7. 5.2.7 IDBS (GB)
        1. 5.2.7.1 Financial Overview
        2. 5.2.7.2 Products Offered
        3. 5.2.7.3 Key Developments
        4. 5.2.7.4 SWOT Analysis
        5. 5.2.7.5 Key Strategies
      8. 5.2.8 LabVantage Solutions (US)
        1. 5.2.8.1 Financial Overview
        2. 5.2.8.2 Products Offered
        3. 5.2.8.3 Key Developments
        4. 5.2.8.4 SWOT Analysis
        5. 5.2.8.5 Key Strategies
      9. 5.2.9 Siemens Healthineers (DE)
        1. 5.2.9.1 Financial Overview
        2. 5.2.9.2 Products Offered
        3. 5.2.9.3 Key Developments
        4. 5.2.9.4 SWOT Analysis
        5. 5.2.9.5 Key Strategies
    3. 5.3 Appendix
      1. 5.3.1 References
      2. 5.3.2 Related Reports
  6. 6 LIST OF FIGURES
    1. 6.1 MARKET SYNOPSIS
    2. 6.2 JAPAN MARKET ANALYSIS BY TYPE
    3. 6.3 JAPAN MARKET ANALYSIS BY DEPLOYMENT TYPE
    4. 6.4 JAPAN MARKET ANALYSIS BY END USER
    5. 6.5 JAPAN MARKET ANALYSIS BY APPLICATION
    6. 6.6 KEY BUYING CRITERIA OF PHARMACEUTICAL
    7. 6.7 RESEARCH PROCESS OF MRFR
    8. 6.8 DRO ANALYSIS OF PHARMACEUTICAL
    9. 6.9 DRIVERS IMPACT ANALYSIS: PHARMACEUTICAL
    10. 6.10 RESTRAINTS IMPACT ANALYSIS: PHARMACEUTICAL
    11. 6.11 SUPPLY / VALUE CHAIN: PHARMACEUTICAL
    12. 6.12 PHARMACEUTICAL, BY TYPE, 2024 (% SHARE)
    13. 6.13 PHARMACEUTICAL, BY TYPE, 2024 TO 2035 (USD Million)
    14. 6.14 PHARMACEUTICAL, BY DEPLOYMENT TYPE, 2024 (% SHARE)
    15. 6.15 PHARMACEUTICAL, BY DEPLOYMENT TYPE, 2024 TO 2035 (USD Million)
    16. 6.16 PHARMACEUTICAL, BY END USER, 2024 (% SHARE)
    17. 6.17 PHARMACEUTICAL, BY END USER, 2024 TO 2035 (USD Million)
    18. 6.18 PHARMACEUTICAL, BY APPLICATION, 2024 (% SHARE)
    19. 6.19 PHARMACEUTICAL, BY APPLICATION, 2024 TO 2035 (USD Million)
    20. 6.20 BENCHMARKING OF MAJOR COMPETITORS
  7. 7 LIST OF TABLES
    1. 7.1 LIST OF ASSUMPTIONS
  8. 7.1.1
    1. 7.2 Japan MARKET SIZE ESTIMATES; FORECAST
      1. 7.2.1 BY TYPE, 2025-2035 (USD Million)
      2. 7.2.2 BY DEPLOYMENT TYPE, 2025-2035 (USD Million)
      3. 7.2.3 BY END USER, 2025-2035 (USD Million)
      4. 7.2.4 BY APPLICATION, 2025-2035 (USD Million)
    2. 7.3 PRODUCT LAUNCH/PRODUCT DEVELOPMENT/APPROVAL
  9. 7.3.1
    1. 7.4 ACQUISITION/PARTNERSHIP
  10. 7.4.1

Japan Pharmaceutical Market Segmentation

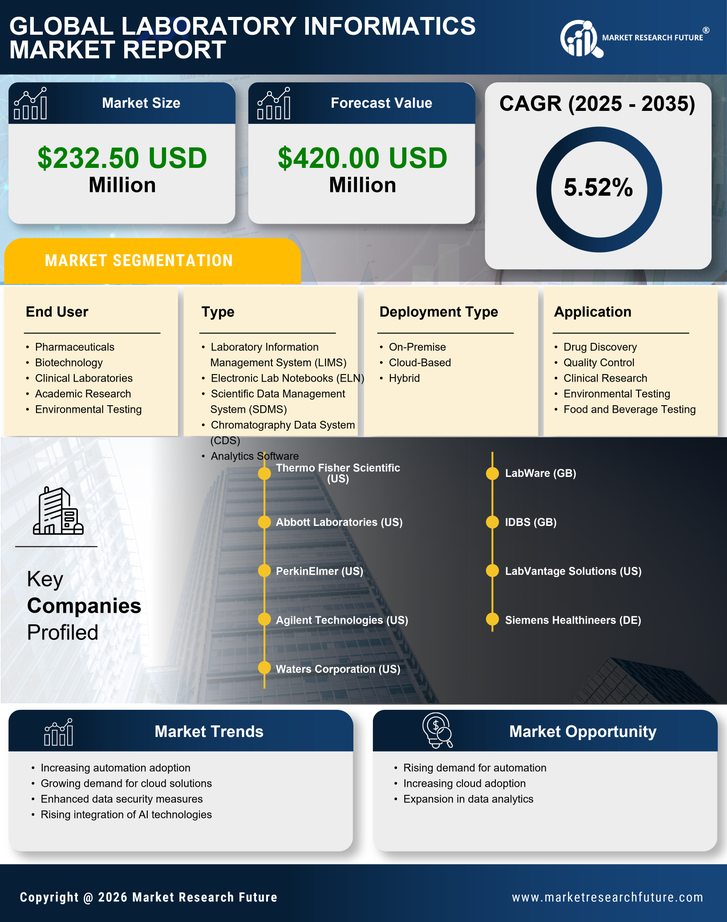
Pharmaceutical By Type (USD Million, 2025-2035)

  • Laboratory Information Management System (LIMS)
  • Electronic Lab Notebooks (ELN)
  • Scientific Data Management System (SDMS)
  • Chromatography Data System (CDS)
  • Analytics Software

Pharmaceutical By Deployment Type (USD Million, 2025-2035)

  • On-Premise
  • Cloud-Based
  • Hybrid

Pharmaceutical By End User (USD Million, 2025-2035)

  • Pharmaceuticals
  • Biotechnology
  • Clinical Laboratories
  • Academic Research
  • Environmental Testing

Pharmaceutical By Application (USD Million, 2025-2035)

  • Drug Discovery
  • Quality Control
  • Clinical Research
  • Environmental Testing
  • Food and Beverage Testing

Compare Licence

×
Features License Type
Single User Multiuser License Enterprise User
Price $4,950 $5,950 $7,250
Maximum User Access Limit 1 User Upto 10 Users Unrestricted Access Throughout the Organization
Free Customization
Direct Access to Analyst
Deliverable Format
Platform Access
Discount on Next Purchase 10% 15% 15%
Printable Versions