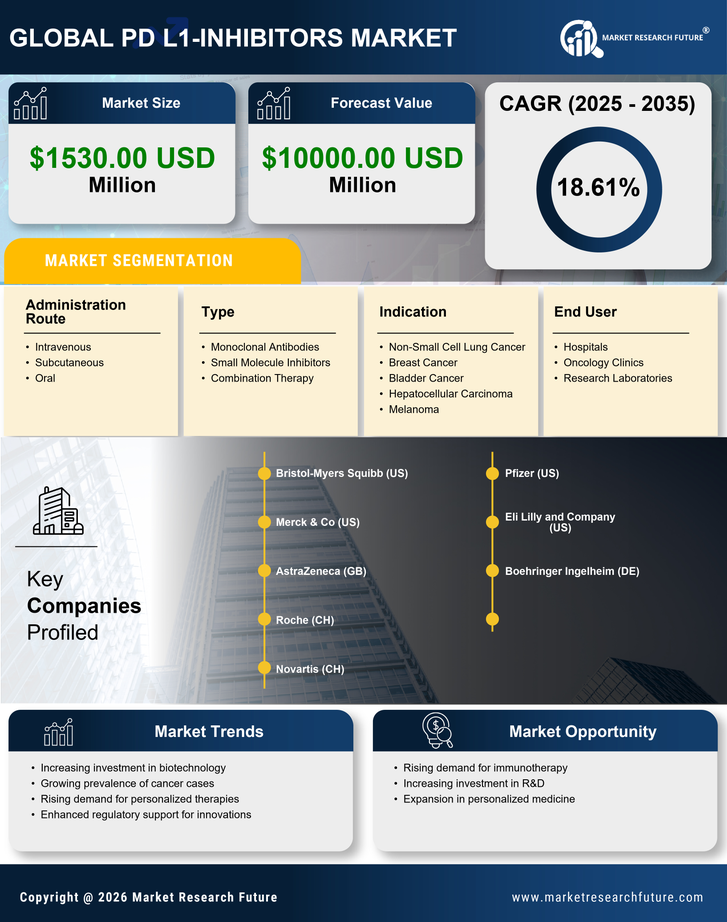
Request Free Sample ×

Kindly complete the form below to receive a free sample of this Report

* Please use a valid business email

Leading companies partner with us for data-driven Insights

clients tt-cursor
Hero Background

Italy PD-L1 Inhibitors Market

ID: MRFR/HC/50756-HCR
200 Pages
Nidhi Mandole
Last Updated: February 06, 2026

Italy PD-L1 Inhibitors Market Research Report By Type (Monoclonal Antibodies, Small Molecule Inhibitors, Combination Therapy), By Indication (Non-Small Cell Lung Cancer, Breast Cancer, Bladder Cancer, Hepatocellular Carcinoma, Melanoma), By Administration Route (Intravenous, Subcutaneous, Oral) andBy End User (Hospitals, Oncology Clinics, Research Laboratories) - Growth & Industry Forecast 2025 To 2035

Share:
Download PDF ×

We do not share your information with anyone. However, we may send you emails based on your report interest from time to time. You may contact us at any time to opt-out.

Italy PD-L1 Inhibitors Market Infographic
Purchase Options
  1. 1 SECTION I: EXECUTIVE SUMMARY AND KEY HIGHLIGHTS
    1. 1.1 EXECUTIVE SUMMARY
      1. 1.1.1 Market Overview
      2. 1.1.2 Key Findings
      3. 1.1.3 Market Segmentation
      4. 1.1.4 Competitive Landscape
      5. 1.1.5 Challenges and Opportunities
      6. 1.1.6 Future Outlook
  2. 2 SECTION II: SCOPING, METHODOLOGY AND MARKET STRUCTURE
    1. 2.1 MARKET INTRODUCTION
      1. 2.1.1 Definition
      2. 2.1.2 Scope of the study
        1. 2.1.2.1 Research Objective
        2. 2.1.2.2 Assumption
        3. 2.1.2.3 Limitations
    2. 2.2 RESEARCH METHODOLOGY
      1. 2.2.1 Overview
      2. 2.2.2 Data Mining
      3. 2.2.3 Secondary Research
      4. 2.2.4 Primary Research
        1. 2.2.4.1 Primary Interviews and Information Gathering Process
        2. 2.2.4.2 Breakdown of Primary Respondents
      5. 2.2.5 Forecasting Model
      6. 2.2.6 Market Size Estimation
        1. 2.2.6.1 Bottom-Up Approach
        2. 2.2.6.2 Top-Down Approach
      7. 2.2.7 Data Triangulation
      8. 2.2.8 Validation
  3. 3 SECTION III: QUALITATIVE ANALYSIS
    1. 3.1 MARKET DYNAMICS
      1. 3.1.1 Overview
      2. 3.1.2 Drivers
      3. 3.1.3 Restraints
      4. 3.1.4 Opportunities
    2. 3.2 MARKET FACTOR ANALYSIS
      1. 3.2.1 Value chain Analysis
      2. 3.2.2 Porter's Five Forces Analysis
        1. 3.2.2.1 Bargaining Power of Suppliers
        2. 3.2.2.2 Bargaining Power of Buyers
        3. 3.2.2.3 Threat of New Entrants
        4. 3.2.2.4 Threat of Substitutes
        5. 3.2.2.5 Intensity of Rivalry
      3. 3.2.3 COVID-19 Impact Analysis
        1. 3.2.3.1 Market Impact Analysis
        2. 3.2.3.2 Regional Impact
        3. 3.2.3.3 Opportunity and Threat Analysis
  4. 4 SECTION IV: QUANTITATIVE ANALYSIS
    1. 4.1 Chemicals and Materials, BY Type (USD Million)
      1. 4.1.1 Monoclonal Antibodies
      2. 4.1.2 Small Molecule Inhibitors
      3. 4.1.3 Combination Therapy
    2. 4.2 Chemicals and Materials, BY Indication (USD Million)
      1. 4.2.1 Non-Small Cell Lung Cancer
      2. 4.2.2 Breast Cancer
      3. 4.2.3 Bladder Cancer
      4. 4.2.4 Hepatocellular Carcinoma
      5. 4.2.5 Melanoma
    3. 4.3 Chemicals and Materials, BY Administration Route (USD Million)
      1. 4.3.1 Intravenous
      2. 4.3.2 Subcutaneous
      3. 4.3.3 Oral
    4. 4.4 Chemicals and Materials, BY End User (USD Million)
      1. 4.4.1 Hospitals
      2. 4.4.2 Oncology Clinics
      3. 4.4.3 Research Laboratories
  5. 5 SECTION V: COMPETITIVE ANALYSIS
    1. 5.1 Competitive Landscape
      1. 5.1.1 Overview
      2. 5.1.2 Competitive Analysis
      3. 5.1.3 Market share Analysis
      4. 5.1.4 Major Growth Strategy in the Chemicals and Materials
      5. 5.1.5 Competitive Benchmarking
      6. 5.1.6 Leading Players in Terms of Number of Developments in the Chemicals and Materials
      7. 5.1.7 Key developments and growth strategies
        1. 5.1.7.1 New Product Launch/Service Deployment
        2. 5.1.7.2 Merger & Acquisitions
        3. 5.1.7.3 Joint Ventures
      8. 5.1.8 Major Players Financial Matrix
        1. 5.1.8.1 Sales and Operating Income
        2. 5.1.8.2 Major Players R&D Expenditure. 2023
    2. 5.2 Company Profiles
      1. 5.2.1 Bristol-Myers Squibb (US)
        1. 5.2.1.1 Financial Overview
        2. 5.2.1.2 Products Offered
        3. 5.2.1.3 Key Developments
        4. 5.2.1.4 SWOT Analysis
        5. 5.2.1.5 Key Strategies
      2. 5.2.2 Merck & Co (US)
        1. 5.2.2.1 Financial Overview
        2. 5.2.2.2 Products Offered
        3. 5.2.2.3 Key Developments
        4. 5.2.2.4 SWOT Analysis
        5. 5.2.2.5 Key Strategies
      3. 5.2.3 AstraZeneca (GB)
        1. 5.2.3.1 Financial Overview
        2. 5.2.3.2 Products Offered
        3. 5.2.3.3 Key Developments
        4. 5.2.3.4 SWOT Analysis
        5. 5.2.3.5 Key Strategies
      4. 5.2.4 Roche (CH)
        1. 5.2.4.1 Financial Overview
        2. 5.2.4.2 Products Offered
        3. 5.2.4.3 Key Developments
        4. 5.2.4.4 SWOT Analysis
        5. 5.2.4.5 Key Strategies
      5. 5.2.5 Novartis (CH)
        1. 5.2.5.1 Financial Overview
        2. 5.2.5.2 Products Offered
        3. 5.2.5.3 Key Developments
        4. 5.2.5.4 SWOT Analysis
        5. 5.2.5.5 Key Strategies
      6. 5.2.6 Pfizer (US)
        1. 5.2.6.1 Financial Overview
        2. 5.2.6.2 Products Offered
        3. 5.2.6.3 Key Developments
        4. 5.2.6.4 SWOT Analysis
        5. 5.2.6.5 Key Strategies
      7. 5.2.7 Eli Lilly and Company (US)
        1. 5.2.7.1 Financial Overview
        2. 5.2.7.2 Products Offered
        3. 5.2.7.3 Key Developments
        4. 5.2.7.4 SWOT Analysis
        5. 5.2.7.5 Key Strategies
      8. 5.2.8 Boehringer Ingelheim (DE)
        1. 5.2.8.1 Financial Overview
        2. 5.2.8.2 Products Offered
        3. 5.2.8.3 Key Developments
        4. 5.2.8.4 SWOT Analysis
        5. 5.2.8.5 Key Strategies
    3. 5.3 Appendix
      1. 5.3.1 References
      2. 5.3.2 Related Reports
  6. 6 LIST OF FIGURES
    1. 6.1 MARKET SYNOPSIS
    2. 6.2 ITALY MARKET ANALYSIS BY TYPE
    3. 6.3 ITALY MARKET ANALYSIS BY INDICATION
    4. 6.4 ITALY MARKET ANALYSIS BY ADMINISTRATION ROUTE
    5. 6.5 ITALY MARKET ANALYSIS BY END USER
    6. 6.6 KEY BUYING CRITERIA OF CHEMICALS AND MATERIALS
    7. 6.7 RESEARCH PROCESS OF MRFR
    8. 6.8 DRO ANALYSIS OF CHEMICALS AND MATERIALS
    9. 6.9 DRIVERS IMPACT ANALYSIS: CHEMICALS AND MATERIALS
    10. 6.10 RESTRAINTS IMPACT ANALYSIS: CHEMICALS AND MATERIALS
    11. 6.11 SUPPLY / VALUE CHAIN: CHEMICALS AND MATERIALS
    12. 6.12 CHEMICALS AND MATERIALS, BY TYPE, 2024 (% SHARE)
    13. 6.13 CHEMICALS AND MATERIALS, BY TYPE, 2024 TO 2035 (USD Million)
    14. 6.14 CHEMICALS AND MATERIALS, BY INDICATION, 2024 (% SHARE)
    15. 6.15 CHEMICALS AND MATERIALS, BY INDICATION, 2024 TO 2035 (USD Million)
    16. 6.16 CHEMICALS AND MATERIALS, BY ADMINISTRATION ROUTE, 2024 (% SHARE)
    17. 6.17 CHEMICALS AND MATERIALS, BY ADMINISTRATION ROUTE, 2024 TO 2035 (USD Million)
    18. 6.18 CHEMICALS AND MATERIALS, BY END USER, 2024 (% SHARE)
    19. 6.19 CHEMICALS AND MATERIALS, BY END USER, 2024 TO 2035 (USD Million)
    20. 6.20 BENCHMARKING OF MAJOR COMPETITORS
  7. 7 LIST OF TABLES
    1. 7.1 LIST OF ASSUMPTIONS
  8. 7.1.1
    1. 7.2 Italy MARKET SIZE ESTIMATES; FORECAST
      1. 7.2.1 BY TYPE, 2025-2035 (USD Million)
      2. 7.2.2 BY INDICATION, 2025-2035 (USD Million)
      3. 7.2.3 BY ADMINISTRATION ROUTE, 2025-2035 (USD Million)
      4. 7.2.4 BY END USER, 2025-2035 (USD Million)
    2. 7.3 PRODUCT LAUNCH/PRODUCT DEVELOPMENT/APPROVAL
  9. 7.3.1
    1. 7.4 ACQUISITION/PARTNERSHIP
  10. 7.4.1

Italy Chemicals and Materials Market Segmentation

Chemicals and Materials By Type (USD Million, 2025-2035)

  • Monoclonal Antibodies
  • Small Molecule Inhibitors
  • Combination Therapy

Chemicals and Materials By Indication (USD Million, 2025-2035)

  • Non-Small Cell Lung Cancer
  • Breast Cancer
  • Bladder Cancer
  • Hepatocellular Carcinoma
  • Melanoma

Chemicals and Materials By Administration Route (USD Million, 2025-2035)

  • Intravenous
  • Subcutaneous
  • Oral

Chemicals and Materials By End User (USD Million, 2025-2035)

  • Hospitals
  • Oncology Clinics
  • Research Laboratories

Compare Licence

×
Features License Type
Single User Multiuser License Enterprise User
Price $4,950 $5,950 $7,250
Maximum User Access Limit 1 User Upto 10 Users Unrestricted Access Throughout the Organization
Free Customization
Direct Access to Analyst
Deliverable Format
Platform Access
Discount on Next Purchase 10% 15% 15%
Printable Versions