ITaly Cold Chain Monitoring Market

ID: MRFR/SEM/53142-HCR
200 Pages
Nirmit Biswas
Last Updated: April 24, 2026
Italy Cold Chain Monitoring Market Size, Share and Research Report By Application (Pharmaceuticals, Food and Beverages, Chemicals, Healthcare, Agriculture), By Product Type (Hardware, Software, Services), By Technology (Temperature Monitoring, Humidity Monitoring, Location Tracking, Data Loggers) and By End Use (Retail, Transportation, Warehousing, Distribution)- Industry Forecast Till 2035
Download PDF ×

We do not share your information with anyone. However, we may send you emails based on your report interest from time to time. You may contact us at any time to opt-out.

ITaly Cold Chain Monitoring Market

Market Size

Forecast Period2025 - 2035
CAGR (2025 - 2035)11.4%
2024 Market Size$ 116.45 Million
2025 Market Size$ 129.72 Million
2035 Market Size$ 382 Million

Key Players

Thermo Fisher Scientific
Sensitech
Zebra Technologies
Monnit Corporation
Berlinger & Co. AG
Emerson Electric Co.
Opportunities
  • Rising Demand for Perishable Goods
  • Expansion of the Pharmaceutical Sector
  • Increased Focus on Food Safety Standards
  1. 1 SECTION I: EXECUTIVE SUMMARY AND KEY HIGHLIGHTS
    1. 1.1 EXECUTIVE SUMMARY
      1. 1.1.1 Market Overview
      2. 1.1.2 Key Findings
      3. 1.1.3 Market Segmentation
      4. 1.1.4 Competitive Landscape
      5. 1.1.5 Challenges and Opportunities
      6. 1.1.6 Future Outlook
  2. 2 SECTION II: SCOPING, METHODOLOGY AND MARKET STRUCTURE
    1. 2.1 MARKET INTRODUCTION
      1. 2.1.1 Definition
      2. 2.1.2 Scope of the study
        1. 2.1.2.1 Research Objective
        2. 2.1.2.2 Assumption
        3. 2.1.2.3 Limitations
    2. 2.2 RESEARCH METHODOLOGY
      1. 2.2.1 Overview
      2. 2.2.2 Data Mining
      3. 2.2.3 Secondary Research
      4. 2.2.4 Primary Research
        1. 2.2.4.1 Primary Interviews and Information Gathering Process
        2. 2.2.4.2 Breakdown of Primary Respondents
      5. 2.2.5 Forecasting Model
      6. 2.2.6 Market Size Estimation
        1. 2.2.6.1 Bottom-Up Approach
        2. 2.2.6.2 Top-Down Approach
      7. 2.2.7 Data Triangulation
      8. 2.2.8 Validation
  3. 3 SECTION III: QUALITATIVE ANALYSIS
    1. 3.1 MARKET DYNAMICS
      1. 3.1.1 Overview
      2. 3.1.2 Drivers
      3. 3.1.3 Restraints
      4. 3.1.4 Opportunities
    2. 3.2 MARKET FACTOR ANALYSIS
      1. 3.2.1 Value chain Analysis
      2. 3.2.2 Porter's Five Forces Analysis
        1. 3.2.2.1 Bargaining Power of Suppliers
        2. 3.2.2.2 Bargaining Power of Buyers
        3. 3.2.2.3 Threat of New Entrants
        4. 3.2.2.4 Threat of Substitutes
        5. 3.2.2.5 Intensity of Rivalry
      3. 3.2.3 COVID-19 Impact Analysis
        1. 3.2.3.1 Market Impact Analysis
        2. 3.2.3.2 Regional Impact
        3. 3.2.3.3 Opportunity and Threat Analysis
  4. 4 SECTION IV: QUANTITATIVE ANALYSIS
    1. 4.1 Semiconductor & Electronics, BY Application (USD Million)
      1. 4.1.1 Pharmaceuticals
      2. 4.1.2 Food and Beverages
      3. 4.1.3 Chemicals
      4. 4.1.4 Healthcare
      5. 4.1.5 Agriculture
    2. 4.2 Semiconductor & Electronics, BY Product Type (USD Million)
      1. 4.2.1 Hardware
      2. 4.2.2 Software
      3. 4.2.3 Services
    3. 4.3 Semiconductor & Electronics, BY Technology (USD Million)
      1. 4.3.1 Temperature Monitoring
      2. 4.3.2 Humidity Monitoring
      3. 4.3.3 Location Tracking
      4. 4.3.4 Data Loggers
    4. 4.4 Semiconductor & Electronics, BY End Use (USD Million)
      1. 4.4.1 Retail
      2. 4.4.2 Transportation
      3. 4.4.3 Warehousing
      4. 4.4.4 Distribution
  5. 5 SECTION V: COMPETITIVE ANALYSIS
    1. 5.1 Competitive Landscape
      1. 5.1.1 Overview
      2. 5.1.2 Competitive Analysis
      3. 5.1.3 Market share Analysis
      4. 5.1.4 Major Growth Strategy in the Semiconductor & Electronics
      5. 5.1.5 Competitive Benchmarking
      6. 5.1.6 Leading Players in Terms of Number of Developments in the Semiconductor & Electronics
      7. 5.1.7 Key developments and growth strategies
        1. 5.1.7.1 New Product Launch/Service Deployment
        2. 5.1.7.2 Merger & Acquisitions
        3. 5.1.7.3 Joint Ventures
      8. 5.1.8 Major Players Financial Matrix
        1. 5.1.8.1 Sales and Operating Income
        2. 5.1.8.2 Major Players R&D Expenditure. 2023
    2. 5.2 Company Profiles
      1. 5.2.1 Thermo Fisher Scientific (US)
        1. 5.2.1.1 Financial Overview
        2. 5.2.1.2 Products Offered
        3. 5.2.1.3 Key Developments
        4. 5.2.1.4 SWOT Analysis
        5. 5.2.1.5 Key Strategies
      2. 5.2.2 Sensitech (US)
        1. 5.2.2.1 Financial Overview
        2. 5.2.2.2 Products Offered
        3. 5.2.2.3 Key Developments
        4. 5.2.2.4 SWOT Analysis
        5. 5.2.2.5 Key Strategies
      3. 5.2.3 Zebra Technologies (US)
        1. 5.2.3.1 Financial Overview
        2. 5.2.3.2 Products Offered
        3. 5.2.3.3 Key Developments
        4. 5.2.3.4 SWOT Analysis
        5. 5.2.3.5 Key Strategies
      4. 5.2.4 Monnit Corporation (US)
        1. 5.2.4.1 Financial Overview
        2. 5.2.4.2 Products Offered
        3. 5.2.4.3 Key Developments
        4. 5.2.4.4 SWOT Analysis
        5. 5.2.4.5 Key Strategies
      5. 5.2.5 Berlinger & Co. AG (CH)
        1. 5.2.5.1 Financial Overview
        2. 5.2.5.2 Products Offered
        3. 5.2.5.3 Key Developments
        4. 5.2.5.4 SWOT Analysis
        5. 5.2.5.5 Key Strategies
      6. 5.2.6 Emerson Electric Co. (US)
        1. 5.2.6.1 Financial Overview
        2. 5.2.6.2 Products Offered
        3. 5.2.6.3 Key Developments
        4. 5.2.6.4 SWOT Analysis
        5. 5.2.6.5 Key Strategies
      7. 5.2.7 DHL Supply Chain (DE)
        1. 5.2.7.1 Financial Overview
        2. 5.2.7.2 Products Offered
        3. 5.2.7.3 Key Developments
        4. 5.2.7.4 SWOT Analysis
        5. 5.2.7.5 Key Strategies
      8. 5.2.8 Controlant (IS)
        1. 5.2.8.1 Financial Overview
        2. 5.2.8.2 Products Offered
        3. 5.2.8.3 Key Developments
        4. 5.2.8.4 SWOT Analysis
        5. 5.2.8.5 Key Strategies
    3. 5.3 Appendix
      1. 5.3.1 References
      2. 5.3.2 Related Reports
  6. 6 LIST OF FIGURES
    1. 6.1 MARKET SYNOPSIS
    2. 6.2 ITALY MARKET ANALYSIS BY APPLICATION
    3. 6.3 ITALY MARKET ANALYSIS BY PRODUCT TYPE
    4. 6.4 ITALY MARKET ANALYSIS BY TECHNOLOGY
    5. 6.5 ITALY MARKET ANALYSIS BY END USE
    6. 6.6 KEY BUYING CRITERIA OF SEMICONDUCTOR & ELECTRONICS
    7. 6.7 RESEARCH PROCESS OF MRFR
    8. 6.8 DRO ANALYSIS OF SEMICONDUCTOR & ELECTRONICS
    9. 6.9 DRIVERS IMPACT ANALYSIS: SEMICONDUCTOR & ELECTRONICS
    10. 6.10 RESTRAINTS IMPACT ANALYSIS: SEMICONDUCTOR & ELECTRONICS
    11. 6.11 SUPPLY / VALUE CHAIN: SEMICONDUCTOR & ELECTRONICS
    12. 6.12 SEMICONDUCTOR & ELECTRONICS, BY APPLICATION, 2024 (% SHARE)
    13. 6.13 SEMICONDUCTOR & ELECTRONICS, BY APPLICATION, 2024 TO 2035 (USD Million)
    14. 6.14 SEMICONDUCTOR & ELECTRONICS, BY PRODUCT TYPE, 2024 (% SHARE)
    15. 6.15 SEMICONDUCTOR & ELECTRONICS, BY PRODUCT TYPE, 2024 TO 2035 (USD Million)
    16. 6.16 SEMICONDUCTOR & ELECTRONICS, BY TECHNOLOGY, 2024 (% SHARE)
    17. 6.17 SEMICONDUCTOR & ELECTRONICS, BY TECHNOLOGY, 2024 TO 2035 (USD Million)
    18. 6.18 SEMICONDUCTOR & ELECTRONICS, BY END USE, 2024 (% SHARE)
    19. 6.19 SEMICONDUCTOR & ELECTRONICS, BY END USE, 2024 TO 2035 (USD Million)
    20. 6.20 BENCHMARKING OF MAJOR COMPETITORS
  7. 7 LIST OF TABLES
    1. 7.1 LIST OF ASSUMPTIONS
  8. 7.1.1
    1. 7.2 Italy MARKET SIZE ESTIMATES; FORECAST
      1. 7.2.1 BY APPLICATION, 2025-2035 (USD Million)
      2. 7.2.2 BY PRODUCT TYPE, 2025-2035 (USD Million)
      3. 7.2.3 BY TECHNOLOGY, 2025-2035 (USD Million)
      4. 7.2.4 BY END USE, 2025-2035 (USD Million)
    2. 7.3 PRODUCT LAUNCH/PRODUCT DEVELOPMENT/APPROVAL
  9. 7.3.1
    1. 7.4 ACQUISITION/PARTNERSHIP
  10. 7.4.1

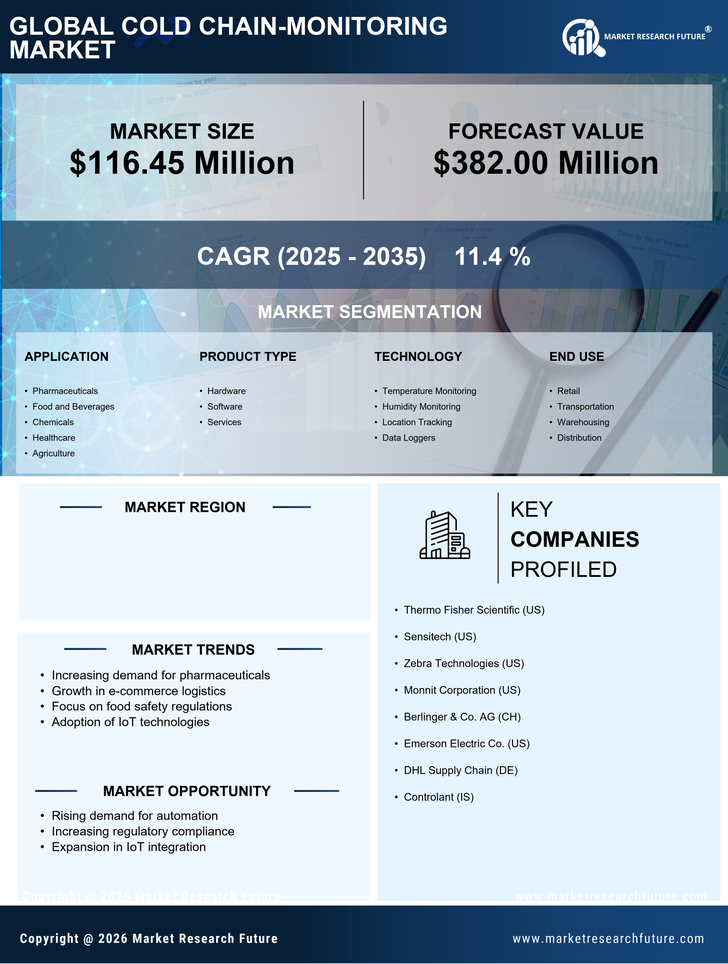
Italy ITaly Cold Chain Monitoring Market Segmentation

ITaly Cold Chain Monitoring Market By Application (USD Million, 2025-2035)

  • Pharmaceuticals
  • Food and Beverages
  • Chemicals
  • Healthcare
  • Agriculture

ITaly Cold Chain Monitoring Market By Product Type (USD Million, 2025-2035)

  • Hardware
  • Software
  • Services

ITaly Cold Chain Monitoring Market By Technology (USD Million, 2025-2035)

  • Temperature Monitoring
  • Humidity Monitoring
  • Location Tracking
  • Data Loggers

ITaly Cold Chain Monitoring Market By End Use (USD Million, 2025-2035)

  • Retail
  • Transportation
  • Warehousing
  • Distribution