Request Free Sample ×

Kindly complete the form below to receive a free sample of this Report

* Please use a valid business email

Leading companies partner with us for data-driven Insights

clients tt-cursor
Hero Background

Italy Biologics Market

ID: MRFR/HC/43088-HCR
200 Pages
Vikita Thakur
Last Updated: April 06, 2026

Italy Biologics Market Research Report: By Product Service (Monoclonal Antibody, Interleukins, Vaccines, Growth Factors, Gene Therapy, Others) and By Disease Indication (Rheumatoid Arthritis, Psoriasis/Psoriatic Arthritis, Cancer, Diabetes, Others) - Growth & Industry Forecast 2025 To 2035

Share:
Download PDF ×

We do not share your information with anyone. However, we may send you emails based on your report interest from time to time. You may contact us at any time to opt-out.

Italy Biologics Market Infographic
Purchase Options
  1. 1 SECTION I: EXECUTIVE SUMMARY AND KEY HIGHLIGHTS
    1. 1.1 EXECUTIVE SUMMARY
      1. 1.1.1 Market Overview
      2. 1.1.2 Key Findings
      3. 1.1.3 Market Segmentation
      4. 1.1.4 Competitive Landscape
      5. 1.1.5 Challenges and Opportunities
      6. 1.1.6 Future Outlook
  2. 2 SECTION II: SCOPING, METHODOLOGY AND MARKET STRUCTURE
    1. 2.1 MARKET INTRODUCTION
      1. 2.1.1 Definition
      2. 2.1.2 Scope of the study
        1. 2.1.2.1 Research Objective
        2. 2.1.2.2 Assumption
        3. 2.1.2.3 Limitations
    2. 2.2 RESEARCH METHODOLOGY
      1. 2.2.1 Overview
      2. 2.2.2 Data Mining
      3. 2.2.3 Secondary Research
      4. 2.2.4 Primary Research
        1. 2.2.4.1 Primary Interviews and Information Gathering Process
        2. 2.2.4.2 Breakdown of Primary Respondents
      5. 2.2.5 Forecasting Model
      6. 2.2.6 Market Size Estimation
        1. 2.2.6.1 Bottom-Up Approach
        2. 2.2.6.2 Top-Down Approach
      7. 2.2.7 Data Triangulation
      8. 2.2.8 Validation
  3. 3 SECTION III: QUALITATIVE ANALYSIS
    1. 3.1 MARKET DYNAMICS
      1. 3.1.1 Overview
      2. 3.1.2 Drivers
      3. 3.1.3 Restraints
      4. 3.1.4 Opportunities
    2. 3.2 MARKET FACTOR ANALYSIS
      1. 3.2.1 Value chain Analysis
      2. 3.2.2 Porter's Five Forces Analysis
        1. 3.2.2.1 Bargaining Power of Suppliers
        2. 3.2.2.2 Bargaining Power of Buyers
        3. 3.2.2.3 Threat of New Entrants
        4. 3.2.2.4 Threat of Substitutes
        5. 3.2.2.5 Intensity of Rivalry
      3. 3.2.3 COVID-19 Impact Analysis
        1. 3.2.3.1 Market Impact Analysis
        2. 3.2.3.2 Regional Impact
        3. 3.2.3.3 Opportunity and Threat Analysis
  4. 4 SECTION IV: QUANTITATIVE ANALYSIS
    1. 4.1 Life Sciences, BY Type (USD Billion)
      1. 4.1.1 Monoclonal Antibodies
      2. 4.1.2 Vaccines
      3. 4.1.3 Cell and Gene Therapy
      4. 4.1.4 Recombinant Proteins
      5. 4.1.5 Hormones
    2. 4.2 Life Sciences, BY Application (USD Billion)
      1. 4.2.1 Oncology
      2. 4.2.2 Infectious Diseases
      3. 4.2.3 Autoimmune Disorders
      4. 4.2.4 Cardiovascular Diseases
      5. 4.2.5 Neurological Disorders
    3. 4.3 Life Sciences, BY End User (USD Billion)
      1. 4.3.1 Hospitals
      2. 4.3.2 Pharmaceutical Companies
      3. 4.3.3 Research Institutes
      4. 4.3.4 Diagnostics Laboratories
    4. 4.4 Life Sciences, BY Source (USD Billion)
      1. 4.4.1 Microbial
      2. 4.4.2 Mammalian
      3. 4.4.3 Plant
      4. 4.4.4 Transgenic Animals
  5. 5 SECTION V: COMPETITIVE ANALYSIS
    1. 5.1 Competitive Landscape
      1. 5.1.1 Overview
      2. 5.1.2 Competitive Analysis
      3. 5.1.3 Market share Analysis
      4. 5.1.4 Major Growth Strategy in the Life Sciences
      5. 5.1.5 Competitive Benchmarking
      6. 5.1.6 Leading Players in Terms of Number of Developments in the Life Sciences
      7. 5.1.7 Key developments and growth strategies
        1. 5.1.7.1 New Product Launch/Service Deployment
        2. 5.1.7.2 Merger & Acquisitions
        3. 5.1.7.3 Joint Ventures
      8. 5.1.8 Major Players Financial Matrix
        1. 5.1.8.1 Sales and Operating Income
        2. 5.1.8.2 Major Players R&D Expenditure. 2023
    2. 5.2 Company Profiles
      1. 5.2.1 AbbVie (US)
        1. 5.2.1.1 Financial Overview
        2. 5.2.1.2 Products Offered
        3. 5.2.1.3 Key Developments
        4. 5.2.1.4 SWOT Analysis
        5. 5.2.1.5 Key Strategies
      2. 5.2.2 Roche (CH)
        1. 5.2.2.1 Financial Overview
        2. 5.2.2.2 Products Offered
        3. 5.2.2.3 Key Developments
        4. 5.2.2.4 SWOT Analysis
        5. 5.2.2.5 Key Strategies
      3. 5.2.3 Amgen (US)
        1. 5.2.3.1 Financial Overview
        2. 5.2.3.2 Products Offered
        3. 5.2.3.3 Key Developments
        4. 5.2.3.4 SWOT Analysis
        5. 5.2.3.5 Key Strategies
      4. 5.2.4 Johnson & Johnson (US)
        1. 5.2.4.1 Financial Overview
        2. 5.2.4.2 Products Offered
        3. 5.2.4.3 Key Developments
        4. 5.2.4.4 SWOT Analysis
        5. 5.2.4.5 Key Strategies
      5. 5.2.5 Novartis (CH)
        1. 5.2.5.1 Financial Overview
        2. 5.2.5.2 Products Offered
        3. 5.2.5.3 Key Developments
        4. 5.2.5.4 SWOT Analysis
        5. 5.2.5.5 Key Strategies
      6. 5.2.6 Sanofi (FR)
        1. 5.2.6.1 Financial Overview
        2. 5.2.6.2 Products Offered
        3. 5.2.6.3 Key Developments
        4. 5.2.6.4 SWOT Analysis
        5. 5.2.6.5 Key Strategies
      7. 5.2.7 Bristol-Myers Squibb (US)
        1. 5.2.7.1 Financial Overview
        2. 5.2.7.2 Products Offered
        3. 5.2.7.3 Key Developments
        4. 5.2.7.4 SWOT Analysis
        5. 5.2.7.5 Key Strategies
      8. 5.2.8 Gilead Sciences (US)
        1. 5.2.8.1 Financial Overview
        2. 5.2.8.2 Products Offered
        3. 5.2.8.3 Key Developments
        4. 5.2.8.4 SWOT Analysis
        5. 5.2.8.5 Key Strategies
      9. 5.2.9 Merck & Co. (US)
        1. 5.2.9.1 Financial Overview
        2. 5.2.9.2 Products Offered
        3. 5.2.9.3 Key Developments
        4. 5.2.9.4 SWOT Analysis
        5. 5.2.9.5 Key Strategies
    3. 5.3 Appendix
      1. 5.3.1 References
      2. 5.3.2 Related Reports
  6. 6 LIST OF FIGURES
    1. 6.1 MARKET SYNOPSIS
    2. 6.2 ITALY MARKET ANALYSIS BY TYPE
    3. 6.3 ITALY MARKET ANALYSIS BY APPLICATION
    4. 6.4 ITALY MARKET ANALYSIS BY END USER
    5. 6.5 ITALY MARKET ANALYSIS BY SOURCE
    6. 6.6 KEY BUYING CRITERIA OF LIFE SCIENCES
    7. 6.7 RESEARCH PROCESS OF MRFR
    8. 6.8 DRO ANALYSIS OF LIFE SCIENCES
    9. 6.9 DRIVERS IMPACT ANALYSIS: LIFE SCIENCES
    10. 6.10 RESTRAINTS IMPACT ANALYSIS: LIFE SCIENCES
    11. 6.11 SUPPLY / VALUE CHAIN: LIFE SCIENCES
    12. 6.12 LIFE SCIENCES, BY TYPE, 2024 (% SHARE)
    13. 6.13 LIFE SCIENCES, BY TYPE, 2024 TO 2035 (USD Billion)
    14. 6.14 LIFE SCIENCES, BY APPLICATION, 2024 (% SHARE)
    15. 6.15 LIFE SCIENCES, BY APPLICATION, 2024 TO 2035 (USD Billion)
    16. 6.16 LIFE SCIENCES, BY END USER, 2024 (% SHARE)
    17. 6.17 LIFE SCIENCES, BY END USER, 2024 TO 2035 (USD Billion)
    18. 6.18 LIFE SCIENCES, BY SOURCE, 2024 (% SHARE)
    19. 6.19 LIFE SCIENCES, BY SOURCE, 2024 TO 2035 (USD Billion)
    20. 6.20 BENCHMARKING OF MAJOR COMPETITORS
  7. 7 LIST OF TABLES
    1. 7.1 LIST OF ASSUMPTIONS
  8. 7.1.1
    1. 7.2 Italy MARKET SIZE ESTIMATES; FORECAST
      1. 7.2.1 BY TYPE, 2025-2035 (USD Billion)
      2. 7.2.2 BY APPLICATION, 2025-2035 (USD Billion)
      3. 7.2.3 BY END USER, 2025-2035 (USD Billion)
      4. 7.2.4 BY SOURCE, 2025-2035 (USD Billion)
    2. 7.3 PRODUCT LAUNCH/PRODUCT DEVELOPMENT/APPROVAL
  9. 7.3.1
    1. 7.4 ACQUISITION/PARTNERSHIP
  10. 7.4.1

Italy Life Sciences Market Segmentation

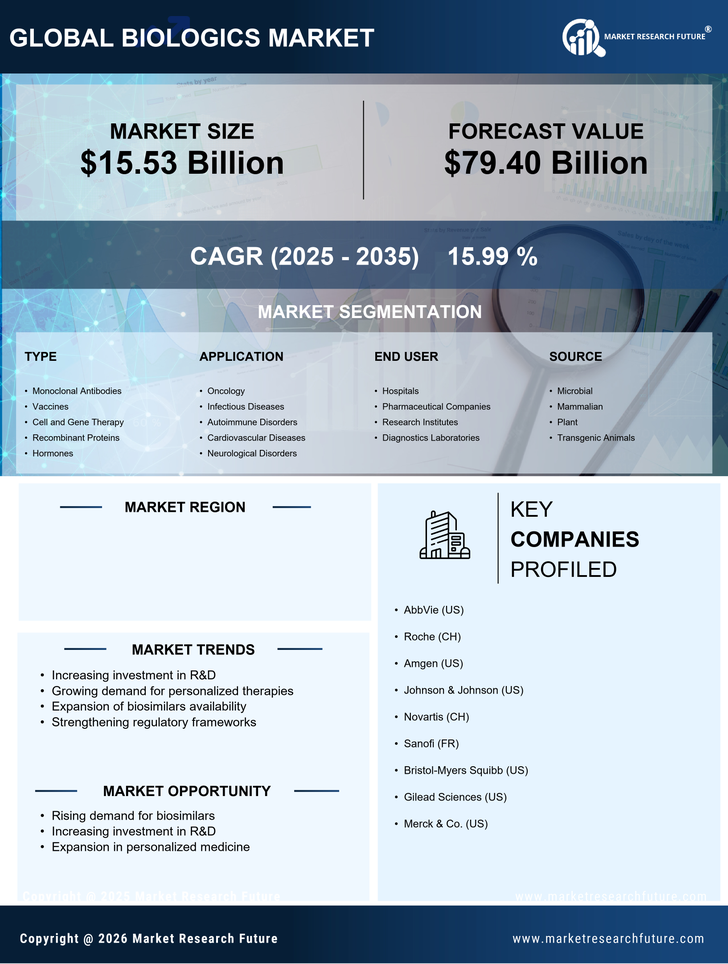
Life Sciences By Type (USD Billion, 2025-2035)

  • Monoclonal Antibodies
  • Vaccines
  • Cell and Gene Therapy
  • Recombinant Proteins
  • Hormones

Life Sciences By Application (USD Billion, 2025-2035)

  • Oncology
  • Infectious Diseases
  • Autoimmune Disorders
  • Cardiovascular Diseases
  • Neurological Disorders

Life Sciences By End User (USD Billion, 2025-2035)

  • Hospitals
  • Pharmaceutical Companies
  • Research Institutes
  • Diagnostics Laboratories

Life Sciences By Source (USD Billion, 2025-2035)

  • Microbial
  • Mammalian
  • Plant
  • Transgenic Animals

Compare Licence

×
Features License Type
Single User Multiuser License Enterprise User
Price $4,950 $5,950 $7,250
Maximum User Access Limit 1 User Upto 10 Users Unrestricted Access Throughout the Organization
Free Customization
Direct Access to Analyst
Deliverable Format
Platform Access
Discount on Next Purchase 10% 15% 15%
Printable Versions