IoT in Transportation Market (2026 – 2035)

ID: MRFR/ICT/31935-HCR 128 Pages Aarti Dhapte Last Updated: October 17, 2026
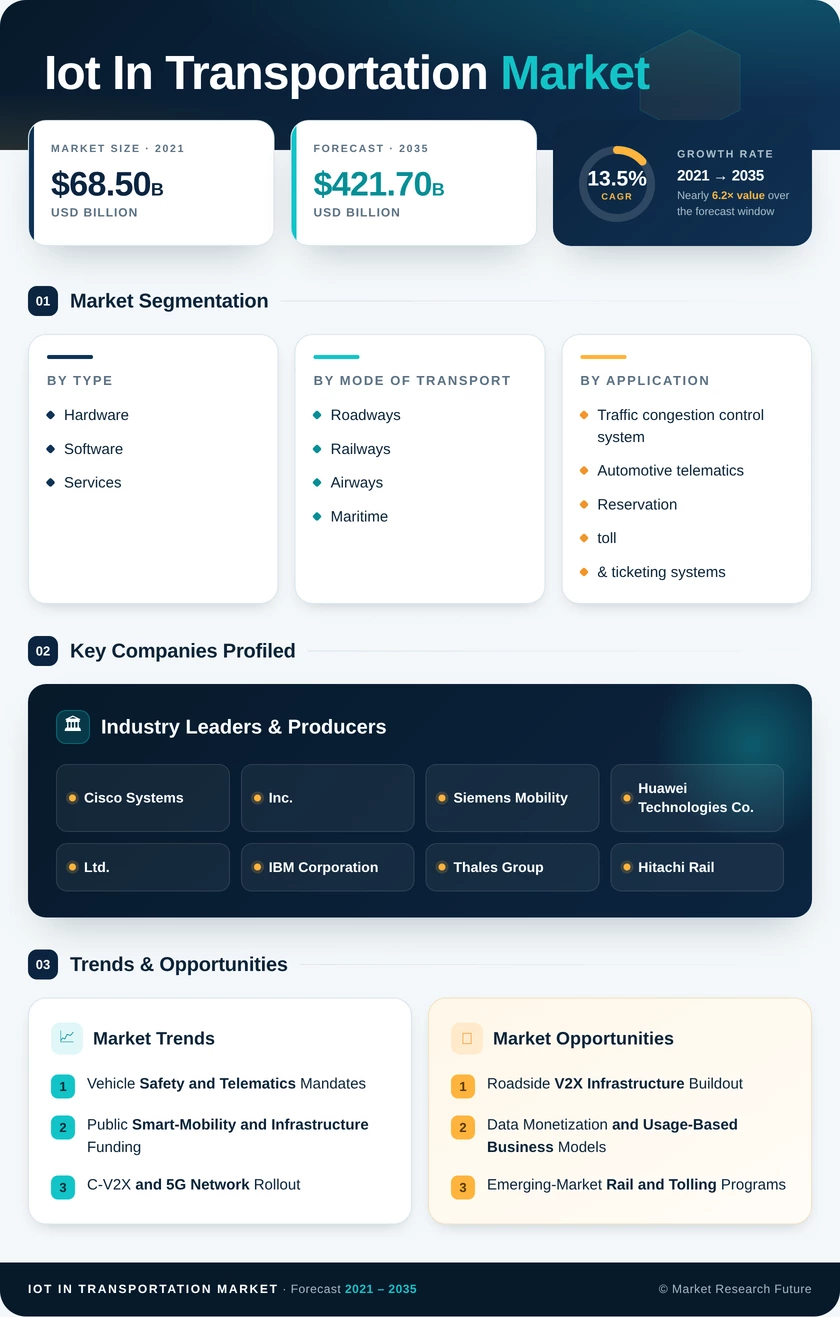
IoT in Transportation Market Size, Share and Research Report By Type (Hardware, Software, and Services), By Mode of Transport (Roadways, Railways, Airways, and Maritime), By Application (Traffic Congestion Control System, Automotive Telematics, Reservation, Toll, & Ticketing Systems, Security and Surveillance System, Remote Monitoring, and Other Applications), And By Region (North America, Europe, Asia-Pacific, And Rest Of The World) – Industry Forecast Till 2035
IoT in Transportation Market
Market Size
Forecast Period2026-2035
CAGR (2026-2035)13.5%
2025 Market SizeUSD 118.4 Billion
2035 Market SizeUSD 421.7 Billion
Key Players
Cisco Systems, Inc.
Siemens Mobility
Huawei Technologies Co., Ltd.
IBM Corporation
Thales Group
Hitachi Rail
Opportunities
  • Roadside V2X Infrastructure Buildout
  • Data Monetization and Usage-Based Business Models
  • Emerging-Market Rail and Tolling Programs
  1. 1 Market Summary | |
  2. 2 Key Report Takeaways | |
    1. 2.1 By Type | |
    2. 2.2 By Mode of Transport | |
    3. 2.3 By Application | |
    4. 2.4 By Region | |
  3. 3 Market Size and Forecast (2021–2035) | |
  4. 4 Driver Impact Analysis | |
    1. 4.1 Vehicle Safety and Telematics Mandates | |
    2. 4.2 Public Smart-Mobility and Infrastructure Funding | |
    3. 4.3 C-V2X and 5G Network Rollout | |
    4. 4.4 Logistics Visibility and Cold-Chain Demand | |
    5. 4.5 Electronic Tolling and Digital Ticketing | |
    6. 4.6 Rail Signalling and Maintenance Digitalization | |
  5. 5 Restraints Impact Analysis | |
    1. 5.1 Cybersecurity and Data Privacy Exposure | |
    2. 5.2 High Deployment and Integration Costs | |
    3. 5.3 Fragmented Standards and Interoperability Gaps | |
    4. 5.4 Connectivity Gaps on Rural Roads and at Sea | |
    5. 5.5 Semiconductor and Component Supply Volatility | |
  6. 6 Opportunities | |
    1. 6.1 Roadside V2X Infrastructure Buildout | |
    2. 6.2 Data Monetization and Usage-Based Business Models | |
    3. 6.3 Emerging-Market Rail and Tolling Programs | |
    4. 6.4 Port and Maritime Digitalization | |
    5. 6.5 Edge AI for Public Transit Safety and Operations | |
  7. 7 Regional Market Share and Country-Level Analysis | |
    1. 7.1 North America | | |
      1. 7.1.1 United States | | |
      2. 7.1.2 Canada | |
    2. 7.2 Europe | | |
      1. 7.2.1 United Kingdom | | |
      2. 7.2.2 Germany | | |
      3. 7.2.3 France | | |
      4. 7.2.4 Rest of Europe | |
    3. 7.3 Asia-Pacific | | |
      1. 7.3.1 China | | |
      2. 7.3.2 India | | |
      3. 7.3.3 Japan | | |
      4. 7.3.4 Rest of Asia-Pacific | |
    4. 7.4 Latin America | |
    5. 7.5 Middle East and Africa | |
  8. 8 Future Outlook (2026–2035) | |
    1. 8.1 AI and Autonomous Operations | |
    2. 8.2 Electrification Raises Connected Content per Vehicle | |
    3. 8.3 Platform Economics and Software-Defined Vehicles | |
    4. 8.4 Emissions Reporting and ESG Accountability | |
  9. 9 Segmentation Analysis | |
    1. 9.1 By Type | | |
      1. 9.1.1 Hardware | | |
      2. 9.1.2 Software | | |
      3. 9.1.3 Services | |
    2. 9.2 By Mode of Transport | | |
      1. 9.2.1 Roadways | | |
      2. 9.2.2 Railways | | |
      3. 9.2.3 Airways | | |
      4. 9.2.4 Maritime | |
    3. 9.3 By Application | | |
      1. 9.3.1 Traffic congestion control system | | |
      2. 9.3.2 Automotive telematics | | |
      3. 9.3.3 Reservation, toll, & ticketing systems | | |
      4. 9.3.4 Security and surveillance system | | |
      5. 9.3.5 Remote monitoring | | |
      6. 9.3.6 Other Applications | |
  10. 10 Competitive Landscape | |
  11. 11 Recent News & Developments | |
  12. 12 Report Scope and Methodology | |
  13. 13 Detailed Sources and Citations | |
  14. 14 Frequently Asked Questions (FAQs) | | LIST OF TABLES | |
  15. TABLE 1 Report Snapshot – Key Market Metrics | |
  16. TABLE 2 Global Market Size & Forecast, by Revenue (USD Billion), 2021–2035 | |
  17. TABLE 3 Driver Impact Analysis | |
  18. TABLE 4 Restraints Impact Analysis | |
  19. TABLE 5 Regional Summary, by Region, 2025 | |
  20. TABLE 6 North America – Country-Level Analysis | |
  21. TABLE 7 Europe – Country-Level Analysis | |
  22. TABLE 8 Asia-Pacific – Country-Level Analysis | |
  23. TABLE 9 Latin America – Regional Analysis | |
  24. TABLE 10 Middle East and Africa – Regional Analysis | |
  25. TABLE 11 Global Market, by Type, 2025 | |
  26. TABLE 12 Global Market, by Mode of Transport, 2025 | |
  27. TABLE 13 Global Market, by Application, 2025 | |
  28. TABLE 14 Competitive Benchmarking Matrix | |
  29. TABLE 15 Report Scope and Methodology | |
  30. TABLE 16 Detailed Sources and Citations | |
  31. TABLE 17 Segmentation Quick Reference | | LIST OF FIGURES | |
  32. FIGURE 1 Market Dynamics – Drivers, Restraints and Opportunities | |
  33. FIGURE 2 Value Chain Analysis | |
  34. FIGURE 3 Porter's Five Forces Analysis | |
  35. FIGURE 4 Global Market Size Trend, 2021–2035 (USD Billion) | |
  36. FIGURE 5 Market Share, by Type, 2025 | |
  37. FIGURE 6 Market Share, by Mode of Transport, 2025 | |
  38. FIGURE 7 Market Share, by Application, 2025 | |
  39. FIGURE 8 Regional Market Share, 2025 | |
  40. FIGURE 9 Regional Growth Comparison, 2026–2035 | |
  41. FIGURE 10 Competitive Landscape – Vendor Positioning Matrix | |
  42. FIGURE 11 Estimated Top-5 Vendor Revenue Share, 2025

Segmentation Quick Reference

DimensionSub-SegmentsDominant SegmentFastest Growing Segment
By TypeHardware; Software; ServicesHardware — 44.2% share (2025)Services — 15.9% CAGR (2026–2035)
By Mode of TransportRoadways; Railways; Airways; MaritimeRoadways — 57.6% share (2025)Maritime — 15.2% CAGR (2026–2035)
By ApplicationTraffic congestion control system; Automotive telematics; Reservation, toll, & ticketing systems; Security and surveillance system; Remote monitoring; Other ApplicationsAutomotive telematics — 29.4% share (2025)Remote monitoring — 16.4% CAGR (2026–2035)
By RegionNorth America; Europe; Asia-Pacific; Latin America; Middle East and AfricaNorth America — 34.6% share (2025)Asia-Pacific — 15.7% CAGR (2026–2035)


Market Segmentation Overview

By Type

Sub-SegmentKey Trend
HardwareShift to multi-network telematics control units and AI-capable roadside units
SoftwareMigration from on-premises traffic and fleet tools to cloud subscriptions
ServicesRising demand for managed connectivity, integration and security operations


Hardware remains the leading Type segment at a 44.2% share because telematics control units, onboard gateways and roadside units must be installed before any software can run. Services grow fastest at a 15.9% CAGR as operators outsource integration and managed connectivity for mixed-vendor fleets. Software sits between them, monetizing the installed hardware base through recurring subscriptions.

By Mode of Transport

Sub-SegmentKey Trend
RoadwaysConnected signals, GNSS tolling and mandated vehicle connectivity
RailwaysETCS signalling renewal and condition-based maintenance
AirwaysAirport operations visibility and baggage tracking
MaritimeSmart containers, reefer telemetry and terminal automation


Roadways leads with a 57.6% share, given the scale of truck, bus and car fleets plus tolling and signal infrastructure that can be connected. Maritime is the fastest-growing mode at a 15.2% CAGR as smart containers and port automation spread along major trade lanes. Railways and Airways grow steadily on signalling renewal and airport operations investment.

By Application

Sub-SegmentKey Trend
Traffic congestion control systemAdaptive signal control funded by urban mobility grants
Automotive telematicsEmbedded OEM connectivity and insurance analytics
Reservation, toll, & ticketing systemsBarrier-free GNSS tolling and contactless fares
Security and surveillance systemAI video analytics onboard buses and trains
Remote monitoringPredictive maintenance and cold-chain condition tracking
Other ApplicationsPassenger information, parking and curb management


Automotive telematics leads the Application dimension at a 29.4% share, anchored by logging mandates and embedded OEM connectivity in new vehicles. Remote monitoring grows fastest at a 16.4% CAGR because predictive maintenance on rolling stock and cold-chain temperature tracking deliver measurable cost savings. Reservation, toll, & ticketing systems gain steadily from GNSS tolling and contactless fare adoption.


Download PDF ×

We do not share your information with anyone. However, we may send you emails based on your report interest from time to time. You may contact us at any time to opt-out.