ID: MRFR/MED/4688-HCR | February 2021 | Region: Global | 100 pages
Market Scenario
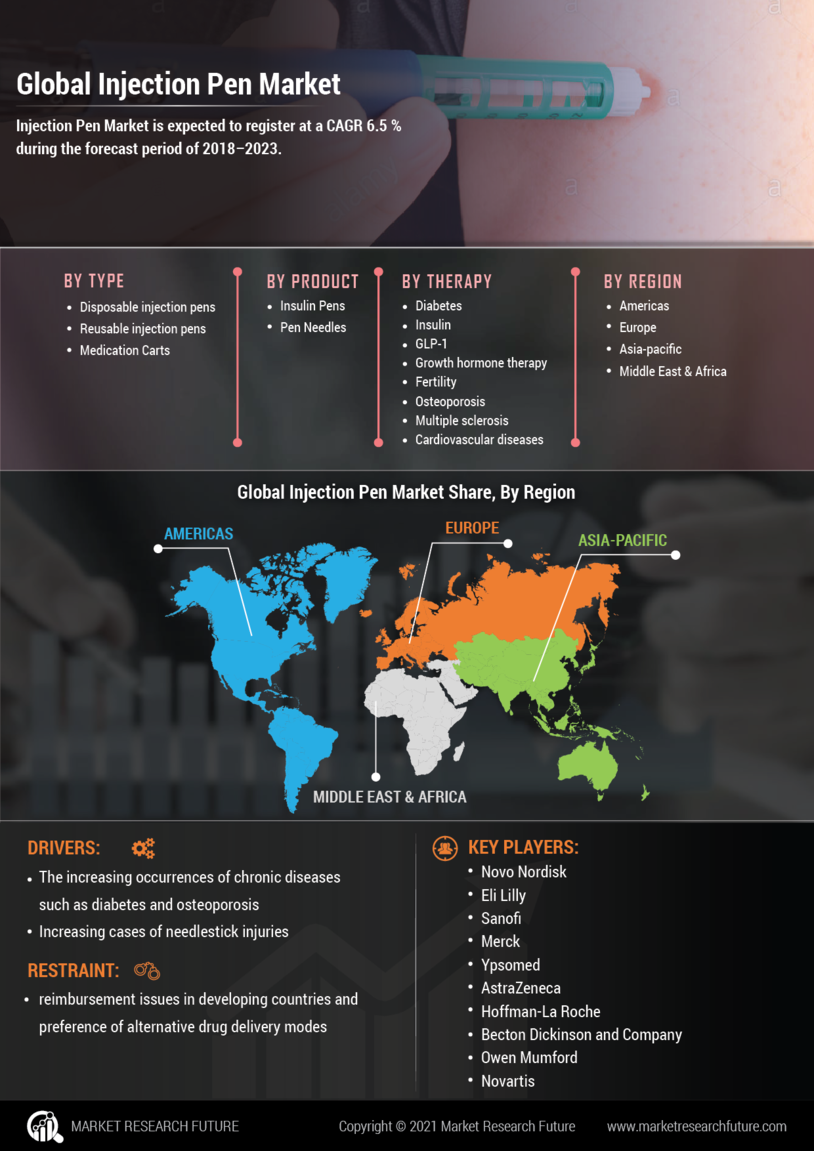
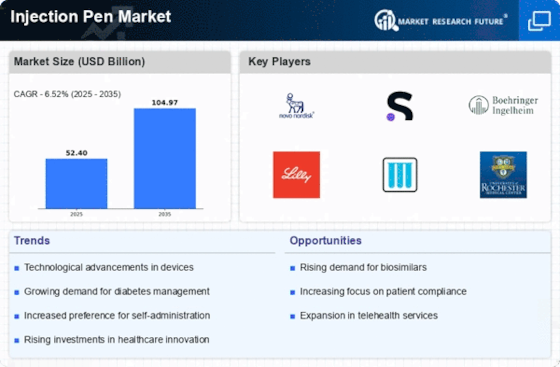
The global injection pen market is expected to gain prominence over the forecast period (2018–2023). It is estimated that the global injection pen market is expected to register at a CAGR ~ 6.5 % during the forecast period of 2018–2023.
Injection pens are designed to deliver the drug in the body with ease and convenience. It is a small, hand-held portable device used to inject drug for the treatment of various diseases. The increasing occurrences of chronic diseases such as diabetes and osteoporosis globally are expected to drive the global injection pen market during the forecast period. For instance, in 2015, according to the American Diabetes Association, 30.3 million people in the U.S. had diabetes which is 9.4% of the total population. Moreover, the growing preference of injection pens over the traditional vial and syringe method owing to the increasing cases of needlestick injuries is likely to contribute to the market growth.
Despite the drivers, factors such as reimbursement issues in developing countries and preference of alternative drug delivery modes are restraining the growth of the global injection pen market.
Segmentation
The global injection pen market is segmented on the basis of type, product, therapy, distribution channel, and end-user.
On the basis of type, the market is classified into disposable injection pens and reusable injection pens.
The global injection pen market on the basis of product is segmented into insulin pens and pen needles.
On the basis of therapy, the market is segmented as diabetes, growth hormone therapy, fertility, osteoporosis, multiple sclerosis, cardiovascular diseases, rheumatoid arthritis, obesity, Crohn’s disease, cancer, and others. Diabetes is further segmented into insulin and GLP-1.
On the basis of distribution channel, the market is segmented into hospital pharmacies, retail pharmacies, online medical stores, and diabetes clinics.
On the basis of end-user, the global injection pen market is segmented into home care and hospitals and clinics.
Geographically, the market has been segmented into America, Europe, Asia Pacific, and the Middle East and Africa. The American injection pen market is further segmented into North America and South America. North America is further classified as the U.S. and Canada.
The Europe injection pen market is segmented into Western Europe and Eastern Europe. Western Europe is further classified as Germany, France, the U.K., Italy, Spain, and the rest of Western Europe.
The Asia Pacific injection pen market is segmented into Japan, China, India, Republic of Korea, Australia, and the rest of Asia Pacific.
The Middle Eastern and African injection pen market is segmented into the Middle East and Africa.
Regional Market Summary
Global Injection Pen Market, by Region Market Share, 2017 (%)
Source: MRFR Analysis
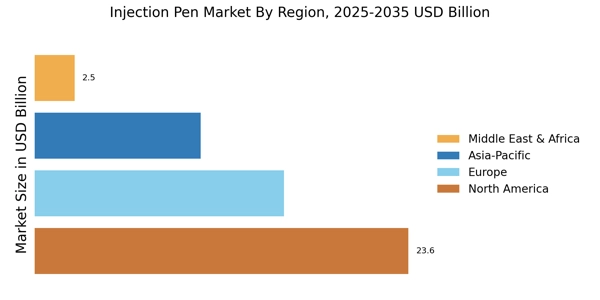
The Americas is likely to dominate the global injection pen market owing to the increasing prevalence of diabetes and cancer, increasing number of approvals, and subsequent launches of new products during the forecast period. For instance, as per the National Diabetes Statistics Report 2014, 29.1 million people, i.e., 9.3% of the America population had diabetes. Furthermore, continuous development of advanced injection pens by manufacturers in the region contributes to the market growth.
Europe is likely to hold the second position in the global injection pen market. It is expected that the well-developed healthcare sector and increasing prevalence of chronic diseases in this region are likely to drive the market. Additionally, according to WHO, there are 3.7 million cases of cancer in Europe every year. Furthermore, favorable government policies for research have attracted many of the prominent market players.
Asia Pacific is the fastest growing region in the market owing to the huge patient population with chronic diseases. According to WHO, 60% of the world's diabetic population lives in Asia Pacific. This is the major factor responsible for the fastest growth of the injection pen market in this region. Additionally, according to a study published in the Asian Pacific Journal of Tropical Biomedicine Journal in 2014, it was estimated that about 150 million diabetic patients reside within the region, out of which more than 95% have type 2 diabetes mellitus. Furthermore, rapid developments in the economies and increasing healthcare expenditure have fueled the growth of the market.
The Middle East and Africa accounts for the lowest market share in the global injection pen market. However, some prominent key players are investing in the Middle Eastern region which is likely to contribute to the growth of the market during the forecast period. For instance, in September 2015, Novo Nordisk invested 7.8 million USD for building manufacturing plants in Iran for the production of FlexPen Prefilled insulin device.
Key Players
Some of the key players in the global injection pen market are Novo Nordisk (Denmark), Eli Lilly (U.S.), Sanofi (France), Merck (U.S.), Ypsomed (Switzerland), AstraZeneca (U.K.), F.Hoffman-La Roche (Switzerland), Becton Dickinson and Company (U.S.), Owen Mumford (U.K.), Novartis (Switzerland), Pfizer (U.S.), Haselmeier (Switzerland), Jiangsu Delfu medical device Co. Ltd (China), and Biocon Ltd (India).
Research Methodology
Market Research Future research is conducted by industry experts who offer insight into industry structure, market segmentation, Treatment assessment, Competitive Landscape (CL), penetration, as well as on emerging trends. Besides primary interviews (~ 80%) and secondary research (~ 20%), their analysis is based on their years of professional expertise in respective industries. Our analysts also predict where the market will be headed in the next five to ten years, by analyzing historical trends and current market positions. Furthermore, the varying trends of segments & categories geographically presented are studied and are estimated based on primary & secondary research.
The extensive primary research was conducted to gain a deeper insight into the market and the industry performance. In this particular report, we have conducted primary surveys (interviews) with the key level executives (VP, CEO's, Marketing Director, Business Development Manager and many more) of the major players who are active in the market. In addition to analyzing the current and historical trends, our analysts predict where the market is headed, over the next five to ten years.
Secondary research was mainly used to collect and identify information useful for an extensive, technical, market-oriented, and commercial study of the global injection pen market. It was also used to obtain key information about major players, market classification and segmentation according to the industry trends, geographical markets, & developments related to the market and Treatment Perspectives. For this study, analysts have gathered information from various credible sources, such as annual reports, SEC filings, journals, white papers, corporate presentations, company websites, the international organization of chemical manufacturers, some paid databases, and many others.
Global Injection Pen Market, by Type
Global Injection Pen Market, by Product
Global Injection Pen Market, by Therapy
Global Injection Pen Market, by Distribution Channel
Global Injection pen Market, by End-User
Global Injection Pen Market, by Region
Company Profiles
Intended Audience
Table of Contents:
Chapter 1. Report Prologue
Chapter 2. Market Introduction
2.1 Definition
2.2 Scope of the Study
2.2.1 Research Objective
2.2.2 Assumptions
2.2.3 Limitations
Chapter 3. Research Methodology
3.1 Introduction
3.2 Primary Research
3.3 Secondary Research
3.4 Market Size Estimation
Chapter 4. Market Dynamics
4.1 Drivers
4.2 Restraints
4.3 Opportunities
4.4 Challenges
4.5 Macroeconomic Indicators
4.6 Technology Trends & Assessment
Chapter 5. Market Factor Analysis
5.1 Porter’s Five Forces Analysis
5.1.1 Bargaining Power of Suppliers
5.1.2 Bargaining Power of Buyers
5.1.3 Threat of New Entrants
5.1.4 Threat of Substitutes
5.1.5 Intensity of Rivalry
5.2 Value Chain Analysis
5.3 Investment Feasibility Analysis
5.4 Pricing Analysis
Chapter 6. Global Injection Pen Market, by Type
6.1 Introduction
6.2 Disposable Injection pens
Market Estimates & Forecast, by region, 2018–2023
Market Estimates & Forecast, by Country, 2018–2023
6.3 Reusable injection pens
Market Estimates & Forecast, by region, 2018–2023
Market Estimates & Forecast, by Country, 2018–2023
Chapter 7. Global Injection Pen Market, by Product
7.1 Introduction
7.2 Insulin Pens
Market Estimates & Forecast, by region, 2018–2023
Market Estimates & Forecast, by Country, 2018–2023
7.3 Pen Needles
Market Estimates & Forecast, by region, 2018–2023
Market Estimates & Forecast, by Country, 2018–2023
Chapter 8. Global Injection Pen Market, by Therapy
8.1 Introduction
8.2 Diabetes
8.2.1 Insulin
Market Estimates & Forecast, by region, 2018–2023
Market Estimates & Forecast, by Country, 2018–2023
8.2.2 GLP - 1
Market Estimates & Forecast, by region, 2018–2023
Market Estimates & Forecast, by Country, 2018–2023
8.3 Growth Hormone Therapy
Market Estimates & Forecast, by region, 2018–2023
Market Estimates & Forecast, by Country, 2018–2023
8.4 Fertility
Market Estimates & Forecast, by region, 2018–2023
Market Estimates & Forecast, by Country, 2018–2023
8.5 Osteoporosis
Market Estimates & Forecast, by region, 2018–2023
Market Estimates & Forecast, by Country, 2018–2023
8.6 Multiple Sclerosis
Market Estimates & Forecast, by region, 2018–2023
Market Estimates & Forecast, by Country, 2018–2023
8.7 Cardiovascular diseases
Market Estimates & Forecast, by region, 2018–2023
Market Estimates & Forecast, by Country, 2018–2023
8.8 Rheumatoid Arthritis
Market Estimates & Forecast, by region, 2018–2023
Market Estimates & Forecast, by Country, 2018–2023
8.9 Obesity
Market Estimates & Forecast, by region, 2018–2023
Market Estimates & Forecast, by Country, 2018–2023
8.10 Crohn’s disease
Market Estimates & Forecast, by region, 2018–2023
Market Estimates & Forecast, by Country, 2018–2023
8.11 Cancer
Market Estimates & Forecast, by region, 2018–2023
Market Estimates & Forecast, by Country, 2018–2023
8.12 Others
Market Estimates & Forecast, by region, 2018–2023
Market Estimates & Forecast, by Country, 2018–2023
Chapter 9. Global Injection Pen Market, by Distribution Channel
9.1 Introduction
9.2 Hospital Pharmacies
Market Estimates & Forecast, by region, 2018–2023
Market Estimates & Forecast, by Country, 2018–2023
9.3 Retail Pharmacies
Market Estimates & Forecast, by region, 2018–2023
Market Estimates & Forecast, by Country, 2018–2023
9.4 Online Medical Stores
Market Estimates & Forecast, by region, 2018–2023
Market Estimates & Forecast, by Country, 2018–2023
9.5 Diabetes Clinics
Market Estimates & Forecast, by region, 2018–2023
Market Estimates & Forecast, by Country, 2018–2023
Chapter 10. Global Injection Pen Market, by End-Users
10.1 Introduction
10.2 Homecare
Market Estimates & Forecast, by region, 2018–2023
Market Estimates & Forecast, by Country, 2018–2023
10.3 Hospital & Clinics
Market Estimates & Forecast, by region, 2018–2023
Market Estimates & Forecast, by Country, 2018–2023
Chapter 11. Global Injection Pen Market, by Region
11.1 Introduction
11.2 Americas
11.2.1 North America
11.2.1.1 U.S.
11.2.1.2 Canada
11.2.2 South America
11.3 Europe
11.3.1 Western Europe
11.3.1.1 Germany
11.3.1.2 France
11.3.1.3 Italy
11.3.1.4 Spain
11.3.1.5 U.K.
11.3.1.6 Rest of Western Europe
11.3.2 Eastern Europe
11.4 Asia Pacific
11.4.1 Japan
11.4.2 China
11.4.3 India
11.4.4 Australia
11.4.5 Republic of Korea
11.4.6 Rest of Asia Pacific
11.5 The Middle East & Africa
11.5.1 The Middle East
11.5.2 Africa
Chapter 12. Company Landscape
12.1 Introduction
12.2 Market Share Analysis
12.3 Key Development & Strategies
Chapter 13. Company Profiles
13.1 Novo Nordisk
13.1.1 Company Overview
13.1.2 Product Overview
13.1.3 Financials Overview
13.1.4 Key Developments
13.1.5 SWOT Analysis
13.2 Eli Lilly
13.2.1 Company Overview
13.2.2 Product Overview
13.2.3 Financial Overview
13.2.4 Key Developments
13.2.5 SWOT Analysis
13.3 Sanofi
13.3.1 Company Overview
13.3.2 Product Overview
13.3.3 Financial Overview
13.3.4 Key Development
13.3.5 SWOT Analysis
13.4 Merck
13.4.1 Company Overview
13.4.2 Technology/Business Segment Overview
13.4.3 Financial Overview
13.4.4 Key Development
13.4.5 SWOT Analysis
13.5 Ypsomed
13.5.1 Company Overview
13.5.2 Product Overview
13.5.3 Financial overview
13.5.4 Key Developments
13.5.5 SWOT Analysis
13.6 AstraZeneca
13.6.1 Company Overview
13.6.2 Product Overview
13.6.3 Financial Overview
13.6.4 Key Developments
13.6.5 SWOT Analysis
13.7 F. Hoffman-La Roche
13.7.1 Overview
13.7.2 Product Overview
13.7.3 Financial Overview
13.7.4 Key Developments
13.7.5 SWOT Analysis
13.8 Becton Dickinson and Company
13.8.1 Overview
13.8.2 Product/ Technology Overview
13.8.3 Financials
13.8.4 Key Developments
13.8.5 SWOT Analysis
13.9 Owen Mumford
13.9.1 Overview
13.9.2 Product Overview
13.9.3 Financials
13.9.4 Key Developments
13.9.5 SWOT Analysis
13.10 Novartis
13.10.1 Overview
13.10.2 Product Overview
13.10.3 Financials
13.10.4 Key Developments
13.10.5 SWOT Analysis
13.11 Pfizer
13.11.1 Overview
13.11.2 Product Overview
13.11.3 Financials
13.11.4 Key Developments
13.11.5 SWOT Analysis
13.12 Haselmeier
13.12.1 Overview
13.12.2 Product Overview
13.12.3 Financials
13.12.4 Key Developments
13.12.5 SWOT Analysis
13.13 Jiangsu Delfu medical device Co., Ltd
13.13.1 Overview
13.13.2 Product Overview
13.13.3 Financials
13.13.4 Key Developments
13.13.5 SWOT Analysis
31.14 Biocon Ltd
13.14.1 Overview
13.14.2 Product Overview
13.14.3 Financials
13.14.4 Key Developments
13.14.5 SWOT Analysis
Chapter 14 MRFR Conclusion
14.1 Key Findings
14.1.1 From CEO’s View Point
14.1.2 Unmet Needs of the Market
14.2 Key Companies to Watch
14.3 Prediction of the Arthroscopy Instruments Industry
Chapter 15 Appendix
LIST OF TABLES
Table 1 Global Injection Pen Market Synopsis, 2018–2023
Table 2 Global Injection Pen Market Estimates and Forecast, 2018–2023, (USD Million)
Table 3 Global Injection Pen Market, by Region, 2018–2023, (USD Million)
Table 4 Global Injection Pen Market, by Type, 2018–2023, (USD Million)
Table 5 Global Injection Pen Market, by Product, 2018–2023, (USD Million)
Table 6 Global Injection Pen Market, by Therapy, 2018–2023, (USD Million)
Table 7 Global Injection Pen Market, by Distribution Channel, 2018–2023, (USD Million)
Table 8 Global Injection Pen Market, by End-User, 2018–2023, (USD Million)
Table 9 North America Global Injection Pen Market, by Type, 2018–2023, (USD Million)
Table 10 North America Global Injection Pen Market, by Product, 2018–2023, (USD Million)
Table 11 North America Global Injection Pen Market, by Therapy, 2018–2023, (USD Million)
Table 12 North America Global Injection Pen Market, by Product, 2018–2023, (USD Million)
Table 13 North America Global Injection Pen Market, by Distribution Channel, 2018–2023, (USD Million)
Table 14 North America Global Injection Pen Market, by End-User, 2018–2023, (USD Million)
Table 15 U.S. Injection Pen Market, by Type, 2018–2023, (USD Million)
Table 16 U.S. Injection Pen Market, by Product, 2018–2023, (USD Million)
Table 17 U.S. Injection Pen Market, by Therapy, 2018–2023, (USD Million)
Table 18 U.S. Injection Pen Market, by Distribution Channel, 2018–2023, (USD Million)
Table 19 U.S. Injection Pen Market, by End-User, 2018–2023, (USD Million)
Table 20 Canada Injection Pen Market, by Type, 2018–2023, (USD Million)
Table 21 Canada Injection Pen Market, by Product, 2018–2023, (USD Million)
Table 22 Canada Injection Pen Market, by Therapy, 2018–2023, (USD Million)
Table 23 Canada Injection Pen Market, by Distribution Channel, 2018–2023, (USD Million)
Table 24 Canada Injection Pen Market, by End-User, 2018–2023, (USD Million)
Table 25 South America Injection Pen Market, by Type, 2018–2023, (USD Million)
Table 26 South America Injection Pen Market, by Product, 2018–2023, (USD Million
Table 27 South America Injection Pen Market, by Therapy, 2018–2023, (USD Million)
Table 28 South America Injection Pen Market, by Distribution Channel, 2018–2023, (USD Million)
Table 29 South America Injection Pen Market, by End-User, 2018–2023, (USD Million)
Table 30 Europe Injection Pen Market, by Type, 2018–2023, (USD Million)
Table 31 Europe Injection Pen Market, by Product, 2018–2023, (USD Million)
Table 32 Europe Injection Pen Market, by Therapy, 2018–2023, (USD Million)
Table 33 Europe Injection Pen Market, by Distribution Channel, 2018–2023, (USD Million)
Table 34 Europe Injection Pen Market, by End-User, 2018–2023, (USD Million)
Table 35 Western Europe Injection Pen Market, by Type, 2018–2023, (USD Million)
Table 36 Western Europe Injection Pen Market, by Product, 2018–2023, (USD Million)
Table 37 Western Europe Injection Pen Market, by Therapy, 2018–2023, (USD Million)
Table 38 Western Europe Injection Pen Market, by Distribution Channel, 2018–2023, (USD Million)
Table 39 Western Europe Injection Pen Market, by End-User, 2018–2023, (USD Million)
Table 40 Eastern Europe Injection Pen Market, by Type, 2018–2023, (USD Million)
Table 41 Eastern Europe Injection Pen Market, by Product, 2018–2023, (USD Million)
Table 42 Eastern Europe Injection Pen Market, by Therapy, 2018–2023, (USD Million)
Table 43 Eastern Europe Injection Pen Market, by Distribution Channel, 2018–2023, (USD Million)
Table 44 Eastern Europe Injection Pen Market, by End-User, 2018–2023, (USD Million)
Table 45 Asia Pacific Injection Pen Market, by Type, 2018–2023, (USD Million)
Table 46 Asia Pacific Injection Pen Market, by Product, 2018–2023, (USD Million)
Table 47 Asia Pacific Injection Pen Market, by Therapy, 2018–2023, (USD Million)
Table 48 Asia Pacific Injection Pen Market, by Distribution Channel, 2018–2023, (USD Million)
Table 49 Asia Pacific Injection Pen Market, by End-User, 2018–2023, (USD Million)
Table 50 Middle East & Africa Injection Pen Market, by Type, 2018–2023, (USD Million)
Table 51 Middle East & Africa Injection Pen Market, by Product 2018–2023, (USD Million)
Table 52 Middle East & Africa Injection Pen Market, by Therapy, 2018–2023, (USD Million)
Table 53 Middle East & Africa Injection Pen Market, by Distribution Channel, 2018–2023, (USD Million)
Table 54 Middle East & Africa Injection Pen Market, by End-User, 2018–2023, (USD Million)
LIST OF FIGURES
Figure 1 Research Process
Figure 2 Segmentation for Global Injection Pen Market
Figure 3 Segmentation Market Dynamics for Global Injection Pen Market
Figure 4 Global Injection Pen Market Share, by Type 2017
Figure 5 Global Injection Pen Market Share, by Product 2017
Figure 6 Global Injection Pen Market Share, by Therapy 2017
Figure 7 Global Injection Pen Market Share, by Distribution Channel 2017
Figure 8 Global Injection Pen Market Share, by End-User, 2017
Figure 9 Global Injection Pen Market Share, by Region, 2017
Figure 10 North America Injection Pen Market Share, by Country, 2017
Figure 11 Europe Injection Pen Market Share, by Country, 2017
Figure 12 Asia Pacific Injection Pen Market Share, by Country, 2017
Figure 13 Middle East & Africa Injection Pen Market Share, by Country, 2017
Figure 14 Global Injection Pen Market: Company Share Analysis, 2017 (%)
Figure 15 Novo Nordisk: Key Financials
Figure 16 Novo Nordisk: Segmental Revenue
Figure 17 Novo Nordisk: Geographical Revenue
Figure 18 Eli Lilly: Key Financials
Figure 19 Eli Lilly: Segmental Revenue
Figure 20 Eli Lilly: Geographical Revenue
Figure 21 Sanofi::Key Financials
Figure 22 Sanofi: Segmental Revenue
Figure 23 Sanofi: Geographical Revenue
Figure 24 Merck: Key Financials
Figure 25 Merck: Segmental Revenue
Figure 26 Merck: Geographical Revenue
Figure 27 Ypsomed: Key Financials
Figure 28 Ypsomed: Segmental Revenue
Figure 29 Ypsomed. Geographical Revenue
Figure 30 AstraZeneca: Key Financials
Figure 31 AstraZeneca: Segmental Revenue
Figure 32 AstraZeneca: Geographical Revenue
Figure 33 F. Hoffman- La Roche: Key Financials
Figure 34 F. Hoffman- La Roche: Segmental Revenue
Figure 35 F. Hoffman- La Roche: Geographical Revenue
Figure 36 Becton Dickinson and Company: Key Financials
Figure 37 Becton Dickinson and Company: Segmental Revenue
Figure 38 Becton Dickinson and Company: Geographical Revenue
Figure 39 Owen Mumford: Key Financials
Figure 40 Owen Mumford: Segmental Revenue
Figure 41 Owen Mumford: Geographical Revenue
Figure 42 Novartis: Key Financials
Figure 43 Novartis: Segmental Revenue
Figure 44 Novartis: Geographical Revenue
Figure 45 Pfizer: Key Financials
Figure 46 Pfizer Segmental Revenue
Figure 47 Pfizer: Geographical Revenue
Figure 48 Haselmeier: Key Financials
Figure 49 Haselmeier: Segmental Revenue
Figure 50 Haselmeier: Geographical Revenue
Figure 51 Jiangsu Delfu Co. Ltd: Key Financials
Figure 52 Jiangsu Delfu Co. Ltd: Segmental Revenue
Figure 53 Jiangsu Delfu Co. Ltd: Geographical Revenue
Figure 54 Biocon Ltd: Key Financials
Figure 55 Biocon Ltd: Segmental Revenue
Figure 56 Biocon Ltd: Geographical Revenue