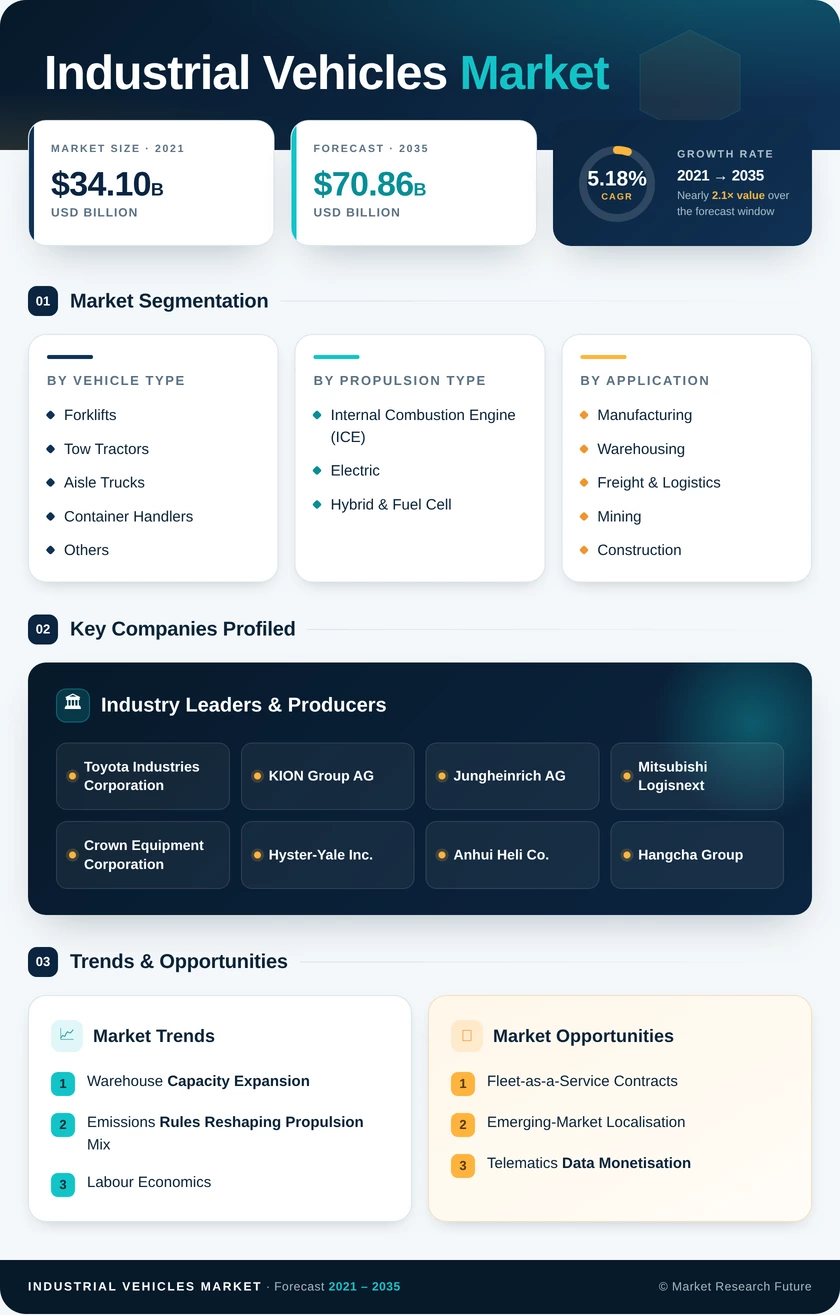
Industrial Vehicles Market (2026 - 2035)

ID: MRFR/AT/1660-HCR 111 Pages Shubham Munde Last Updated: September 15, 2026
Industrial Vehicles Market Research Report By Vehicle Type (Forklifts, Tow Tractors, Aisle Trucks, Container Handlers, Others), By Propulsion Type (Internal Combustion Engine (ICE), Electric, Hybrid & Fuel Cell), By Application (Manufacturing, Warehousing, Freight & Logistics, Mining, Construction, Others), By Weight Category (Light Duty, Medium Duty, Heavy Duty), By Level of Autonomy (Non-Autonomous, Semi-Autonomous, Fully Autonomous) and By Regional (North America, Europe, South America, Asia Pacific, Middle East and Africa) - Forecast to 2035
Industrial Vehicles Market
Market Size
Forecast Period2026-2035
CAGR (2026-2035)5.18%
2025 Market SizeUSD 42.77 Billion
2035 Market SizeUSD 70.86 Billion
Key Players
Toyota Industries Corporation
KION Group AG
Jungheinrich AG
Mitsubishi Logisnext
Crown Equipment Corporation
Hyster-Yale Inc.
Opportunities
  • Fleet-as-a-Service Contracts
  • Emerging-Market Localisation
  • Telematics Data Monetisation
  1. 1 Market Overview | |
    1. 1.1 Study Assumptions & Market Definition | |
    2. 1.2 Scope of the Study | |
    3. 1.3 Research Methodology | |
  2. 2 Market Summary & Key Report Takeaways | |
    1. 2.1 Takeaways by Technology | |
    2. 2.2 Takeaways by Sector | |
    3. 2.3 Takeaways by Geography | |
  3. 3 Market Size & Forecast (2021–2035) | |
    1. 3.1 Historical Market Size (2021–2025) | |
    2. 3.2 Current & Forecast Market Size (2026–2035) | |
    3. 3.3 Year-over-Year Growth Analysis | |
  4. 4 Driver Impact Analysis | |
    1. 4.1 Warehouse Capacity Expansion | |
    2. 4.2 Emissions Rules Reshaping Propulsion Mix | |
    3. 4.3 Labour Economics | |
    4. 4.4 Battery Cost Curve | |
  5. 5 Restraints Impact Analysis | |
    1. 5.1 Capital Intensity of Fleet Conversion | |
    2. 5.2 Service Capacity Constraints | |
    3. 5.3 Financing Sensitivity | |
  6. 6 Opportunity Analysis | |
    1. 6.1 Fleet-as-a-Service Contracts | |
    2. 6.2 Emerging-Market Localisation | |
    3. 6.3 Telematics Data Monetisation | |
    4. 6.4 Hydrogen in High-Throughput Cold Chains | |
    5. 6.5 Retrofit and Second-Life Programmes | |
    6. 6.6 Industry Value Chain Analysis | |
    7. 6.7 Porter's Five Forces Analysis | |
  7. 7 Regional Market Share & Country-Level Analysis | |
    1. 7.1 North America | | |
      1. 7.1.1 US | | |
      2. 7.1.2 Canada | | |
      3. 7.1.3 Mexico | |
    2. 7.2 Europe | | |
      1. 7.2.1 Germany | | |
      2. 7.2.2 UK | | |
      3. 7.2.3 France | | |
      4. 7.2.4 Italy | | |
      5. 7.2.5 Spain | | |
      6. 7.2.6 Nordic Countries | | |
      7. 7.2.7 Russia | | |
      8. 7.2.8 Rest of Europe | |
    3. 7.3 Asia-Pacific | | |
      1. 7.3.1 China | | |
      2. 7.3.2 India | | |
      3. 7.3.3 Japan | | |
      4. 7.3.4 South Korea | | |
      5. 7.3.5 ASEAN | | |
      6. 7.3.6 Rest of Asia-Pacific | |
    4. 7.4 South America | | |
      1. 7.4.1 Brazil | | |
      2. 7.4.2 Argentina | | |
      3. 7.4.3 Rest of South America | |
    5. 7.5 Middle East & Africa | | |
      1. 7.5.1 Saudi Arabia | | |
      2. 7.5.2 UAE | | |
      3. 7.5.3 South Africa | | |
      4. 7.5.4 Egypt | | |
      5. 7.5.5 Rest of Middle East & Africa | |
  8. 8 Future Outlook (2026–2035) | |
    1. 8.1 Autonomy Moves From Pilot to Payroll | |
    2. 8.2 Energy Systems Become the Product | |
    3. 8.3 Aftermarket Overtakes Iron on Margin | |
    4. 8.4 Scope 3 Reporting Pulls Fleets Into Disclosure | |
  9. 9 Segmentation Analysis | |
    1. 9.1 By Vehicle Type | | |
      1. 9.1.1 Forklifts | | |
      2. 9.1.2 Tow Tractors | | |
      3. 9.1.3 Aisle Trucks | | |
      4. 9.1.4 Container Handlers | | |
      5. 9.1.5 Others | |
    2. 9.2 By Propulsion Type | | |
      1. 9.2.1 Internal Combustion Engine (ICE) | | |
      2. 9.2.2 Electric | | |
      3. 9.2.3 Hybrid & Fuel Cell | |
    3. 9.3 By Application | | |
      1. 9.3.1 Manufacturing | | |
      2. 9.3.2 Warehousing | | |
      3. 9.3.3 Freight & Logistics | | |
      4. 9.3.4 Mining | | |
      5. 9.3.5 Construction | | |
      6. 9.3.6 Others | |
    4. 9.4 By Weight Category | | |
      1. 9.4.1 Light Duty | | |
      2. 9.4.2 Medium Duty | | |
      3. 9.4.3 Heavy Duty | |
    5. 9.5 By Level of Autonomy | | |
      1. 9.5.1 Non-Autonomous | | |
      2. 9.5.2 Semi-Autonomous | | |
      3. 9.5.3 Fully Autonomous | |
  10. 10 Competitive Landscape | |
    1. 10.1 Market Concentration Analysis (2026) | |
    2. 10.2 Competitive Benchmarking Matrix | |
    3. 10.3 Company Profiles | | |
      1. 10.3.1 Toyota Industries Corporation | | |
      2. 10.3.2 KION Group AG | | |
      3. 10.3.3 Jungheinrich AG | | |
      4. 10.3.4 Mitsubishi Logisnext | | |
      5. 10.3.5 Crown Equipment Corporation | | |
      6. 10.3.6 Hyster-Yale Inc. | | |
      7. 10.3.7 Anhui Heli Co. | | |
      8. 10.3.8 Hangcha Group | | |
      9. 10.3.9 Hyundai Material Handling | | |
      10. 10.3.10 Komatsu Ltd. | | |
      11. 10.3.11 Clark Material Handling | | |
      12. 10.3.12 Godrej & Boyce | |
  11. 11 Recent News & Developments | |
  12. 12 Report Scope & Methodology | |
    1. 12.1 Study Period & Base Year | |
    2. 12.2 Data Sources & Triangulation | |
    3. 12.3 Abbreviations | |
  13. 13 Detailed Sources & Citations | |
  14. 14 Frequently Asked Questions (FAQs) | | LIST OF TABLES | |
  15. TABLE 1 Global Industrial Vehicles Market Size & Forecast, by Revenue (USD Billion), 2021–2035 | |
  16. TABLE 2 Global Industrial Vehicles Market – Year-over-Year Growth Analysis, 2021–2035 | |
  17. TABLE 3 Driver Impact Analysis Matrix, 2026–2035 | |
  18. TABLE 4 Restraint Impact Analysis Matrix, 2026–2035 | |
  19. TABLE 5 Global Market Size, by Region, 2021–2035 (USD Billion) | |
  20. TABLE 6 North America Market Size, by Country, 2021–2035 (USD Billion) | |
  21. TABLE 7 Europe Market Size, by Country, 2021–2035 (USD Billion) | |
  22. TABLE 8 Asia-Pacific Market Size, by Country, 2021–2035 (USD Billion) | |
  23. TABLE 9 South America Market Size, by Country, 2021–2035 (USD Billion) | |
  24. TABLE 10 Middle East & Africa Market Size, by Country, 2021–2035 (USD Billion) | |
  25. TABLE 11 Global Market Size, by Vehicle Type, 2021–2035 (USD Billion) | |
  26. TABLE 12 Global Market Size, by Propulsion Type, 2021–2035 (USD Billion) | |
  27. TABLE 13 Global Market Size, by Application, 2021–2035 (USD Billion) | |
  28. TABLE 14 Global Market Size, by Weight Category, 2021–2035 (USD Billion) | |
  29. TABLE 15 Global Market Size, by Level of Autonomy, 2021–2035 (USD Billion) | |
  30. TABLE 16 Competitive Benchmarking Matrix, 2026 | |
  31. TABLE 17 Company Profiles – Key Players | |
  32. TABLE 18 Recent Developments & Strategic Announcements, 2023–2025 | |
  33. TABLE 19 Report Scope & Methodology Summary | |
  34. TABLE 20 Detailed Sources & Citations Index | |
  35. TABLE 21 North America Market Size, by Vehicle Type, 2021–2035 (USD Billion) | |
  36. TABLE 22 Europe Market Size, by Propulsion Type, 2021–2035 (USD Billion) | |
  37. TABLE 23 Asia-Pacific Market Size, by Application, 2021–2035 (USD Billion) | |
  38. TABLE 24 South America Market Size, by Weight Category, 2021–2035 (USD Billion) | |
  39. TABLE 25 Middle East & Africa Market Size, by Level of Autonomy, 2021–2035 (USD Billion) | | LIST OF FIGURES | |
  40. FIGURE 1 Market Dynamics – Drivers, Restraints, Opportunities, and Challenges | |
  41. FIGURE 2 Industry Value Chain Analysis | |
  42. FIGURE 3 Porter's Five Forces Analysis | |
  43. FIGURE 4 Global Market Size Trend & Forecast, 2021–2035 (USD Billion) | |
  44. FIGURE 5 Year-over-Year Growth Trajectory, 2022–2035 (%) | |
  45. FIGURE 6 Market Share by Vehicle Type, 2025 vs 2035 (%) | |
  46. FIGURE 7 Market Share by Propulsion Type, 2025 vs 2035 (%) | |
  47. FIGURE 8 Market Share by Application, 2025 (%) | |
  48. FIGURE 9 Market Share by Weight Category, 2025 (%) | |
  49. FIGURE 10 Market Share by Level of Autonomy, 2025 vs 2035 (%) | |
  50. FIGURE 11 Regional Revenue Share, 2025 (%) | |
  51. FIGURE 12 Regional CAGR Comparison, 2026–2035 (%) | |
  52. FIGURE 13 Asia-Pacific Country-Level Share, 2025 (%) | |
  53. FIGURE 14 Europe Country-Level Share, 2025 (%) | |
  54. FIGURE 15 Competitive Landscape – Estimated Revenue Share Bands, 2026 | |
  55. FIGURE 16 Competitive Positioning Quadrant – Scale vs Automation Depth | |
  56. FIGURE 17 Lithium-Ion Pack Price Curve vs Electric Adoption Rate, 2021–2035

Segmentation Quick Reference

DimensionSub-SegmentsDominant SegmentFastest Growing Segment
By Vehicle TypeForklifts; Tow Tractors; Aisle Trucks; Container Handlers; OthersForkliftsAisle Trucks
By Propulsion TypeInternal Combustion Engine (ICE); Electric; Hybrid & Fuel CellElectricHybrid & Fuel Cell
By ApplicationManufacturing; Warehousing; Freight & Logistics; Mining; Construction; OthersManufacturingWarehousing
By Weight CategoryLight Duty; Medium Duty; Heavy DutyLight DutyHeavy Duty
By Level of AutonomyNon-Autonomous; Semi-Autonomous; Fully AutonomousNon-AutonomousFully Autonomous
By GeographyNorth America; Europe; Asia-Pacific; South America; Middle East & AfricaAsia-PacificAsia-Pacific


Market Segmentation Overview

By Vehicle Type

Sub-SegmentKey Trend
ForkliftsMigration from lead-acid to lithium-ion across Class I and Class III platforms
Tow TractorsMilk-run replenishment displacing single-pallet forklift trips in assembly plants
Aisle TrucksVertical storage economics driving high-bay and very-narrow-aisle specification
Container HandlersPort electrification pilots and hybrid drivelines for reach stackers
OthersSpecialised terminal tractors and rough-terrain units for outdoor yards


Vehicle type remains the primary purchasing axis because duty cycle dictates propulsion, footprint, and safety architecture in one decision. Forklifts hold the volume, but aisle trucks capture the incremental margin as warehouse land costs push storage upward.

By Propulsion Type

Sub-SegmentKey Trend
Internal Combustion Engine (ICE)Retreating to outdoor, heavy-load, and rough-terrain applications
ElectricLithium-ion displacing lead-acid; opportunity charging eliminating battery rooms
Hybrid & Fuel CellFast refuelling advantage in multi-shift cold-chain and high-throughput sites


Propulsion is where regulation bites hardest. Emissions rules in California and the European Union set the schedule, while battery pack economics determine how comfortably operators meet it.

By Application

Sub-SegmentKey Trend
ManufacturingReshoring and nearshoring incentives lifting line-side handling demand
WarehousingE-commerce fulfilment density and 3PL standardisation of fleet specifications
Freight & LogisticsCross-dock throughput requirements favouring higher-capacity powered pallet trucks
MiningHeavy-duty underground handling with stringent ventilation-driven electrification
ConstructionInfrastructure programmes sustaining rough-terrain and telehandler-adjacent demand
OthersAviation ground support, agriculture, and large-format retail replenishment


Application mix explains regional divergence better than GDP does. Economies with dense fulfilment networks skew electric and automated; resource-led economies retain heavier internal combustion fleets for longer.

By Weight Category

Sub-SegmentKey Trend
Light DutyHighest unit volumes; fastest lithium conversion rates
Medium DutyBalanced indoor-outdoor duty cycles; hybrid drivetrain experimentation
Heavy DutyPort, steel, and mining demand supporting premium pricing and long service contracts


Weight class correlates tightly with electrification readiness. Light-duty conversion is largely complete in mature markets, while heavy-duty platforms await denser energy storage and higher-power charging.

By Level of Autonomy

Sub-SegmentKey Trend
Non-AutonomousLarge installed base with retrofit potential for operator-assist packages
Semi-AutonomousSpeed interlocks, load-height limiters, and pedestrian detection becoming standard
Fully AutonomousMixed-fleet navigation moving from pilot deployments to multi-site rollouts


Autonomy adoption follows labour cost and route repeatability, not technology availability. Three-shift operations with fixed pathways convert first; variable-task environments follow once sensor and software costs fall further.




Download PDF ×

We do not share your information with anyone. However, we may send you emails based on your report interest from time to time. You may contact us at any time to opt-out.