Industrial Sugar Market Summary
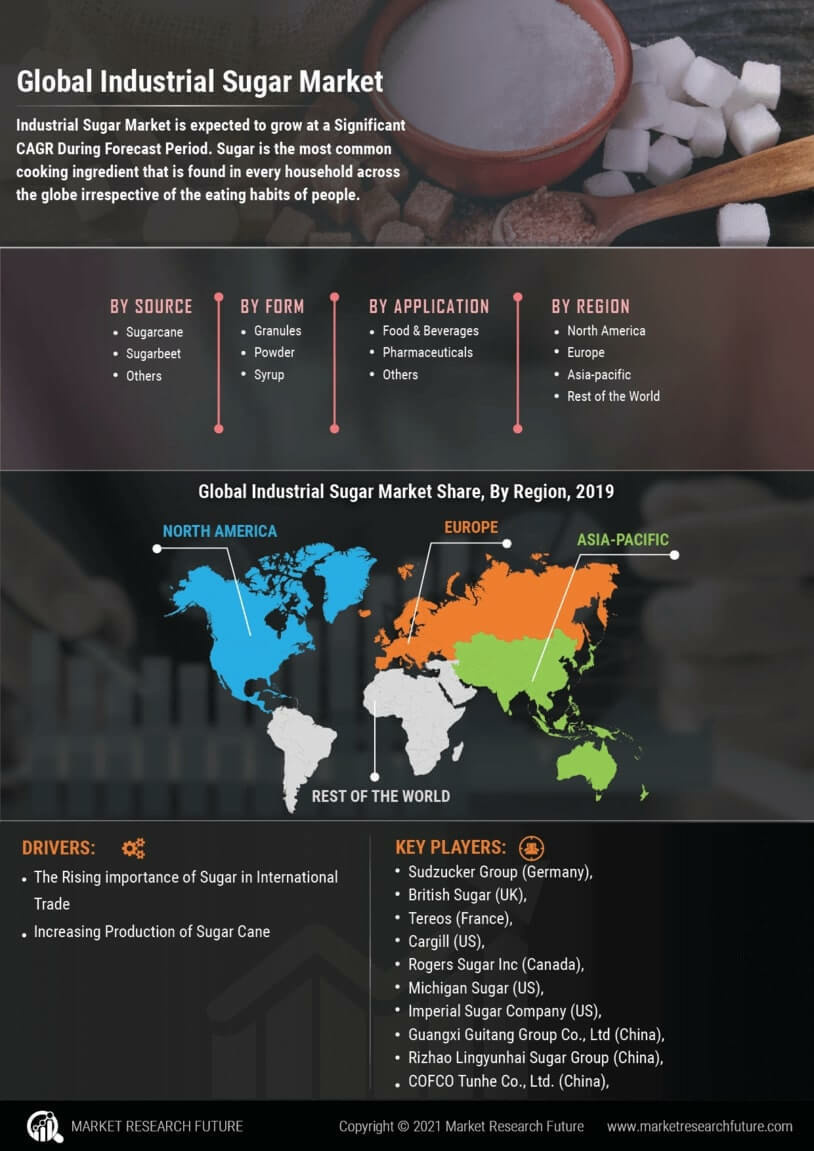
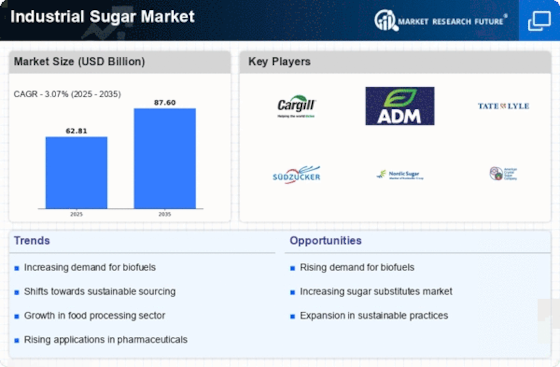
As per Market Research Future Analysis, the Global Industrial Sugar Market was valued at 59.13 USD Billion in 2022 and is projected to grow from 60.94 USD Billion in 2023 to 80.0 USD Billion by 2032, reflecting a CAGR of 3.07% from 2024 to 2032. The market is significantly driven by rising demand from the food and beverage sector, expansion in emerging markets, and supportive government policies. Key applications include food and beverages, pharmaceuticals, personal care products, and biofuels, with the food and beverages sector holding a dominant share. The market is characterized by diverse sources such as sugarcane, sugar beet, corn, and palm, catering to various consumer preferences.
Key Market Trends & Highlights
The Industrial Sugar Market is experiencing transformative trends driven by consumer preferences and technological advancements.
- Food and Beverage sector projected to reach 40.0 USD Billion by 2032.
- Pharmaceuticals segment expected to grow from 12.0 USD Billion in 2023 to 15.0 USD Billion by 2032.
- Asia-Pacific region valued at 20.0 USD Billion in 2023, leading market growth.
- Granulated Sugar remains a key player, essential for food processing and beverages.
Market Size & Forecast
2022 Market Size: USD 59.13 Billion
2023 Market Size: USD 60.94 Billion
2032 Market Size: USD 80.0 Billion
CAGR (2024-2032): 3.07%
Largest Regional Market Share in 2023: Asia-Pacific.
Major Players
Key Companies include Bunge Limited, Nordzucker AG, Wilmar International, Cargill, and Archer Daniels Midland.

Source Primary Research, Secondary Research, Market Research Future Database and Analyst Review
Key Industrial Sugar Market Trends Highlighted
The Industrial Sugar Market is undergoing momentous changes that are coupled with some key factors that matter in the growth of the market. The growth in the usage of sugar across the food and beverages sector, pharmaceuticals and biofuels industry is a huge factor that is driving the growth of the market. The increase in the market for sweeter products is forcing manufacturers to try to create more innovative products. Alongside, economic advancement and lifestyle changes have also contributed to a rise in the consumption of processed food and sweetened drinks which has added to the growth of the industrial sugar market. So, the first factor also influences regulations that, in some way, determine the structure of production processes and trade patterns in these regions.
Technological improvements in sugar production alongside sustainable measures should allow the harvesting of opportunities in the market. Organic and natural sweeteners are rapidly becoming more common, giving a small market space for firms able to change with the market. The potential problem, however, is the excessive growth of sugarcane and sugar beet and their cultivation; they, however, will allow for transportable infrastructure in weaker area’s economies. Asia – Pacific and Africa markets have a massive scope of growth with their growing population and agriculture potential. There is a growing interest in bio-based materials, and this is changing the way traditional sugar companies do business – with no incentive to remain within the same or traditional markets.
Most recently, the industrialized sector of sugar has started to incorporate low-calorie sweeteners due to the rising health consciousness, leading to this trend. This encourages companies to think of lowering their calories in sweeteners while broadening the variety of their products. Furthermore, the effects of warming on sugar production also make the stakeholders look for strategies aimed at reducing the effects of such changes. Also, there are new ways of processing the sugar that are being adopted which aim at increasing the efficiency of sugar manufacture while reducing waste. In conclusion, the positioning of demand in the Industrial Sugar Market is changing recently owing partly to various technological changes and a few laws and regulations that pose both threats and opportunities for players in this industry.
Industrial Sugar Market Drivers
Rising Demand from the Food and Beverage Industry
One of the most significant drivers of growth in the Industrial Sugar Market Industry is the increasing demand from the food and beverage sector. As populations grow and consumer preferences evolve, the need for various food products, including snacks, desserts, and beverages, is expected to rise. This heightened demand is directly impacting sugar consumption as it remains a crucial ingredient in these products. The food and beverage industry is constantly innovating, needing sugar in different forms and applications ranging from baked goods to dairy products and soft drinks.
Additionally, the trend toward processed and convenience foods has contributed to the growth of the industrial sugar market, as manufacturers require bulk sugar for mass production. With a diverse range of applications, industrial sugar is essential in achieving the desired taste, texture, and preservation, further solidifying its role in industry growth. This ongoing evolution in the food sector not only sustains the existing demand for industrial sugar but also paves the way for future opportunities as new product lines, flavors, and health-conscious formulations emerge.
Furthermore, as consumer preferences lean toward natural and organic products, the industrial sugar market may also see a shift toward more sustainable and healthy alternatives, encouraging manufacturers to explore innovative sugar types and thereby expanding the overall market landscape.
Expansion of Emerging Markets
The expansion of emerging markets is a crucial driver for the Industrial Sugar Market Industry. Countries in Asia-Pacific, Latin America, and parts of Africa are witnessing a surge in economic growth, resulting in increased purchasing power among consumers. This growth has led to higher disposable incomes, prompting a shift in dietary habits and raising the demand for processed foods and beverages that often contain industrial sugar. As these regions continue to develop, urbanization and population growth further increase the need for an abundant supply of sugar for various applications, including confectionery, dairy, and baked goods.
Moreover, the establishment of new manufacturing facilities and improved logistics in these areas allows better access to sugar, thus fueling further market expansion.
Supportive Government Policies
Supportive government policies play a pivotal role in the growth of the Industrial Sugar Market Industry. Many governments worldwide recognize the significance of the sugar industry in their economies, leading to the implementation of favorable regulations and incentives aimed at boosting sugar production. Subsidies, import duties, and export incentives encourage local farmers and manufacturers to invest in sugar production. Additionally, as governments focus on food security and sustainable agricultural practices, promoting sugar production can lead to job creation and infrastructure development, further enhancing the market's growth potential.
Industrial Sugar Market Segment Insights
Industrial Sugar Application Insights Â
The Industrial Sugar Market, with a projected revenue of 60.94 USD Billion in 2023, showcases a robust segmentation across various applications, underscoring its critical relevance in multiple industries. The food and beverages sector is a significant contributor, valued at 30.0 USD Billion in 2023 and expected to reach 40.0 USD Billion by 2032, reflecting its majority holding within the market. This dominance is propelled by the growing consumer demand for processed foods and beverages and the essential role of sugar in enhancing flavor and preservation.
Meanwhile, the pharmaceuticals segment is also prominent, valued at 12.0 USD Billion in 2023 and anticipated to grow to 15.0 USD Billion in 2032. Sugar serves as a critical ingredient in various formulations, contributing not only to taste but also to medicinal properties. The personal care products market, valued at 6.0 USD Billion in 2023, is expected to expand to 8.0 USD Billion by 2032, indicating a significant utilization of sugar in product formulations for its moisturizing and exfoliating properties. The animal feed segment is anticipated to rise from 5.0 USD Billion in 2023 to 8.0 USD Billion in 2032, reflecting its importance in enhancing the nutritional value of feed, thereby supporting livestock health and productivity.
Lastly, the biofuels application, valued at 7.94 USD Billion in 2023 and projected to grow to 9.0 USD Billion by 2032, highlights sugar's role in renewable energy, showcasing its versatility beyond traditional applications. Overall, the Industrial Sugar Market data reveals strong potential for growth driven by key applications, making it a vital area for investment and innovation in the coming years. Market trends towards health-conscious consumption and sustainable practices further emphasize the need for strategic positioning in these application areas, offering both challenges and opportunities in the marketplace.
The Industrial Sugar Market industry faces competition and regulatory scrutiny in certain segments while also benefiting from expansive product versatility. The increasing collaboration between sectors could shape future market dynamics, paving the way for innovative applications. With its broad-ranging applications and steady market growth, understanding the Industrial Sugar Market statistics is crucial for stakeholders as they navigate this evolving landscape.

Source Primary Research, Secondary Research, Market Research Future Database and Analyst Review
Industrial Sugar Type Insights Â
The Industrial Sugar Market revenue demonstrates a diversified structure segmented by Type, encompassing Granulated Sugar, Liquid Sugar, Powdered Sugar, and Brown Sugar. In 2023, the overall market reached a valuation of 60.94 billion USD, highlighting the established demand across various industries. Granulated Sugar remains a prominent player in the market, primarily utilized in food processing and beverages, reflecting its indispensable role. Liquid Sugar is gaining traction due to its ease of use in production, particularly in carbonated drinks and syrups.
Powdered Sugar caters to sectors such as baking and confectionery, offering a fine texture suitable for icing and dusting. Brown Sugar, popular for its unique flavor profile, is increasingly used in gourmet and specialty food applications. This segmented approach within the Industrial Sugar Market segmentation reveals opportunities for growth driven by evolving consumer preferences and the increasing use of sugar in processed foods, pointing to a favorable landscape for market expansion. Challenges related to health trends and sugar substitutes, however, demand adaptable strategies from industry players to navigate this dynamic environment effectively.
Overall, the Industrial Sugar Market Statistics indicate promising avenues for innovation and market growth amid these fluctuations.
Industrial Sugar Source Insights Â
The Industrial Sugar Market is projected to experience notable growth driven by various sources, particularly sugarcane, sugar beet, corn, and palm. As of 2023, the overall market is valued at 60.94 billion USD, showcasing its expansive nature. Sugarcane holds a prominent share in the market, mainly due to its widespread cultivation and high sucrose content, making it a preferred source for sugar production in many regions. In contrast, sugar beet is increasingly recognized for its adaptability to cooler climates, adding diversity to the sugar source landscape.
Corn sugars are gaining traction owing to advancements in agricultural technology and a growing demand for high-fructose corn syrup, particularly in the beverage industry. Palm sugar, derived from the sap of palm trees, enjoys popularity in certain regions for its perceived health benefits and unique flavor profile. These diverse sources contribute to the Industrial Sugar Market segmentation, showcasing how different sources address varying consumer needs and preferences, paving the way for sustained market growth in the coming years. Understanding the dynamics of these sources is key for stakeholders aiming to navigate the evolving sugar industry landscape.
Industrial Sugar End Use Insights Â
The Industrial Sugar Market, valued at 60.94 USD billion in 2023, showcases significant diversity within its End Use segment, comprising categories such as Industrial, Commercial, and Retail. Each category plays a crucial role, with the Industrial segment dominating the market due to its essential applications in food production, beverages, and pharmaceuticals. This segment significantly contributes to the Industrial Sugar Market revenue as manufacturers seek to enhance product quality and taste. The Commercial segment serves a variety of businesses, including restaurants and catering services, which rely heavily on industrial sugar for both flavor and preservation purposes.
Meanwhile, the Retail segment addresses consumer needs directly, providing packaged sugars for household use. The Industrial Sugar Market statistics indicate a steady growth trend fueled by increasing demand in food and beverage industries, alongside a growing preference for naturally sourced sweeteners. Opportunities exist for market expansion, particularly in emerging economies where urbanization and changing dietary habits lead to higher consumption rates. However, challenges such as fluctuating raw material prices and regulatory constraints may impact growth.
Understanding this market segmentation is vital for stakeholders aiming to navigate and capitalize on the evolving landscape of the Industrial Sugar Market industry.
Industrial Sugar Regional Insights Â
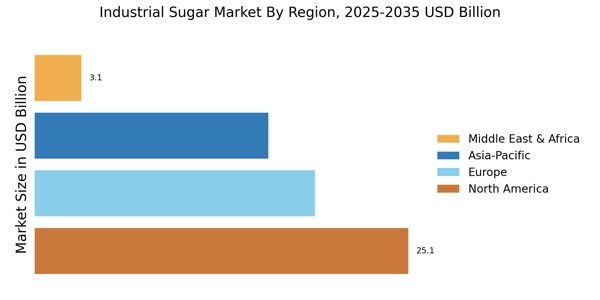
The Industrial Sugar Market has showcased strong regional dynamics, with a total valuation of 60.94 USD Billion in 2023. The APAC region leads as a major player, valued at 20.0 USD Billion, significantly influencing market growth due to its vast population and increasing demand for processed foods. Europe follows closely, contributing 14.0 USD Billion, driven by robust food and beverage industries that prioritize quality. North America holds a substantial share with a valuation of 12.5 USD Billion, indicating a diverse market where industrial sugar is utilized across various sectors.
South America and MEA represent smaller yet growing segments, valued at 7.44 USD Billion and 6.0 USD Billion, respectively, reflecting emerging opportunities in these markets. The growth in these regions is fueled by trends toward healthier food options and sustainable production methods, while challenges include fluctuating raw material prices and competition from alternative sweeteners. The Industrial Sugar Market industry is experiencing a shift as demand diversifies, making regional analysis essential for understanding market strategies.

Source Primary Research, Secondary Research, Market Research Future Database and Analyst Review
Industrial Sugar Market Key Players and Competitive Insights
The Industrial Sugar Market is characterized by a dynamic competitive landscape, which is shaped by various factors, including production capacity, technological advancements, and evolving consumer preferences. This market plays a vital role in the food and beverage industry, serving as a key ingredient in numerous applications ranging from sweeteners to preservation agents. The competitive insights applicable to this market reveal that established players are engaged in differentiating their offerings while optimizing supply chains to enhance efficiency and reduce costs. Moreover, regulatory frameworks and sustainability concerns are increasingly influencing the strategies of market participants, prompting them to innovate and adopt more eco-friendly practices. As stakeholders navigate these complexities, their ability to adapt to changing market conditions and consumer trends will likely determine their competitiveness and market positioning.
Bunge Limited stands out as a prominent player in the Industrial Sugar Market, leveraging its extensive network and robust operational capabilities. The company's strengths include a diverse range of sugar products that cater to various segments within the food and beverage industries. Bunge Limited's established relationships with key suppliers and customers allow it to maintain a competitive edge in terms of supply chain reliability and responsiveness. Additionally, the company's commitment to sustainability and innovation positions it well to meet the demands of environmentally-conscious consumers. Bunge Limited's focus on efficiency in both production processes and distribution channels further enhances its strength, helping it to mitigate market volatility and strengthen its market presence.
Nordzucker AG, another significant entity in the Industrial Sugar Market, has built a strong reputation for quality and reliability. This company benefits from a well-defined market strategy that emphasizes efficiency in sugar production and an emphasis on sustainability. Nordzucker AG is known for its innovative practices, which include modern agricultural techniques and technologies aimed at improving yield and reducing environmental impact. The company's geographic reach across Europe enhances its market positioning, allowing it to cater to a diverse customer base. By investing in research and development, Nordzucker AG continuously seeks to improve its product offerings and adapt to changing consumer preferences, reinforcing its standing in the competitive landscape of the industrial sugar sector.
Key Companies in the Industrial Sugar Market Include
Industrial Sugar Market Industry Developments
-
Q3 2025: US sugar production projected to hit record high in 2025-26 season The USDA announced that U.S. sugar production is expected to reach an all-time high of 9.42 million short tons in the 2025-26 season, driven by increased output of both beet and cane sugar. This surge is likely to boost domestic sugar availability and reduce imports, impacting market prices for farmers.
-
Q2 2025: USDA releases first 2025/26 fiscal year estimate for US sugar production On May 12, 2025, the USDA published its World Agricultural Supply and Demand Estimates, forecasting total U.S. sugar production at 9.285 million short tons raw value for the 2025/26 fiscal year, with beet sugar accounting for 56% and cane sugar for 44% of the total.
Industrial Sugar Market Segmentation Insights
-
Industrial Sugar Application Outlook
-
Industrial Sugar Type Outlook
-
Industrial Sugar Source Outlook
-
Industrial Sugar End Use Outlook
-
Industrial Sugar Regional Outlook
Attribute/Metric |
Details |
Market Size 2022 |
59.13(USD Billion) |
Market Size 2023 |
60.94(USD Billion) |
Market Size 2032 |
80.0(USD Billion) |
Compound Annual Growth Rate (CAGR) |
3.07% (2024 - 2032) |
Report Coverage |
Revenue Forecast, Competitive Landscape, Growth Factors, and Trends |
Base Year |
2023 |
Market Forecast Period |
2024 - 2032 |
Historical Data |
2019 - 2023 |
Market Forecast Units |
USD Billion |
Key Companies Profiled |
Bunge Limited, Nordzucker AG, Zhongjin Lingnan Nonfemet Company, Wilmar International, Rogers Sugar, Tereos, Cargill, American Crystal Sugar Company, Archer Daniels Midland, Associated British Foods, Mitsui and Co, Louis Dreyfus Company, Sucden, Sweeteners Plus |
Segments Covered |
Application, Type, Source, End Use, Regional |
Key Market Opportunities |
Rising demand for natural sweeteners, Growth in the food and beverage sector, Expansion in emerging markets, Increased use of biofuels, Innovations in sugar substitutes |
Key Market Dynamics |
Rising health consciousness, Fluctuating raw material prices, Growing use in food processing, Expanding biofuel production, Regulatory changes and tariffs |
Countries Covered |
North America, Europe, APAC, South America, MEA |
Industrial Sugar Market Highlights:
Frequently Asked Questions (FAQ):
The Industrial Sugar Market is expected to be valued at approximately 80.0 USD Billion by the year 2032.
The market is expected to grow at a CAGR of 3.07% during the forecast period from 2024 to 2032.
The Asia Pacific region is anticipated to dominate the market, valued at around 25.0 USD Billion by 2032.
The Food and Beverages application segment is expected to be valued at approximately 40.0 USD Billion by 2032.
The Pharmaceuticals application segment is projected to reach a market value of about 15.0 USD Billion by 2032.
Key players include Bunge Limited, Cargill, and Archer Daniels Midland, among others.
North America is expected to be valued at around 16.0 USD Billion in 2032.
The Animal Feed application segment is anticipated to reach a valuation of about 8.0 USD Billion by 2032.
The growing demand in the Food and Beverages sector presents significant growth opportunities for the market.
Potential challenges include fluctuating raw material prices and regulatory pressures impacting production.
TABLE OF CONTENTS
1. EXECUTIVE SUMMARY
1.1. Market Overview
1.2. Key Findings
1.3. Market Segmentation
1.4. Competitive Landscape
1.5. Challenges and Opportunities
1.6. Future Outlook
2. MARKET INTRODUCTION
2.1. Definition
2.2. Scope of the study
2.2.1. Research Objective
2.2.2. Assumption
2.2.3. Limitations
3. RESEARCH METHODOLOGY
3.1. Overview
3.2. Data Mining
3.3. Secondary Research
3.4. Primary Research
3.4.1. Primary Interviews and Information Gathering Process
3.4.2. Breakdown of Primary Respondents
3.5. Forecasting Model
3.6. Market Size Estimation
3.6.1. Bottom-Up Approach
3.6.2. Top-Down Approach
3.7. Data Triangulation
3.8. Validation
4. MARKET DYNAMICS
4.1. Overview
4.2. Drivers
4.3. Restraints
4.4. Opportunities
5. MARKET FACTOR ANALYSIS
5.1. Value chain Analysis
5.2. Porter's Five Forces Analysis
5.2.1. Bargaining Power of Suppliers
5.2.2. Bargaining Power of Buyers
5.2.3. Threat of New Entrants
5.2.4. Threat of Substitutes
5.2.5. Intensity of Rivalry
5.3. COVID-19 Impact Analysis
5.3.1. Market Impact Analysis
5.3.2. Regional Impact
5.3.3. Opportunity and Threat Analysis
6. INDUSTRIAL SUGAR MARKET, BY APPLICATION (USD BILLION)
6.1. Food and Beverages
6.2. Pharmaceuticals
6.3. Personal Care Products
6.4. Animal Feed
6.5. Biofuels
7. INDUSTRIAL SUGAR MARKET, BY TYPE (USD BILLION)
7.1. Granulated Sugar
7.2. Liquid Sugar
7.3. Powdered Sugar
7.4. Brown Sugar
8. INDUSTRIAL SUGAR MARKET, BY SOURCE (USD BILLION)
8.1. Sugarcane
8.2. Sugar Beet
8.3. Corn
8.4. Palm
9. INDUSTRIAL SUGAR MARKET, BY END USE (USD BILLION)
9.1. Industrial
9.2. Commercial
9.3. Retail
10. INDUSTRIAL SUGAR MARKET, BY REGIONAL (USD BILLION)
10.1. North America
10.1.1. US
10.1.2. Canada
10.2. Europe
10.2.1. Germany
10.2.2. UK
10.2.3. France
10.2.4. Russia
10.2.5. Italy
10.2.6. Spain
10.2.7. Rest of Europe
10.3. APAC
10.3.1. China
10.3.2. India
10.3.3. Japan
10.3.4. South Korea
10.3.5. Malaysia
10.3.6. Thailand
10.3.7. Indonesia
10.3.8. Rest of APAC
10.4. South America
10.4.1. Brazil
10.4.2. Mexico
10.4.3. Argentina
10.4.4. Rest of South America
10.5. MEA
10.5.1. GCC Countries
10.5.2. South Africa
10.5.3. Rest of MEA
11. COMPETITIVE LANDSCAPE
11.1. Overview
11.2. Competitive Analysis
11.3. Market share Analysis
11.4. Major Growth Strategy in the Industrial Sugar Market
11.5. Competitive Benchmarking
11.6. Leading Players in Terms of Number of Developments in the Industrial Sugar Market
11.7. Key developments and growth strategies
11.7.1. New Product Launch/Service Deployment
11.7.2. Merger & Acquisitions
11.7.3. Joint Ventures
11.8. Major Players Financial Matrix
11.8.1. Sales and Operating Income
11.8.2. Major Players R&D Expenditure. 2023
12. COMPANY PROFILES
12.1. Bunge Limited
12.1.1. Financial Overview
12.1.2. Products Offered
12.1.3. Key Developments
12.1.4. SWOT Analysis
12.1.5. Key Strategies
12.2. Nordzucker AG
12.2.1. Financial Overview
12.2.2. Products Offered
12.2.3. Key Developments
12.2.4. SWOT Analysis
12.2.5. Key Strategies
12.3. Zhongjin Lingnan Nonfemet Company
12.3.1. Financial Overview
12.3.2. Products Offered
12.3.3. Key Developments
12.3.4. SWOT Analysis
12.3.5. Key Strategies
12.4. Wilmar International
12.4.1. Financial Overview
12.4.2. Products Offered
12.4.3. Key Developments
12.4.4. SWOT Analysis
12.4.5. Key Strategies
12.5. Rogers Sugar
12.5.1. Financial Overview
12.5.2. Products Offered
12.5.3. Key Developments
12.5.4. SWOT Analysis
12.5.5. Key Strategies
12.6. Tereos
12.6.1. Financial Overview
12.6.2. Products Offered
12.6.3. Key Developments
12.6.4. SWOT Analysis
12.6.5. Key Strategies
12.7. Cargill
12.7.1. Financial Overview
12.7.2. Products Offered
12.7.3. Key Developments
12.7.4. SWOT Analysis
12.7.5. Key Strategies
12.8. American Crystal Sugar Company
12.8.1. Financial Overview
12.8.2. Products Offered
12.8.3. Key Developments
12.8.4. SWOT Analysis
12.8.5. Key Strategies
12.9. Archer Daniels Midland
12.9.1. Financial Overview
12.9.2. Products Offered
12.9.3. Key Developments
12.9.4. SWOT Analysis
12.9.5. Key Strategies
12.10. Associated British Foods
12.10.1. Financial Overview
12.10.2. Products Offered
12.10.3. Key Developments
12.10.4. SWOT Analysis
12.10.5. Key Strategies
12.11. Mitsui and Co
12.11.1. Financial Overview
12.11.2. Products Offered
12.11.3. Key Developments
12.11.4. SWOT Analysis
12.11.5. Key Strategies
12.12. Louis Dreyfus Company
12.12.1. Financial Overview
12.12.2. Products Offered
12.12.3. Key Developments
12.12.4. SWOT Analysis
12.12.5. Key Strategies
12.13. Sucden
12.13.1. Financial Overview
12.13.2. Products Offered
12.13.3. Key Developments
12.13.4. SWOT Analysis
12.13.5. Key Strategies
12.14. Sweeteners Plus
12.14.1. Financial Overview
12.14.2. Products Offered
12.14.3. Key Developments
12.14.4. SWOT Analysis
12.14.5. Key Strategies
13. APPENDIX
13.1. References
13.2. Related Reports
LIST OF TABLES
TABLE 1. LIST OF ASSUMPTIONS
TABLE 2. NORTH AMERICA INDUSTRIAL SUGAR MARKET SIZE ESTIMATES & FORECAST, BY APPLICATION, 2019-2032 (USD BILLIONS)
TABLE 3. NORTH AMERICA INDUSTRIAL SUGAR MARKET SIZE ESTIMATES & FORECAST, BY TYPE, 2019-2032 (USD BILLIONS)
TABLE 4. NORTH AMERICA INDUSTRIAL SUGAR MARKET SIZE ESTIMATES & FORECAST, BY SOURCE, 2019-2032 (USD BILLIONS)
TABLE 5. NORTH AMERICA INDUSTRIAL SUGAR MARKET SIZE ESTIMATES & FORECAST, BY END USE, 2019-2032 (USD BILLIONS)
TABLE 6. NORTH AMERICA INDUSTRIAL SUGAR MARKET SIZE ESTIMATES & FORECAST, BY REGIONAL, 2019-2032 (USD BILLIONS)
TABLE 7. US INDUSTRIAL SUGAR MARKET SIZE ESTIMATES & FORECAST, BY APPLICATION, 2019-2032 (USD BILLIONS)
TABLE 8. US INDUSTRIAL SUGAR MARKET SIZE ESTIMATES & FORECAST, BY TYPE, 2019-2032 (USD BILLIONS)
TABLE 9. US INDUSTRIAL SUGAR MARKET SIZE ESTIMATES & FORECAST, BY SOURCE, 2019-2032 (USD BILLIONS)
TABLE 10. US INDUSTRIAL SUGAR MARKET SIZE ESTIMATES & FORECAST, BY END USE, 2019-2032 (USD BILLIONS)
TABLE 11. US INDUSTRIAL SUGAR MARKET SIZE ESTIMATES & FORECAST, BY REGIONAL, 2019-2032 (USD BILLIONS)
TABLE 12. CANADA INDUSTRIAL SUGAR MARKET SIZE ESTIMATES & FORECAST, BY APPLICATION, 2019-2032 (USD BILLIONS)
TABLE 13. CANADA INDUSTRIAL SUGAR MARKET SIZE ESTIMATES & FORECAST, BY TYPE, 2019-2032 (USD BILLIONS)
TABLE 14. CANADA INDUSTRIAL SUGAR MARKET SIZE ESTIMATES & FORECAST, BY SOURCE, 2019-2032 (USD BILLIONS)
TABLE 15. CANADA INDUSTRIAL SUGAR MARKET SIZE ESTIMATES & FORECAST, BY END USE, 2019-2032 (USD BILLIONS)
TABLE 16. CANADA INDUSTRIAL SUGAR MARKET SIZE ESTIMATES & FORECAST, BY REGIONAL, 2019-2032 (USD BILLIONS)
TABLE 17. EUROPE INDUSTRIAL SUGAR MARKET SIZE ESTIMATES & FORECAST, BY APPLICATION, 2019-2032 (USD BILLIONS)
TABLE 18. EUROPE INDUSTRIAL SUGAR MARKET SIZE ESTIMATES & FORECAST, BY TYPE, 2019-2032 (USD BILLIONS)
TABLE 19. EUROPE INDUSTRIAL SUGAR MARKET SIZE ESTIMATES & FORECAST, BY SOURCE, 2019-2032 (USD BILLIONS)
TABLE 20. EUROPE INDUSTRIAL SUGAR MARKET SIZE ESTIMATES & FORECAST, BY END USE, 2019-2032 (USD BILLIONS)
TABLE 21. EUROPE INDUSTRIAL SUGAR MARKET SIZE ESTIMATES & FORECAST, BY REGIONAL, 2019-2032 (USD BILLIONS)
TABLE 22. GERMANY INDUSTRIAL SUGAR MARKET SIZE ESTIMATES & FORECAST, BY APPLICATION, 2019-2032 (USD BILLIONS)
TABLE 23. GERMANY INDUSTRIAL SUGAR MARKET SIZE ESTIMATES & FORECAST, BY TYPE, 2019-2032 (USD BILLIONS)
TABLE 24. GERMANY INDUSTRIAL SUGAR MARKET SIZE ESTIMATES & FORECAST, BY SOURCE, 2019-2032 (USD BILLIONS)
TABLE 25. GERMANY INDUSTRIAL SUGAR MARKET SIZE ESTIMATES & FORECAST, BY END USE, 2019-2032 (USD BILLIONS)
TABLE 26. GERMANY INDUSTRIAL SUGAR MARKET SIZE ESTIMATES & FORECAST, BY REGIONAL, 2019-2032 (USD BILLIONS)
TABLE 27. UK INDUSTRIAL SUGAR MARKET SIZE ESTIMATES & FORECAST, BY APPLICATION, 2019-2032 (USD BILLIONS)
TABLE 28. UK INDUSTRIAL SUGAR MARKET SIZE ESTIMATES & FORECAST, BY TYPE, 2019-2032 (USD BILLIONS)
TABLE 29. UK INDUSTRIAL SUGAR MARKET SIZE ESTIMATES & FORECAST, BY SOURCE, 2019-2032 (USD BILLIONS)
TABLE 30. UK INDUSTRIAL SUGAR MARKET SIZE ESTIMATES & FORECAST, BY END USE, 2019-2032 (USD BILLIONS)
TABLE 31. UK INDUSTRIAL SUGAR MARKET SIZE ESTIMATES & FORECAST, BY REGIONAL, 2019-2032 (USD BILLIONS)
TABLE 32. FRANCE INDUSTRIAL SUGAR MARKET SIZE ESTIMATES & FORECAST, BY APPLICATION, 2019-2032 (USD BILLIONS)
TABLE 33. FRANCE INDUSTRIAL SUGAR MARKET SIZE ESTIMATES & FORECAST, BY TYPE, 2019-2032 (USD BILLIONS)
TABLE 34. FRANCE INDUSTRIAL SUGAR MARKET SIZE ESTIMATES & FORECAST, BY SOURCE, 2019-2032 (USD BILLIONS)
TABLE 35. FRANCE INDUSTRIAL SUGAR MARKET SIZE ESTIMATES & FORECAST, BY END USE, 2019-2032 (USD BILLIONS)
TABLE 36. FRANCE INDUSTRIAL SUGAR MARKET SIZE ESTIMATES & FORECAST, BY REGIONAL, 2019-2032 (USD BILLIONS)
TABLE 37. RUSSIA INDUSTRIAL SUGAR MARKET SIZE ESTIMATES & FORECAST, BY APPLICATION, 2019-2032 (USD BILLIONS)
TABLE 38. RUSSIA INDUSTRIAL SUGAR MARKET SIZE ESTIMATES & FORECAST, BY TYPE, 2019-2032 (USD BILLIONS)
TABLE 39. RUSSIA INDUSTRIAL SUGAR MARKET SIZE ESTIMATES & FORECAST, BY SOURCE, 2019-2032 (USD BILLIONS)
TABLE 40. RUSSIA INDUSTRIAL SUGAR MARKET SIZE ESTIMATES & FORECAST, BY END USE, 2019-2032 (USD BILLIONS)
TABLE 41. RUSSIA INDUSTRIAL SUGAR MARKET SIZE ESTIMATES & FORECAST, BY REGIONAL, 2019-2032 (USD BILLIONS)
TABLE 42. ITALY INDUSTRIAL SUGAR MARKET SIZE ESTIMATES & FORECAST, BY APPLICATION, 2019-2032 (USD BILLIONS)
TABLE 43. ITALY INDUSTRIAL SUGAR MARKET SIZE ESTIMATES & FORECAST, BY TYPE, 2019-2032 (USD BILLIONS)
TABLE 44. ITALY INDUSTRIAL SUGAR MARKET SIZE ESTIMATES & FORECAST, BY SOURCE, 2019-2032 (USD BILLIONS)
TABLE 45. ITALY INDUSTRIAL SUGAR MARKET SIZE ESTIMATES & FORECAST, BY END USE, 2019-2032 (USD BILLIONS)
TABLE 46. ITALY INDUSTRIAL SUGAR MARKET SIZE ESTIMATES & FORECAST, BY REGIONAL, 2019-2032 (USD BILLIONS)
TABLE 47. SPAIN INDUSTRIAL SUGAR MARKET SIZE ESTIMATES & FORECAST, BY APPLICATION, 2019-2032 (USD BILLIONS)
TABLE 48. SPAIN INDUSTRIAL SUGAR MARKET SIZE ESTIMATES & FORECAST, BY TYPE, 2019-2032 (USD BILLIONS)
TABLE 49. SPAIN INDUSTRIAL SUGAR MARKET SIZE ESTIMATES & FORECAST, BY SOURCE, 2019-2032 (USD BILLIONS)
TABLE 50. SPAIN INDUSTRIAL SUGAR MARKET SIZE ESTIMATES & FORECAST, BY END USE, 2019-2032 (USD BILLIONS)
TABLE 51. SPAIN INDUSTRIAL SUGAR MARKET SIZE ESTIMATES & FORECAST, BY REGIONAL, 2019-2032 (USD BILLIONS)
TABLE 52. REST OF EUROPE INDUSTRIAL SUGAR MARKET SIZE ESTIMATES & FORECAST, BY APPLICATION, 2019-2032 (USD BILLIONS)
TABLE 53. REST OF EUROPE INDUSTRIAL SUGAR MARKET SIZE ESTIMATES & FORECAST, BY TYPE, 2019-2032 (USD BILLIONS)
TABLE 54. REST OF EUROPE INDUSTRIAL SUGAR MARKET SIZE ESTIMATES & FORECAST, BY SOURCE, 2019-2032 (USD BILLIONS)
TABLE 55. REST OF EUROPE INDUSTRIAL SUGAR MARKET SIZE ESTIMATES & FORECAST, BY END USE, 2019-2032 (USD BILLIONS)
TABLE 56. REST OF EUROPE INDUSTRIAL SUGAR MARKET SIZE ESTIMATES & FORECAST, BY REGIONAL, 2019-2032 (USD BILLIONS)
TABLE 57. APAC INDUSTRIAL SUGAR MARKET SIZE ESTIMATES & FORECAST, BY APPLICATION, 2019-2032 (USD BILLIONS)
TABLE 58. APAC INDUSTRIAL SUGAR MARKET SIZE ESTIMATES & FORECAST, BY TYPE, 2019-2032 (USD BILLIONS)
TABLE 59. APAC INDUSTRIAL SUGAR MARKET SIZE ESTIMATES & FORECAST, BY SOURCE, 2019-2032 (USD BILLIONS)
TABLE 60. APAC INDUSTRIAL SUGAR MARKET SIZE ESTIMATES & FORECAST, BY END USE, 2019-2032 (USD BILLIONS)
TABLE 61. APAC INDUSTRIAL SUGAR MARKET SIZE ESTIMATES & FORECAST, BY REGIONAL, 2019-2032 (USD BILLIONS)
TABLE 62. CHINA INDUSTRIAL SUGAR MARKET SIZE ESTIMATES & FORECAST, BY APPLICATION, 2019-2032 (USD BILLIONS)
TABLE 63. CHINA INDUSTRIAL SUGAR MARKET SIZE ESTIMATES & FORECAST, BY TYPE, 2019-2032 (USD BILLIONS)
TABLE 64. CHINA INDUSTRIAL SUGAR MARKET SIZE ESTIMATES & FORECAST, BY SOURCE, 2019-2032 (USD BILLIONS)
TABLE 65. CHINA INDUSTRIAL SUGAR MARKET SIZE ESTIMATES & FORECAST, BY END USE, 2019-2032 (USD BILLIONS)
TABLE 66. CHINA INDUSTRIAL SUGAR MARKET SIZE ESTIMATES & FORECAST, BY REGIONAL, 2019-2032 (USD BILLIONS)
TABLE 67. INDIA INDUSTRIAL SUGAR MARKET SIZE ESTIMATES & FORECAST, BY APPLICATION, 2019-2032 (USD BILLIONS)
TABLE 68. INDIA INDUSTRIAL SUGAR MARKET SIZE ESTIMATES & FORECAST, BY TYPE, 2019-2032 (USD BILLIONS)
TABLE 69. INDIA INDUSTRIAL SUGAR MARKET SIZE ESTIMATES & FORECAST, BY SOURCE, 2019-2032 (USD BILLIONS)
TABLE 70. INDIA INDUSTRIAL SUGAR MARKET SIZE ESTIMATES & FORECAST, BY END USE, 2019-2032 (USD BILLIONS)
TABLE 71. INDIA INDUSTRIAL SUGAR MARKET SIZE ESTIMATES & FORECAST, BY REGIONAL, 2019-2032 (USD BILLIONS)
TABLE 72. JAPAN INDUSTRIAL SUGAR MARKET SIZE ESTIMATES & FORECAST, BY APPLICATION, 2019-2032 (USD BILLIONS)
TABLE 73. JAPAN INDUSTRIAL SUGAR MARKET SIZE ESTIMATES & FORECAST, BY TYPE, 2019-2032 (USD BILLIONS)
TABLE 74. JAPAN INDUSTRIAL SUGAR MARKET SIZE ESTIMATES & FORECAST, BY SOURCE, 2019-2032 (USD BILLIONS)
TABLE 75. JAPAN INDUSTRIAL SUGAR MARKET SIZE ESTIMATES & FORECAST, BY END USE, 2019-2032 (USD BILLIONS)
TABLE 76. JAPAN INDUSTRIAL SUGAR MARKET SIZE ESTIMATES & FORECAST, BY REGIONAL, 2019-2032 (USD BILLIONS)
TABLE 77. SOUTH KOREA INDUSTRIAL SUGAR MARKET SIZE ESTIMATES & FORECAST, BY APPLICATION, 2019-2032 (USD BILLIONS)
TABLE 78. SOUTH KOREA INDUSTRIAL SUGAR MARKET SIZE ESTIMATES & FORECAST, BY TYPE, 2019-2032 (USD BILLIONS)
TABLE 79. SOUTH KOREA INDUSTRIAL SUGAR MARKET SIZE ESTIMATES & FORECAST, BY SOURCE, 2019-2032 (USD BILLIONS)
TABLE 80. SOUTH KOREA INDUSTRIAL SUGAR MARKET SIZE ESTIMATES & FORECAST, BY END USE, 2019-2032 (USD BILLIONS)
TABLE 81. SOUTH KOREA INDUSTRIAL SUGAR MARKET SIZE ESTIMATES & FORECAST, BY REGIONAL, 2019-2032 (USD BILLIONS)
TABLE 82. MALAYSIA INDUSTRIAL SUGAR MARKET SIZE ESTIMATES & FORECAST, BY APPLICATION, 2019-2032 (USD BILLIONS)
TABLE 83. MALAYSIA INDUSTRIAL SUGAR MARKET SIZE ESTIMATES & FORECAST, BY TYPE, 2019-2032 (USD BILLIONS)
TABLE 84. MALAYSIA INDUSTRIAL SUGAR MARKET SIZE ESTIMATES & FORECAST, BY SOURCE, 2019-2032 (USD BILLIONS)
TABLE 85. MALAYSIA INDUSTRIAL SUGAR MARKET SIZE ESTIMATES & FORECAST, BY END USE, 2019-2032 (USD BILLIONS)
TABLE 86. MALAYSIA INDUSTRIAL SUGAR MARKET SIZE ESTIMATES & FORECAST, BY REGIONAL, 2019-2032 (USD BILLIONS)
TABLE 87. THAILAND INDUSTRIAL SUGAR MARKET SIZE ESTIMATES & FORECAST, BY APPLICATION, 2019-2032 (USD BILLIONS)
TABLE 88. THAILAND INDUSTRIAL SUGAR MARKET SIZE ESTIMATES & FORECAST, BY TYPE, 2019-2032 (USD BILLIONS)
TABLE 89. THAILAND INDUSTRIAL SUGAR MARKET SIZE ESTIMATES & FORECAST, BY SOURCE, 2019-2032 (USD BILLIONS)
TABLE 90. THAILAND INDUSTRIAL SUGAR MARKET SIZE ESTIMATES & FORECAST, BY END USE, 2019-2032 (USD BILLIONS)
TABLE 91. THAILAND INDUSTRIAL SUGAR MARKET SIZE ESTIMATES & FORECAST, BY REGIONAL, 2019-2032 (USD BILLIONS)
TABLE 92. INDONESIA INDUSTRIAL SUGAR MARKET SIZE ESTIMATES & FORECAST, BY APPLICATION, 2019-2032 (USD BILLIONS)
TABLE 93. INDONESIA INDUSTRIAL SUGAR MARKET SIZE ESTIMATES & FORECAST, BY TYPE, 2019-2032 (USD BILLIONS)
TABLE 94. INDONESIA INDUSTRIAL SUGAR MARKET SIZE ESTIMATES & FORECAST, BY SOURCE, 2019-2032 (USD BILLIONS)
TABLE 95. INDONESIA INDUSTRIAL SUGAR MARKET SIZE ESTIMATES & FORECAST, BY END USE, 2019-2032 (USD BILLIONS)
TABLE 96. INDONESIA INDUSTRIAL SUGAR MARKET SIZE ESTIMATES & FORECAST, BY REGIONAL, 2019-2032 (USD BILLIONS)
TABLE 97. REST OF APAC INDUSTRIAL SUGAR MARKET SIZE ESTIMATES & FORECAST, BY APPLICATION, 2019-2032 (USD BILLIONS)
TABLE 98. REST OF APAC INDUSTRIAL SUGAR MARKET SIZE ESTIMATES & FORECAST, BY TYPE, 2019-2032 (USD BILLIONS)
TABLE 99. REST OF APAC INDUSTRIAL SUGAR MARKET SIZE ESTIMATES & FORECAST, BY SOURCE, 2019-2032 (USD BILLIONS)
TABLE 100. REST OF APAC INDUSTRIAL SUGAR MARKET SIZE ESTIMATES & FORECAST, BY END USE, 2019-2032 (USD BILLIONS)
TABLE 101. REST OF APAC INDUSTRIAL SUGAR MARKET SIZE ESTIMATES & FORECAST, BY REGIONAL, 2019-2032 (USD BILLIONS)
TABLE 102. SOUTH AMERICA INDUSTRIAL SUGAR MARKET SIZE ESTIMATES & FORECAST, BY APPLICATION, 2019-2032 (USD BILLIONS)
TABLE 103. SOUTH AMERICA INDUSTRIAL SUGAR MARKET SIZE ESTIMATES & FORECAST, BY TYPE, 2019-2032 (USD BILLIONS)
TABLE 104. SOUTH AMERICA INDUSTRIAL SUGAR MARKET SIZE ESTIMATES & FORECAST, BY SOURCE, 2019-2032 (USD BILLIONS)
TABLE 105. SOUTH AMERICA INDUSTRIAL SUGAR MARKET SIZE ESTIMATES & FORECAST, BY END USE, 2019-2032 (USD BILLIONS)
TABLE 106. SOUTH AMERICA INDUSTRIAL SUGAR MARKET SIZE ESTIMATES & FORECAST, BY REGIONAL, 2019-2032 (USD BILLIONS)
TABLE 107. BRAZIL INDUSTRIAL SUGAR MARKET SIZE ESTIMATES & FORECAST, BY APPLICATION, 2019-2032 (USD BILLIONS)
TABLE 108. BRAZIL INDUSTRIAL SUGAR MARKET SIZE ESTIMATES & FORECAST, BY TYPE, 2019-2032 (USD BILLIONS)
TABLE 109. BRAZIL INDUSTRIAL SUGAR MARKET SIZE ESTIMATES & FORECAST, BY SOURCE, 2019-2032 (USD BILLIONS)
TABLE 110. BRAZIL INDUSTRIAL SUGAR MARKET SIZE ESTIMATES & FORECAST, BY END USE, 2019-2032 (USD BILLIONS)
TABLE 111. BRAZIL INDUSTRIAL SUGAR MARKET SIZE ESTIMATES & FORECAST, BY REGIONAL, 2019-2032 (USD BILLIONS)
TABLE 112. MEXICO INDUSTRIAL SUGAR MARKET SIZE ESTIMATES & FORECAST, BY APPLICATION, 2019-2032 (USD BILLIONS)
TABLE 113. MEXICO INDUSTRIAL SUGAR MARKET SIZE ESTIMATES & FORECAST, BY TYPE, 2019-2032 (USD BILLIONS)
TABLE 114. MEXICO INDUSTRIAL SUGAR MARKET SIZE ESTIMATES & FORECAST, BY SOURCE, 2019-2032 (USD BILLIONS)
TABLE 115. MEXICO INDUSTRIAL SUGAR MARKET SIZE ESTIMATES & FORECAST, BY END USE, 2019-2032 (USD BILLIONS)
TABLE 116. MEXICO INDUSTRIAL SUGAR MARKET SIZE ESTIMATES & FORECAST, BY REGIONAL, 2019-2032 (USD BILLIONS)
TABLE 117. ARGENTINA INDUSTRIAL SUGAR MARKET SIZE ESTIMATES & FORECAST, BY APPLICATION, 2019-2032 (USD BILLIONS)
TABLE 118. ARGENTINA INDUSTRIAL SUGAR MARKET SIZE ESTIMATES & FORECAST, BY TYPE, 2019-2032 (USD BILLIONS)
TABLE 119. ARGENTINA INDUSTRIAL SUGAR MARKET SIZE ESTIMATES & FORECAST, BY SOURCE, 2019-2032 (USD BILLIONS)
TABLE 120. ARGENTINA INDUSTRIAL SUGAR MARKET SIZE ESTIMATES & FORECAST, BY END USE, 2019-2032 (USD BILLIONS)
TABLE 121. ARGENTINA INDUSTRIAL SUGAR MARKET SIZE ESTIMATES & FORECAST, BY REGIONAL, 2019-2032 (USD BILLIONS)
TABLE 122. REST OF SOUTH AMERICA INDUSTRIAL SUGAR MARKET SIZE ESTIMATES & FORECAST, BY APPLICATION, 2019-2032 (USD BILLIONS)
TABLE 123. REST OF SOUTH AMERICA INDUSTRIAL SUGAR MARKET SIZE ESTIMATES & FORECAST, BY TYPE, 2019-2032 (USD BILLIONS)
TABLE 124. REST OF SOUTH AMERICA INDUSTRIAL SUGAR MARKET SIZE ESTIMATES & FORECAST, BY SOURCE, 2019-2032 (USD BILLIONS)
TABLE 125. REST OF SOUTH AMERICA INDUSTRIAL SUGAR MARKET SIZE ESTIMATES & FORECAST, BY END USE, 2019-2032 (USD BILLIONS)
TABLE 126. REST OF SOUTH AMERICA INDUSTRIAL SUGAR MARKET SIZE ESTIMATES & FORECAST, BY REGIONAL, 2019-2032 (USD BILLIONS)
TABLE 127. MEA INDUSTRIAL SUGAR MARKET SIZE ESTIMATES & FORECAST, BY APPLICATION, 2019-2032 (USD BILLIONS)
TABLE 128. MEA INDUSTRIAL SUGAR MARKET SIZE ESTIMATES & FORECAST, BY TYPE, 2019-2032 (USD BILLIONS)
TABLE 129. MEA INDUSTRIAL SUGAR MARKET SIZE ESTIMATES & FORECAST, BY SOURCE, 2019-2032 (USD BILLIONS)
TABLE 130. MEA INDUSTRIAL SUGAR MARKET SIZE ESTIMATES & FORECAST, BY END USE, 2019-2032 (USD BILLIONS)
TABLE 131. MEA INDUSTRIAL SUGAR MARKET SIZE ESTIMATES & FORECAST, BY REGIONAL, 2019-2032 (USD BILLIONS)
TABLE 132. GCC COUNTRIES INDUSTRIAL SUGAR MARKET SIZE ESTIMATES & FORECAST, BY APPLICATION, 2019-2032 (USD BILLIONS)
TABLE 133. GCC COUNTRIES INDUSTRIAL SUGAR MARKET SIZE ESTIMATES & FORECAST, BY TYPE, 2019-2032 (USD BILLIONS)
TABLE 134. GCC COUNTRIES INDUSTRIAL SUGAR MARKET SIZE ESTIMATES & FORECAST, BY SOURCE, 2019-2032 (USD BILLIONS)
TABLE 135. GCC COUNTRIES INDUSTRIAL SUGAR MARKET SIZE ESTIMATES & FORECAST, BY END USE, 2019-2032 (USD BILLIONS)
TABLE 136. GCC COUNTRIES INDUSTRIAL SUGAR MARKET SIZE ESTIMATES & FORECAST, BY REGIONAL, 2019-2032 (USD BILLIONS)
TABLE 137. SOUTH AFRICA INDUSTRIAL SUGAR MARKET SIZE ESTIMATES & FORECAST, BY APPLICATION, 2019-2032 (USD BILLIONS)
TABLE 138. SOUTH AFRICA INDUSTRIAL SUGAR MARKET SIZE ESTIMATES & FORECAST, BY TYPE, 2019-2032 (USD BILLIONS)
TABLE 139. SOUTH AFRICA INDUSTRIAL SUGAR MARKET SIZE ESTIMATES & FORECAST, BY SOURCE, 2019-2032 (USD BILLIONS)
TABLE 140. SOUTH AFRICA INDUSTRIAL SUGAR MARKET SIZE ESTIMATES & FORECAST, BY END USE, 2019-2032 (USD BILLIONS)
TABLE 141. SOUTH AFRICA INDUSTRIAL SUGAR MARKET SIZE ESTIMATES & FORECAST, BY REGIONAL, 2019-2032 (USD BILLIONS)
TABLE 142. REST OF MEA INDUSTRIAL SUGAR MARKET SIZE ESTIMATES & FORECAST, BY APPLICATION, 2019-2032 (USD BILLIONS)
TABLE 143. REST OF MEA INDUSTRIAL SUGAR MARKET SIZE ESTIMATES & FORECAST, BY TYPE, 2019-2032 (USD BILLIONS)
TABLE 144. REST OF MEA INDUSTRIAL SUGAR MARKET SIZE ESTIMATES & FORECAST, BY SOURCE, 2019-2032 (USD BILLIONS)
TABLE 145. REST OF MEA INDUSTRIAL SUGAR MARKET SIZE ESTIMATES & FORECAST, BY END USE, 2019-2032 (USD BILLIONS)
TABLE 146. REST OF MEA INDUSTRIAL SUGAR MARKET SIZE ESTIMATES & FORECAST, BY REGIONAL, 2019-2032 (USD BILLIONS)
TABLE 147. PRODUCT LAUNCH/PRODUCT DEVELOPMENT/APPROVAL
TABLE 148. ACQUISITION/PARTNERSHIP
LIST OF FIGURES
FIGURE 1. MARKET SYNOPSIS
FIGURE 2. NORTH AMERICA INDUSTRIAL SUGAR MARKET ANALYSIS
FIGURE 3. US INDUSTRIAL SUGAR MARKET ANALYSIS BY APPLICATION
FIGURE 4. US INDUSTRIAL SUGAR MARKET ANALYSIS BY TYPE
FIGURE 5. US INDUSTRIAL SUGAR MARKET ANALYSIS BY SOURCE
FIGURE 6. US INDUSTRIAL SUGAR MARKET ANALYSIS BY END USE
FIGURE 7. US INDUSTRIAL SUGAR MARKET ANALYSIS BY REGIONAL
FIGURE 8. CANADA INDUSTRIAL SUGAR MARKET ANALYSIS BY APPLICATION
FIGURE 9. CANADA INDUSTRIAL SUGAR MARKET ANALYSIS BY TYPE
FIGURE 10. CANADA INDUSTRIAL SUGAR MARKET ANALYSIS BY SOURCE
FIGURE 11. CANADA INDUSTRIAL SUGAR MARKET ANALYSIS BY END USE
FIGURE 12. CANADA INDUSTRIAL SUGAR MARKET ANALYSIS BY REGIONAL
FIGURE 13. EUROPE INDUSTRIAL SUGAR MARKET ANALYSIS
FIGURE 14. GERMANY INDUSTRIAL SUGAR MARKET ANALYSIS BY APPLICATION
FIGURE 15. GERMANY INDUSTRIAL SUGAR MARKET ANALYSIS BY TYPE
FIGURE 16. GERMANY INDUSTRIAL SUGAR MARKET ANALYSIS BY SOURCE
FIGURE 17. GERMANY INDUSTRIAL SUGAR MARKET ANALYSIS BY END USE
FIGURE 18. GERMANY INDUSTRIAL SUGAR MARKET ANALYSIS BY REGIONAL
FIGURE 19. UK INDUSTRIAL SUGAR MARKET ANALYSIS BY APPLICATION
FIGURE 20. UK INDUSTRIAL SUGAR MARKET ANALYSIS BY TYPE
FIGURE 21. UK INDUSTRIAL SUGAR MARKET ANALYSIS BY SOURCE
FIGURE 22. UK INDUSTRIAL SUGAR MARKET ANALYSIS BY END USE
FIGURE 23. UK INDUSTRIAL SUGAR MARKET ANALYSIS BY REGIONAL
FIGURE 24. FRANCE INDUSTRIAL SUGAR MARKET ANALYSIS BY APPLICATION
FIGURE 25. FRANCE INDUSTRIAL SUGAR MARKET ANALYSIS BY TYPE
FIGURE 26. FRANCE INDUSTRIAL SUGAR MARKET ANALYSIS BY SOURCE
FIGURE 27. FRANCE INDUSTRIAL SUGAR MARKET ANALYSIS BY END USE
FIGURE 28. FRANCE INDUSTRIAL SUGAR MARKET ANALYSIS BY REGIONAL
FIGURE 29. RUSSIA INDUSTRIAL SUGAR MARKET ANALYSIS BY APPLICATION
FIGURE 30. RUSSIA INDUSTRIAL SUGAR MARKET ANALYSIS BY TYPE
FIGURE 31. RUSSIA INDUSTRIAL SUGAR MARKET ANALYSIS BY SOURCE
FIGURE 32. RUSSIA INDUSTRIAL SUGAR MARKET ANALYSIS BY END USE
FIGURE 33. RUSSIA INDUSTRIAL SUGAR MARKET ANALYSIS BY REGIONAL
FIGURE 34. ITALY INDUSTRIAL SUGAR MARKET ANALYSIS BY APPLICATION
FIGURE 35. ITALY INDUSTRIAL SUGAR MARKET ANALYSIS BY TYPE
FIGURE 36. ITALY INDUSTRIAL SUGAR MARKET ANALYSIS BY SOURCE
FIGURE 37. ITALY INDUSTRIAL SUGAR MARKET ANALYSIS BY END USE
FIGURE 38. ITALY INDUSTRIAL SUGAR MARKET ANALYSIS BY REGIONAL
FIGURE 39. SPAIN INDUSTRIAL SUGAR MARKET ANALYSIS BY APPLICATION
FIGURE 40. SPAIN INDUSTRIAL SUGAR MARKET ANALYSIS BY TYPE
FIGURE 41. SPAIN INDUSTRIAL SUGAR MARKET ANALYSIS BY SOURCE
FIGURE 42. SPAIN INDUSTRIAL SUGAR MARKET ANALYSIS BY END USE
FIGURE 43. SPAIN INDUSTRIAL SUGAR MARKET ANALYSIS BY REGIONAL
FIGURE 44. REST OF EUROPE INDUSTRIAL SUGAR MARKET ANALYSIS BY APPLICATION
FIGURE 45. REST OF EUROPE INDUSTRIAL SUGAR MARKET ANALYSIS BY TYPE
FIGURE 46. REST OF EUROPE INDUSTRIAL SUGAR MARKET ANALYSIS BY SOURCE
FIGURE 47. REST OF EUROPE INDUSTRIAL SUGAR MARKET ANALYSIS BY END USE
FIGURE 48. REST OF EUROPE INDUSTRIAL SUGAR MARKET ANALYSIS BY REGIONAL
FIGURE 49. APAC INDUSTRIAL SUGAR MARKET ANALYSIS
FIGURE 50. CHINA INDUSTRIAL SUGAR MARKET ANALYSIS BY APPLICATION
FIGURE 51. CHINA INDUSTRIAL SUGAR MARKET ANALYSIS BY TYPE
FIGURE 52. CHINA INDUSTRIAL SUGAR MARKET ANALYSIS BY SOURCE
FIGURE 53. CHINA INDUSTRIAL SUGAR MARKET ANALYSIS BY END USE
FIGURE 54. CHINA INDUSTRIAL SUGAR MARKET ANALYSIS BY REGIONAL
FIGURE 55. INDIA INDUSTRIAL SUGAR MARKET ANALYSIS BY APPLICATION
FIGURE 56. INDIA INDUSTRIAL SUGAR MARKET ANALYSIS BY TYPE
FIGURE 57. INDIA INDUSTRIAL SUGAR MARKET ANALYSIS BY SOURCE
FIGURE 58. INDIA INDUSTRIAL SUGAR MARKET ANALYSIS BY END USE
FIGURE 59. INDIA INDUSTRIAL SUGAR MARKET ANALYSIS BY REGIONAL
FIGURE 60. JAPAN INDUSTRIAL SUGAR MARKET ANALYSIS BY APPLICATION
FIGURE 61. JAPAN INDUSTRIAL SUGAR MARKET ANALYSIS BY TYPE
FIGURE 62. JAPAN INDUSTRIAL SUGAR MARKET ANALYSIS BY SOURCE
FIGURE 63. JAPAN INDUSTRIAL SUGAR MARKET ANALYSIS BY END USE
FIGURE 64. JAPAN INDUSTRIAL SUGAR MARKET ANALYSIS BY REGIONAL
FIGURE 65. SOUTH KOREA INDUSTRIAL SUGAR MARKET ANALYSIS BY APPLICATION
FIGURE 66. SOUTH KOREA INDUSTRIAL SUGAR MARKET ANALYSIS BY TYPE
FIGURE 67. SOUTH KOREA INDUSTRIAL SUGAR MARKET ANALYSIS BY SOURCE
FIGURE 68. SOUTH KOREA INDUSTRIAL SUGAR MARKET ANALYSIS BY END USE
FIGURE 69. SOUTH KOREA INDUSTRIAL SUGAR MARKET ANALYSIS BY REGIONAL
FIGURE 70. MALAYSIA INDUSTRIAL SUGAR MARKET ANALYSIS BY APPLICATION
FIGURE 71. MALAYSIA INDUSTRIAL SUGAR MARKET ANALYSIS BY TYPE
FIGURE 72. MALAYSIA INDUSTRIAL SUGAR MARKET ANALYSIS BY SOURCE
FIGURE 73. MALAYSIA INDUSTRIAL SUGAR MARKET ANALYSIS BY END USE
FIGURE 74. MALAYSIA INDUSTRIAL SUGAR MARKET ANALYSIS BY REGIONAL
FIGURE 75. THAILAND INDUSTRIAL SUGAR MARKET ANALYSIS BY APPLICATION
FIGURE 76. THAILAND INDUSTRIAL SUGAR MARKET ANALYSIS BY TYPE
FIGURE 77. THAILAND INDUSTRIAL SUGAR MARKET ANALYSIS BY SOURCE
FIGURE 78. THAILAND INDUSTRIAL SUGAR MARKET ANALYSIS BY END USE
FIGURE 79. THAILAND INDUSTRIAL SUGAR MARKET ANALYSIS BY REGIONAL
FIGURE 80. INDONESIA INDUSTRIAL SUGAR MARKET ANALYSIS BY APPLICATION
FIGURE 81. INDONESIA INDUSTRIAL SUGAR MARKET ANALYSIS BY TYPE
FIGURE 82. INDONESIA INDUSTRIAL SUGAR MARKET ANALYSIS BY SOURCE
FIGURE 83. INDONESIA INDUSTRIAL SUGAR MARKET ANALYSIS BY END USE
FIGURE 84. INDONESIA INDUSTRIAL SUGAR MARKET ANALYSIS BY REGIONAL
FIGURE 85. REST OF APAC INDUSTRIAL SUGAR MARKET ANALYSIS BY APPLICATION
FIGURE 86. REST OF APAC INDUSTRIAL SUGAR MARKET ANALYSIS BY TYPE
FIGURE 87. REST OF APAC INDUSTRIAL SUGAR MARKET ANALYSIS BY SOURCE
FIGURE 88. REST OF APAC INDUSTRIAL SUGAR MARKET ANALYSIS BY END USE
FIGURE 89. REST OF APAC INDUSTRIAL SUGAR MARKET ANALYSIS BY REGIONAL
FIGURE 90. SOUTH AMERICA INDUSTRIAL SUGAR MARKET ANALYSIS
FIGURE 91. BRAZIL INDUSTRIAL SUGAR MARKET ANALYSIS BY APPLICATION
FIGURE 92. BRAZIL INDUSTRIAL SUGAR MARKET ANALYSIS BY TYPE
FIGURE 93. BRAZIL INDUSTRIAL SUGAR MARKET ANALYSIS BY SOURCE
FIGURE 94. BRAZIL INDUSTRIAL SUGAR MARKET ANALYSIS BY END USE
FIGURE 95. BRAZIL INDUSTRIAL SUGAR MARKET ANALYSIS BY REGIONAL
FIGURE 96. MEXICO INDUSTRIAL SUGAR MARKET ANALYSIS BY APPLICATION
FIGURE 97. MEXICO INDUSTRIAL SUGAR MARKET ANALYSIS BY TYPE
FIGURE 98. MEXICO INDUSTRIAL SUGAR MARKET ANALYSIS BY SOURCE
FIGURE 99. MEXICO INDUSTRIAL SUGAR MARKET ANALYSIS BY END USE
FIGURE 100. MEXICO INDUSTRIAL SUGAR MARKET ANALYSIS BY REGIONAL
FIGURE 101. ARGENTINA INDUSTRIAL SUGAR MARKET ANALYSIS BY APPLICATION
FIGURE 102. ARGENTINA INDUSTRIAL SUGAR MARKET ANALYSIS BY TYPE
FIGURE 103. ARGENTINA INDUSTRIAL SUGAR MARKET ANALYSIS BY SOURCE
FIGURE 104. ARGENTINA INDUSTRIAL SUGAR MARKET ANALYSIS BY END USE
FIGURE 105. ARGENTINA INDUSTRIAL SUGAR MARKET ANALYSIS BY REGIONAL
FIGURE 106. REST OF SOUTH AMERICA INDUSTRIAL SUGAR MARKET ANALYSIS BY APPLICATION
FIGURE 107. REST OF SOUTH AMERICA INDUSTRIAL SUGAR MARKET ANALYSIS BY TYPE
FIGURE 108. REST OF SOUTH AMERICA INDUSTRIAL SUGAR MARKET ANALYSIS BY SOURCE
FIGURE 109. REST OF SOUTH AMERICA INDUSTRIAL SUGAR MARKET ANALYSIS BY END USE
FIGURE 110. REST OF SOUTH AMERICA INDUSTRIAL SUGAR MARKET ANALYSIS BY REGIONAL
FIGURE 111. MEA INDUSTRIAL SUGAR MARKET ANALYSIS
FIGURE 112. GCC COUNTRIES INDUSTRIAL SUGAR MARKET ANALYSIS BY APPLICATION
FIGURE 113. GCC COUNTRIES INDUSTRIAL SUGAR MARKET ANALYSIS BY TYPE
FIGURE 114. GCC COUNTRIES INDUSTRIAL SUGAR MARKET ANALYSIS BY SOURCE
FIGURE 115. GCC COUNTRIES INDUSTRIAL SUGAR MARKET ANALYSIS BY END USE
FIGURE 116. GCC COUNTRIES INDUSTRIAL SUGAR MARKET ANALYSIS BY REGIONAL
FIGURE 117. SOUTH AFRICA INDUSTRIAL SUGAR MARKET ANALYSIS BY APPLICATION
FIGURE 118. SOUTH AFRICA INDUSTRIAL SUGAR MARKET ANALYSIS BY TYPE
FIGURE 119. SOUTH AFRICA INDUSTRIAL SUGAR MARKET ANALYSIS BY SOURCE
FIGURE 120. SOUTH AFRICA INDUSTRIAL SUGAR MARKET ANALYSIS BY END USE
FIGURE 121. SOUTH AFRICA INDUSTRIAL SUGAR MARKET ANALYSIS BY REGIONAL
FIGURE 122. REST OF MEA INDUSTRIAL SUGAR MARKET ANALYSIS BY APPLICATION
FIGURE 123. REST OF MEA INDUSTRIAL SUGAR MARKET ANALYSIS BY TYPE
FIGURE 124. REST OF MEA INDUSTRIAL SUGAR MARKET ANALYSIS BY SOURCE
FIGURE 125. REST OF MEA INDUSTRIAL SUGAR MARKET ANALYSIS BY END USE
FIGURE 126. REST OF MEA INDUSTRIAL SUGAR MARKET ANALYSIS BY REGIONAL
FIGURE 127. KEY BUYING CRITERIA OF INDUSTRIAL SUGAR MARKET
FIGURE 128. RESEARCH PROCESS OF MRFR
FIGURE 129. DRO ANALYSIS OF INDUSTRIAL SUGAR MARKET
FIGURE 130. DRIVERS IMPACT ANALYSIS: INDUSTRIAL SUGAR MARKET
FIGURE 131. RESTRAINTS IMPACT ANALYSIS: INDUSTRIAL SUGAR MARKET
FIGURE 132. SUPPLY / VALUE CHAIN: INDUSTRIAL SUGAR MARKET
FIGURE 133. INDUSTRIAL SUGAR MARKET, BY APPLICATION, 2024 (% SHARE)
FIGURE 134. INDUSTRIAL SUGAR MARKET, BY APPLICATION, 2019 TO 2032 (USD Billions)
FIGURE 135. INDUSTRIAL SUGAR MARKET, BY TYPE, 2024 (% SHARE)
FIGURE 136. INDUSTRIAL SUGAR MARKET, BY TYPE, 2019 TO 2032 (USD Billions)
FIGURE 137. INDUSTRIAL SUGAR MARKET, BY SOURCE, 2024 (% SHARE)
FIGURE 138. INDUSTRIAL SUGAR MARKET, BY SOURCE, 2019 TO 2032 (USD Billions)
FIGURE 139. INDUSTRIAL SUGAR MARKET, BY END USE, 2024 (% SHARE)
FIGURE 140. INDUSTRIAL SUGAR MARKET, BY END USE, 2019 TO 2032 (USD Billions)
FIGURE 141. INDUSTRIAL SUGAR MARKET, BY REGIONAL, 2024 (% SHARE)
FIGURE 142. INDUSTRIAL SUGAR MARKET, BY REGIONAL, 2019 TO 2032 (USD Billions)
FIGURE 143. BENCHMARKING OF MAJOR COMPETITORS