ID: MRFR/CnM/5739-HCR | February 2021 | Region: Global | 140 pages
Market Overview
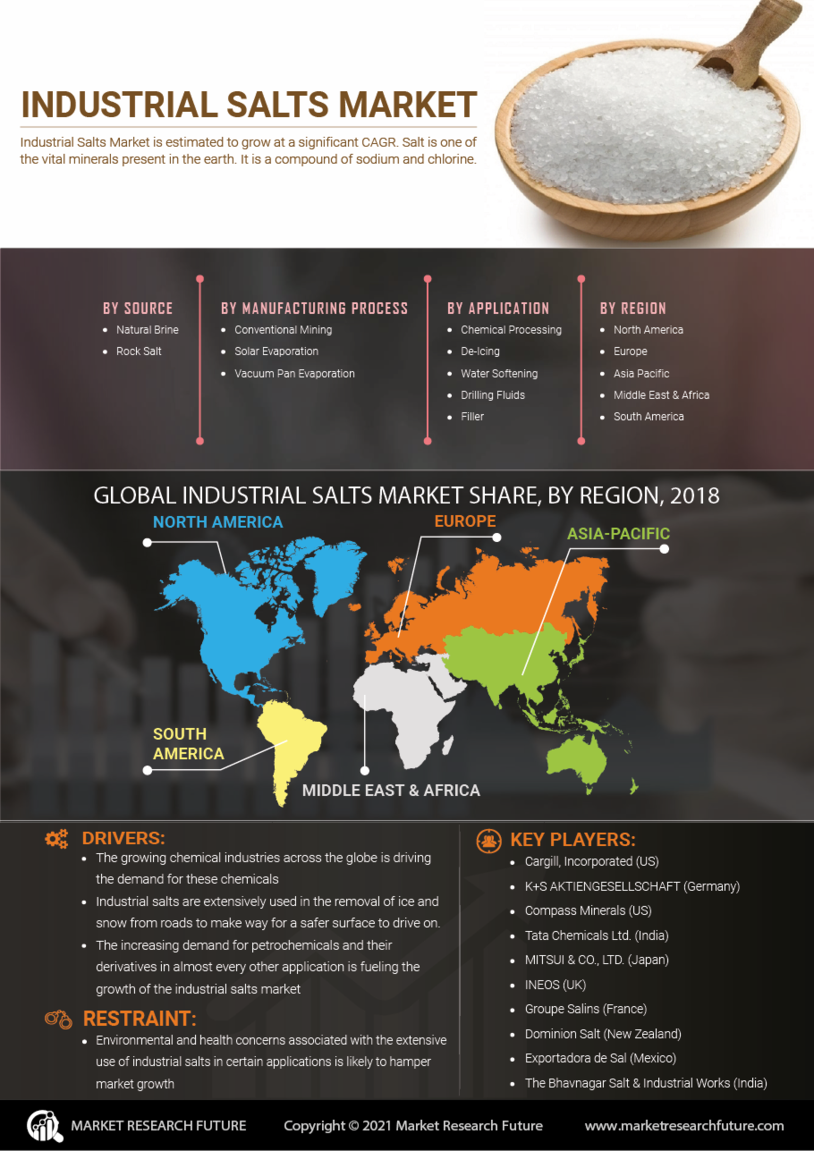
Salt is one of the vital minerals present in the earth. It is a compound of sodium and chlorine. Industrial salts are used in the chemical processing, de-icing, water treatment, oil & gas, agriculture, textile, soaps and detergents, and pharmaceuticals owing to abundant availability and cost-effectiveness.
The global industrial salts market is primarily driven by its use in chemical processing of various chemicals such as liquid sodium, metallic sodium, chlorine, caustic soda, sodium sulfate, sodium carbonate, hydrochloric acid, sodium bicarbonate, and sodium nitrate. The growing chemical industries across the globe is driving the demand for these chemicals, thereby, driving the growth of the industrial salts market. Industrial salts are extensively used in the removal of ice and snow from roads to make way for a safer surface to drive on. These salts are used for water softening, which is another major driver of the global market. Furthermore, such salts are used as dye-enhancer for textiles during the manufacturing, processing, and refining of fabrics and materials. This is because the use of industrial salt ensures full penetration of the color into the fabric along with good adherence. These are also used as a deacidification agent in the production of spun rayon as well as in leather tanning and dyeing. These salts also have applications as feed additive and pasture salt, which in turn, drives their demand in agriculture industry. Moreover, these salts find application as drilling fluids in oil & gas industry. The increasing demand for petrochemicals and their derivatives in almost every other application is fueling the growth of the industrial salts market. Furthermore, the use of industrial salts as filler in detergents and solvents for separation of chemicals is also propelling the demand for industrial salts. The rising demand for industrial salts in pharmaceuticals for saline solutions and production of capsules is a major factor positively influencing the market growth.
However, environmental and health concerns associated with the extensive use of industrial salts in certain applications is likely to hamper market growth during the forecast period.
Global Industrial Salts Market, by Application (%)
Source: MRFR Analysis
Regional Analysis
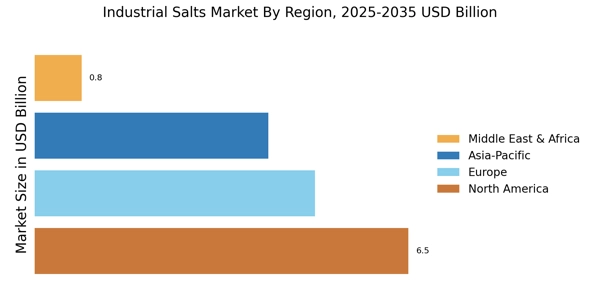
The global industrial salts market has been segmented into five regions, namely, Asia-Pacific, North America, Europe, Latin America, and the Middle East & Africa.
The market in Asia-Pacific dominated the global industrial salts market in 2017 due to the high demand for chemical processing, water softening, agricultural salts, animal feed, filler, and saline solutions. The high growth of the market in this region can also be attributed to the fast-paced industrialization and urbanization in the emerging countries such as India, Thailand, Malaysia, and Singapore.
European and the North American market is expected to witness a high growth of the market owing to the high demand from the de-icing applications as well as chemical processing in the region.
The presence of large number of natural deposits and high production capacities coupled with high exports is driving the global market
Segmentation
The global industrial salts market has been segmented on the basis of source, manufacturing process, application, and region.
On the basis of source, the market has been bifurcated into natural brine and rock salt.
Based on the manufacturing process, the market has been segmented into conventional mining, solar evaporation, and vacuum pan evaporation.
By application, the market has been segmented into chemical processing, de-icing, water softening, drilling fluids, dye enhancer, filler, saline solutions, and others.
Key Players
Some of the manufacturers operating in the global industrial salts market are Cargill, Incorporated (US), K+S AKTIENGESELLSCHAFT (Germany), Compass Minerals (US), Tata Chemicals Ltd. (India), MITSUI & CO., LTD. (Japan), INEOS (UK), Groupe Salins (France), Dominion Salt (New Zealand), Exportadora de Sal (Mexico), and The Bhavnagar Salt & Industrial Works (India).
Intended Audience
Industrial salts manufacturers
Traders and distributors of Industrial salts
Research and development institutes
Potential investors
Raw material suppliers
Nationalized laboratories
Frequently Asked Questions (FAQ) :
The outlook of the global industrial salts market looks very promising.
Industrial salt is a natural mineral that is extensively used in applications including chemical processing, water softening, de-icing, drilling fluids, and fillers.
The vacuum pan evaporation segment by manufacturing process and the chemical processing segment by applications, hold major shares in the global Industrial salts market.
Asia Pacific holds the largest share in the global Industrial salts market, followed by North America and Europe, respectively.
K+S AKTIENGESELLSCHAFT (Germany), Cargill, Incorporated (US), Compass Minerals (US), MITSUI & CO., LTD. (Japan), Tata Chemicals Ltd. (India), INEOS (UK), Dominion Salt (New Zealand), Groupe Salins (France), The Bhavnagar Salt & Industrial Works (India), and Exportadora de Sal (Mexico), are some of the major players operating in the Industrial salts market.
TABLE OF CONTENTS
1 Executive Summary
2 Scope of the Report
2.1 Market Definition
2.2 Scope of the Study
2.2.1 Research Objectives
2.2.2 Assumptions & Limitations
2.3 Market Structure
3 Market Research Methodology
3.1 Research Process
3.2 Secondary Research
3.3 Primary Research
3.4 Forecast Model
4 Market Landscape
4.1 Supply Chain Analysis
4.1.1 Raw Material Suppliers
4.1.2 Manufacturers/Producers
4.1.3 Distributors/Retailers/Wholesalers/E-Commerce
4.1.4 End-Users
4.2 Porter’s Five Forces Analysis
4.2.1 Threat of New Entrants
4.2.2 Bargaining Power of Buyers
4.2.3 Bargaining Power of Suppliers
4.2.4 Threat of Substitutes
4.2.5 Intensity of Competitive Rivalry
5 Market Dynamics of Global Industrial Salts Market
5.1 Introduction
5.2 Drivers
5.3 Restraints
5.4 Opportunities
5.5 Challenges
5.6 Trends/Strategies
6. Global Industrial Salts Market, by Source
6.1 Introduction
6.2 Natural Brine
6.2.1 Market Estimates & Forecast, 2018–2023
6.2.2 Market Estimates & Forecast, by Region, 2018–2023
6.3 Rock Salt
6.3.1 Market Estimates & Forecast, 2018–2023
6.3.2 Market Estimates & Forecast, by Region, 2018–2023
7. Global Industrial Salts Market, by Manufacturing Process
7.1 Introduction
7.2 Conventional Mining
7.2.1 Market Estimates & Forecast, 2018–2023
7.2.2 Market Estimates & Forecast, by Region, 2018–2023
7.3 Solar Evaporation
7.3.1 Market Estimates & Forecast, 2018–2023
7.3.2 Market Estimates & Forecast, by Region, 2018–2023
7.4 Vacuum Pan Evaporation
7.4.1 Market Estimates & Forecast, 2018–2023
7.4.2 Market Estimates & Forecast, by Region, 2018–2023
8. Global Industrial Salts Market, by Application
8.1 Introduction
8.2 Chemical Processing
8.2.1 Market Estimates & Forecast, 2018–2023
8.2.2 Market Estimates & Forecast, by Region, 2018–2023
8.3 De-icing
8.3.1 Market Estimates & Forecast, 2018–2023
8.3.2 Market Estimates & Forecast, by Region, 2018–2023
8.4 Water Softening
8.4.1 Market Estimates & Forecast, 2018–2023
8.4.2 Market Estimates & Forecast, by Region, 2018–2023
8.5 Drilling Fluids
8.5.1 Market Estimates & Forecast, 2018–2023
8.5.2 Market Estimates & Forecast, by Region, 2018–2023
8.6 Dye Enhancer
8.6.1 Market Estimates & Forecast, 2018–2023
8.6.2 Market Estimates & Forecast, by Region, 2018–2023
8.7 Filler
8.7.1 Market Estimates & Forecast, 2018–2023
8.7.2 Market Estimates & Forecast, by Region, 2018–2023
8.8 Saline Solution
8.8.1 Market Estimates & Forecast, 2018–2023
8.8.2 Market Estimates & Forecast, by Region, 2018–2023
8.9 Others
8.9.1 Market Estimates & Forecast, 2018–2023
8.9.2 Market Estimates & Forecast, by Region, 2018–2023
9. Global Industrial Salts Market, by Region
9.1 Introduction
9.2 North America
9.2.1 Market Estimates & Forecast, 2018–2023
9.2.2 Market Estimates & Forecast, by Source, 2018–2023
9.2.3 Market Estimates & Forecast, by Manufacturing Process, 2018–2023
9.2.4 Market Estimates & Forecast, by Application, 2018–2023
9.2.5 US
9.2.5.1 Market Estimates & Forecast, 2018–2023
9.2.5.2 Market Estimates & Forecast, by Source, 2018–2023
9.2.5.3 Market Estimates & Forecast, by Manufacturing Process, 2018–2023
9.2.5.4 Market Estimates & Forecast, by Application, 2018–2023
9.2.6 Canada
9.2.6.1 Market Estimates & Forecast, 2018–2023
9.2.6.2 Market Estimates & Forecast, by Source, 2018–2023
9.2.6.3 Market Estimates & Forecast, by Manufacturing Process, 2018–2023
9.2.6.4 Market Estimates & Forecast, by Application, 2018–2023
9.3 Europe
9.3.1 Market Estimates & Forecast, 2018–2023
9.3.2 Market Estimates & Forecast, by Source, 2018–2023
9.3.3 Market Estimates & Forecast, by Manufacturing Process, 2018–2023
9.3.4 Market Estimates & Forecast, by Application, 2018–2023
9.3.5 Germany
9.3.5.1 Market Estimates & Forecast, 2018–2023
9.3.5.2 Market Estimates & Forecast, by Source, 2018–2023
9.3.5.3 Market Estimates & Forecast, by Manufacturing Process, 2018–2023
9.3.5.4 Market Estimates & Forecast, by Application, 2018–2023
9.3.6. France
9.3.6.1 Market Estimates & Forecast, 2018–2023
9.3.6.2 Market Estimates & Forecast, by Source, 2018–2023
9.3.6.3 Market Estimates & Forecast, by Manufacturing Process, 2018–2023
9.3.6.4 Market Estimates & Forecast, by Application, 2018–2023
9.3.7 Italy
9.3.7.1 Market Estimates & Forecast, 2018–2023
9.3.7.2 Market Estimates & Forecast, by Source, 2018–2023
9.3.7.3 Market Estimates & Forecast, by Manufacturing Process, 2018–2023
9.3.7.4 Market Estimates & Forecast, by Application, 2018–2023
9.3.8 Spain
9.3.8.1 Market Estimates & Forecast, 2018–2023
9.3.8.2 Market Estimates & Forecast, by Source, 2018–2023
9.3.8.3 Market Estimates & Forecast, by Manufacturing Process, 2018–2023
9.3.8.4 Market Estimates & Forecast, by Application, 2018–2023
9.3.9 UK
9.3.9.1 Market Estimates & Forecast, 2018–2023
9.3.9.2 Market Estimates & Forecast, by Source, 2018–2023
9.3.9.3 Market Estimates & Forecast, by Manufacturing Process, 2018–2023
9.3.9.4 Market Estimates & Forecast, by Application, 2018–2023
9.3.10 Russia
9.3.10.1 Market Estimates & Forecast, 2018–2023
9.3.10.2 Market Estimates & Forecast, by Source, 2018–2023
9.3.10.3 Market Estimates & Forecast, by Manufacturing Process, 2018–2023
9.3.10.4 Market Estimates & Forecast, by Application, 2018–2023
9.3.11 Poland
9.3.11.1 Market Estimates & Forecast, 2018–2023
9.3.11.2 Market Estimates & Forecast, by Source, 2018–2023
9.3.11.3 Market Estimates & Forecast, by Manufacturing Process, 2018–2023
9.3.11.4 Market Estimates & Forecast, by Application, 2018–2023
9.3.12 Rest of Europe
9.3.12.1 Market Estimates & Forecast, 2018–2023
9.3.12.2 Market Estimates & Forecast, by Source, 2018–2023
9.3.12.3 Market Estimates & Forecast, by Manufacturing Process, 2018–2023
9.3.12.4 Market Estimates & Forecast, by Application, 2018–2023
9.4 Asia-Pacific
9.4.1 Market Estimates & Forecast, 2018–2023
9.4.2 Market Estimates & Forecast, by Source, 2018–2023
9.4.3 Market Estimates & Forecast, by Manufacturing Process, 2018–2023
9.4.4 Market Estimates & Forecast, by Application, 2018–2023
9.4.5 China
9.4.5.1 Market Estimates & Forecast, 2018–2023
9.4.5.2 Market Estimates & Forecast, by Source, 2018–2023
9.4.5.3 Market Estimates & Forecast, by Manufacturing Process, 2018–2023
9.4.5.3 Market Estimates & Forecast, by Application, 2018–2023
9.4.6 India
9.4.6.1 Market Estimates & Forecast, 2018–2023
9.4.6.2 Market Estimates & Forecast, by Source, 2018–2023
9.4.6.3 Market Estimates & Forecast, by Manufacturing Process, 2018–2023
9.4.6.4 Market Estimates & Forecast, by Application, 2018–2023
9.4.7 Japan
9.4.7.1 Market Estimates & Forecast, 2018–2023
9.4.7.2 Market Estimates & Forecast, by Source, 2018–2023
9.4.7.3 Market Estimates & Forecast, by Manufacturing Process, 2018–2023
9.4.7.4 Market Estimates & Forecast, by Application, 2018–2023
9.4.8 Australia & New Zealand
9.4.8.1 Market Estimates & Forecast, 2018–2023
9.4.8.2 Market Estimates & Forecast, by Source, 2018–2023
9.4.8.3 Market Estimates & Forecast, by Manufacturing Process, 2018–2023
9.4.8.4 Market Estimates & Forecast, by Application, 2018–2023
9.4.9 Indonesia & South Korea
9.4.9.1 Market Estimates & Forecast, 2018–2023
9.4.9.2 Market Estimates & Forecast, by Source, 2018–2023
9.4.9.3 Market Estimates & Forecast, by Manufacturing Process, 2018–2023
9.4.9.4 Market Estimates & Forecast, by Application, 2018–2023
9.4.10 Rest of Asia-Pacific
9.4.10.1 Market Estimates & Forecast, 2018–2023
9.4.10.2 Market Estimates & Forecast, by Source, 2018–2023
9.4.10.3 Market Estimates & Forecast, by Manufacturing Process, 2018–2023
9.4.10.4 Market Estimates & Forecast, by Application, 2018–2023
9.5 Middle East & Africa
9.5.1 Market Estimates & Forecast, 2018–2023
9.5.2 Market Estimates & Forecast, by Source, 2018–2023
9.5.3 Market Estimates & Forecast, by Manufacturing Process, 2018–2023
9.5.4 Market Estimates & Forecast, by Application, 2018–2023
9.5.5 GCC
9.5.5.1 Market Estimates & Forecast, 2018–2023
9.5.5.2 Market Estimates & Forecast, by Source, 2018–2023
9.5.5.3 Market Estimates & Forecast, by Manufacturing Process, 2018–2023
9.5.5.4 Market Estimates & Forecast, by Application, 2018–2023
9.5.6 Israel
9.5.6.1 Market Estimates & Forecast, 2018–2023
9.5.6.2 Market Estimates & Forecast, by Source, 2018–2023
9.5.6.3 Market Estimates & Forecast, by Manufacturing Process, 2018–2023
9.5.6.4 Market Estimates & Forecast, by Application, 2018–2023
9.5.7 North Africa
9.5.7.1 Market Estimates & Forecast, 2018–2023
9.5.7.2 Market Estimates & Forecast, by Source, 2018–2023
9.5.7.3 Market Estimates & Forecast, by Manufacturing Process, 2018–2023
9.5.7.4 Market Estimates & Forecast, by Application, 2018–2023
9.5.8 Turkey
9.5.8.1 Market Estimates & Forecast, 2018–2023
9.5.8.2 Market Estimates & Forecast, by Source, 2018–2023
9.5.8.3 Market Estimates & Forecast, by Manufacturing Process, 2018–2023
9.5.8.4 Market Estimates & Forecast, by Application, 2018–2023
9.5.9 Rest of the Middle East & Africa
9.5.9.1 Market Estimates & Forecast, 2018–2023
9.5.9.2 Market Estimates & Forecast, by Source, 2018–2023
9.5.9.3 Market Estimates & Forecast, by Manufacturing Process, 2018–2023
9.5.9.4 Market Estimates & Forecast, by Application, 2018–2023
9.6 Latin America
9.6.1 Market Estimates & Forecast, 2018–2023
9.6.2 Market Estimates & Forecast, by Source, 2018–2023
9.6.3 Market Estimates & Forecast, by Manufacturing Process, 2018–2023
9.6.4 Market Estimates & Forecast, by Application, 2018–2023
9.6.5 Brazil
9.6.5.1 Market Estimates & Forecast, 2018–2023
9.6.5.2 Market Estimates & Forecast, by Source, 2018–2023
9.6.5.3 Market Estimates & Forecast, by Manufacturing Process, 2018–2023
9.6.5.4 Market Estimates & Forecast, by Application, 2018–2023
9.6.6 Mexico
9.6.6.1 Market Estimates & Forecast, 2018–2023
9.6.6.2 Market Estimates & Forecast, by Source, 2018–2023
9.6.6.3 Market Estimates & Forecast, by Manufacturing Process, 2018–2023
9.6.6.4 Market Estimates & Forecast, by Application, 2018–2023
9.6.7 Argentina
9.6.7.1 Market Estimates & Forecast, 2018–2023
9.6.7.2 Market Estimates & Forecast, by Source, 2018–2023
9.6.7.3 Market Estimates & Forecast, by Manufacturing Process, 2018–2023
9.6.7.4 Market Estimates & Forecast, by Application, 2018–2023
9.6.8 Rest of Latin America
9.6.8.1 Market Estimates & Forecast, 2018–2023
9.6.8.2 Market Estimates & Forecast, by Source, 2018–2023
9.6.8.3 Market Estimates & Forecast, by Manufacturing Process, 2018–2023
9.6.8.4 Market Estimates & Forecast, by Application, 2018–2023
10. Company Landscape
10.1 Introduction
10.2 Market Strategy
10.3 Key Development Analysis
(Expansions/Mergers & Acquisitions/Joint Ventures/New Manufacturing Process Developments/Agreements/Investments)
11. Company Profiles
11.1 Cargill, Incorporated
11.1.1 Company Overview
11.1.2 Financial Updates
11.1.3 Manufacturing Process/Business Segment Overview
11.1.4 Strategy
11.1.5 Key Developments
11.1.6 SWOT Analysis
11.2 K+S AKTIENGESELLSCHAFT
11.2.1 Company Overview
11.2.2 Financial Updates
11.2.3 Manufacturing Process/Business Segment Overview
11.2.4 Strategy
11.2.5 Key Developments
11.2.6 SWOT Analysis
11.3 Compass Minerals
11.3.1 Company Overview
11.3.2 Financial Updates
11.3.3 Manufacturing Process/Business Segment Overview
11.3.4 Strategy
11.3.5 Key Developments
11.3.6 SWOT Analysis
11.4 Tata Chemicals Ltd.
11.4.1 Company Overview
11.4.2 Financial Updates
11.4.3 Manufacturing Process/Business Segment Overview
11.4.4 Strategy
11.4.5 Key Developments
11.4.6 SWOT Analysis
11.5 MITSUI & CO., LTD.
11.5.1 Company Overview
11.5.2 Financial Updates
11.5.3 Manufacturing Process/Business Segment Overview
11.5.4 Strategy
11.5.5 Key Developments
11.5.6 SWOT Analysis
11.6 INEOS
11.6.1 Company Overview
11.6.2 Financial Updates
11.6.3 Manufacturing Process/Business Segment Overview
11.6.4 Strategy
11.6.5 Key Developments
11.6.6 SWOT Analysis
11.7 Groupe Salins
11.7.1 Company Overview
11.7.2 Financial Updates
11.7.3 Manufacturing Process/Business Segment Overview
11.7.4 Strategy
11.7.5 Key Developments
11.7.6 SWOT Analysis
11.8 Dominion Salt
11.8.1 Company Overview
11.8.2 Financial Updates
11.8.3 Manufacturing Process/Business Segment Overview
11.8.4 Strategy
11.8.5 Key Developments
11.8.6 SWOT Analysis
11.9 Exportadora de Sal
11.9.1 Company Overview
11.9.2 Financial Updates
11.9.3 Manufacturing Process/Business Segment Overview
11.9.4 Strategy
11.9.5 Key Developments
11.9.6 SWOT Analysis
11.10 The Bhavnagar Salt & Industrial Works
11.10.1 Company Overview
11.10.2 Financial Updates
11.10.3 Manufacturing Process/Business Segment Overview
11.10.4 Strategy
11.10.5 Key Developments
11.10.6 SWOT Analysis
12. Conclusion
LIST OF TABLES
Table 1 Global Industrial Salts Market, by Region, 2016–2023
Table 2 North America: Industrial Salts Market, by Country, 2016–2023
Table 3 Europe: Industrial Salts Market, by Country, 2016–2023
Table 4 Asia-Pacific: Industrial Salts Market, by Country, 2016–2023
Table 5 Middle East & Africa: Industrial Salts Market, by Country, 2016–2023
Table 6 Latin America: Industrial Salts Market, by Country, 2016–2023
Table 7 Global Industrial Salts Source Market, by Region, 2016–2023
Table 8 North America: Industrial Salts Source Market, by Country, 2016–2023
Table 9 Europe: Industrial Salts Source Market, by Country, 2016–2023
Table10 Asia-Pacific: Industrial Salts Source Market, by Country, 2016–2023
Table11 Middle East & Africa: Industrial Salts Source Market, by Country, 2016–2023
Table12 Latin America: Industrial Salts Source Market, by Country, 2016–2023
Table13 Global Industrial Salts Manufacturing Process Market, by Region, 2016–2023
Table14 North America: Industrial Salts Manufacturing Process Market, by Country, 2016–2023
Table15 Europe: Industrial Salts Manufacturing Process Market, by Country, 2016–2023
Table16 Asia-Pacific: Industrial Salts Manufacturing Process Market, by Country, 2016–2023
Table17 Middle East & Africa: Industrial Salts Manufacturing Process Market, by Country, 2016–2023
Table18 Latin America: Industrial Salts Manufacturing Process Market, by Country, 2016–2023
Table19 Global Industrial Salts Application Market, by Region, 2016–2023
Table20 North America: Industrial Salts Application Market, by Country, 2016–2023
Table21 Europe: Industrial Salts Application Market, by Country, 2016–2023
Table22 Asia-Pacific: Industrial Salts Application Market, by Country, 2016–2023
Table23 Middle East & Africa: Industrial Salts Application Market, by Country, 2016–2023
Table24 Latin America: Industrial Salts Application Market, by Country, 2016–2023
Table25 Global Source Market, by Region, 2016–2023
Table26 Global Manufacturing Process Market, by Region, 2016–2023
Table27 Global Application Market, by Region, 2016–2023
Table28 North America: Industrial Salts Market, by Country
Table29 North America: Industrial Salts Market, by Source
Table30 North America: Industrial Salts Market, by Manufacturing Process
Table31 North America: Industrial Salts Market, by Application
Table32 Europe: Industrial Salts Market, by Country
Table33 Europe: Industrial Salts Market, by Source
Table34 Europe: Industrial Salts Market, by Manufacturing Process
Table35 Europe: Industrial Salts Market, by Application
Table36 Asia-Pacific: Industrial Salts Market, by Country
Table37 Asia-Pacific: Industrial Salts Market, by Source
Table38 Asia-Pacific: Industrial Salts Market, by Manufacturing Process
Table39 Asia-Pacific: Industrial Salts Market, by Application
Table40 Middle East & Africa: Industrial Salts Market, by Country
Table41 Middle East & Africa Industrial Salts Market, by Source
Table42 Middle East & Africa Industrial Salts Market, by Manufacturing Process
Table43 Middle East & Africa: Industrial Salts Market, by Application
Table44 Latin America: Industrial Salts Market, by Country
Table45 Latin America Industrial Salts Market, by Source
Table46 Latin America Industrial Salts Market, by Manufacturing Process
Table47 Latin America: Industrial Salts Market, by Application
LIST OF FIGURES
FIGURE 1 Global Industrial Salts Market Segmentation
FIGURE 2 Forecast Research Methodology
FIGURE 3 Porter’s Five Forces Analysis of Global Industrial Salts Market
FIGURE 4 Value Chain of Global Industrial Salts Market
FIGURE 5 Share of Global Industrial Salts Market in 2017, by Country (%)
FIGURE 6 Global Industrial Salts Market, 2016–2023,
FIGURE 7 Global Industrial Salts Market Size by Sources, 2017
FIGURE 8 Share of Global Industrial Salts Market, by Source, 2016–2023
FIGURE 9 Global Industrial Salts Market Size, by Manufacturing Process, 2017
FIGURE 10 Share of Global Industrial Salts Market, by Manufacturing Process, 2016–2023
FIGURE 11 Global Industrial Salts Market Size, by Application, 2017
FIGURE 12 Share of Global Industrial Salts Market, by Application, 2016–2023