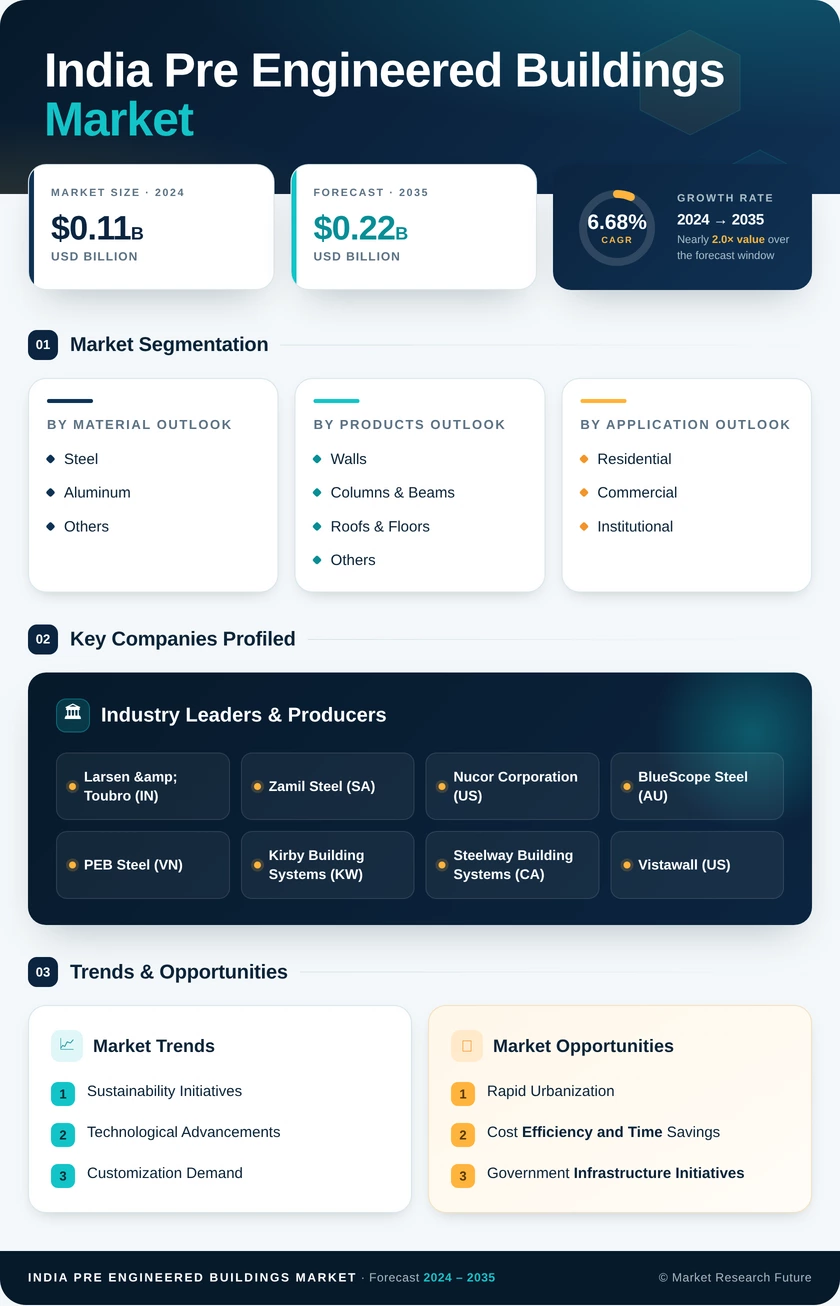
India Pre Engineered Buildings Market (2025 - 2035)

ID: MRFR/PCM/1925-CR 87 Pages Varsha More Last Updated: September 18, 2026
India Pre Engineered Buildings Market Research Report Information By Material Type (Concrete, Metal, Glass, Timber, and Other Materials), By Application (Residential, Commercial, and Others), By Product Type (Modular Buildings, Panelized & Componentized Systems, and Other Prefab Types), and By City Cluster (Delhi-NCR, Mumbai, Bangalore, Chennai, Hyderabad, Pune, Ahmedabad, and Rest of India) – Forecast Till 2035
India Pre Engineered Buildings Market
Market Size
Forecast Period2025-2035
CAGR (2025-2035)9.4%
2025 Market SizeUSD 13.95 billion
2030 Market SizeUSD 21.86 billion
2035 Market SizeUSD 34.25 billion
Key Players
Tata BlueScope Steel
Kirby Building Systems India
Interarch Building Products
EPACK Prefab Technologies
Pennar Industries
Everest Industries
Opportunities
  • Tier-2 and Tier-3 City Penetration
  • Digital Delivery and Data-Backed Service Models
  • Mission-Critical and Advanced Manufacturing Shells
  1. 1 Market Overview | |
    1. 1.1 Study Assumptions & Market Definition | |
    2. 1.2 Scope of the Study | |
    3. 1.3 Research Methodology | |
  2. 2 Market Summary & Key Report Takeaways | |
    1. 2.1 By Material Type | |
    2. 2.2 By Application and Product Type | |
    3. 2.3 By Geography | |
  3. 3 Market Size & Forecast (2021–2035) | |
    1. 3.1 Historical Market Size (2021–2025) | |
    2. 3.2 Current & Forecast Market Size (2026–2035) | |
    3. 3.3 Market Size by Revenue (USD billion) | |
    4. 3.4 Year-over-Year Growth Analysis | |
  4. 4 Market Dynamics — Driver Impact Analysis | |
    1. 4.1 Affordable Housing Subsidy Disbursement | |
    2. 4.2 Logistics and Warehousing Corridor Buildout | |
    3. 4.3 Data-Centre and Hyperscale Capacity | |
    4. 4.4 Energy Conservation Building Code Enforcement | |
    5. 4.5 Domestic Coated-Steel Capacity and PLI Support | |
    6. 4.6 Skilled Site Labour Scarcity | |
    7. 4.7 Green Certification and Embodied-Carbon Reporting | |
  5. 5 Market Dynamics — Restraints Impact Analysis | |
    1. 5.1 Oversize Transport and Route Permitting | |
    2. 5.2 Certified Fabrication Skills Gap | |
    3. 5.3 Lender Appraisal and Financing Norms | |
    4. 5.4 Steel and Cement Input Price Volatility | |
    5. 5.5 Municipal Code and Approval Fragmentation | |
  6. 6 Market Opportunity Analysis | |
    1. 6.1 Tier-2 and Tier-3 City Penetration | |
    2. 6.2 Digital Delivery and Data-Backed Service Models | |
    3. 6.3 Mission-Critical and Advanced Manufacturing Shells | |
    4. 6.4 Export Corridors to the Gulf and East Africa | |
    5. 6.5 Low-Carbon Product Certification | |
    6. 6.6 Industry Value Chain Analysis | |
    7. 6.7 Porter's Five Forces Analysis | |
  7. 7 Regional Market Share & Country-Level Analysis | |
    1. 7.1 North India | | |
      1. 7.1.1 Delhi-NCR | | |
      2. 7.1.2 Haryana | | |
      3. 7.1.3 Uttar Pradesh | | |
      4. 7.1.4 Punjab | | |
      5. 7.1.5 Rajasthan | | |
      6. 7.1.6 Uttarakhand | |
    2. 7.2 West India | | |
      1. 7.2.1 Maharashtra | | |
      2. 7.2.2 Gujarat | | |
      3. 7.2.3 Goa | | |
      4. 7.2.4 Rest of West India | |
    3. 7.3 South India | | |
      1. 7.3.1 Karnataka | | |
      2. 7.3.2 Tamil Nadu | | |
      3. 7.3.3 Telangana | | |
      4. 7.3.4 Andhra Pradesh | | |
      5. 7.3.5 Kerala | |
    4. 7.4 East & Northeast India | | |
      1. 7.4.1 West Bengal | | |
      2. 7.4.2 Odisha | | |
      3. 7.4.3 Jharkhand | | |
      4. 7.4.4 Assam | | |
      5. 7.4.5 Rest of East & Northeast India | |
    5. 7.5 Central India | | |
      1. 7.5.1 Madhya Pradesh | | |
      2. 7.5.2 Chhattisgarh | | |
      3. 7.5.3 Rest of Central India | |
  8. 8 Future Outlook (2026–2035) | |
    1. 8.1 Automation and Model-Driven Manufacturing | |
    2. 8.2 Platform Economics and Product Standardisation | |
    3. 8.3 Decarbonisation and Embodied Carbon Accounting | |
    4. 8.4 Consolidation and Capital Market Access | |
  9. 9 Segmentation Analysis | |
    1. 9.1 By Material Type | | |
      1. 9.1.1 Concrete | | |
      2. 9.1.2 Glass | | |
      3. 9.1.3 Metal | | |
      4. 9.1.4 Timber | | |
      5. 9.1.5 Other Materials | |
    2. 9.2 By Application | | |
      1. 9.2.1 Residential | | |
      2. 9.2.2 Commercial | | |
      3. 9.2.3 Others | |
    3. 9.3 By Product Type | | |
      1. 9.3.1 Modular Buildings | | |
      2. 9.3.2 Panelized & Componentized Systems | | |
      3. 9.3.3 Other Prefab Types | |
    4. 9.4 By City Cluster | | |
      1. 9.4.1 Delhi-NCR | | |
      2. 9.4.2 Bangalore | | |
      3. 9.4.3 Mumbai | | |
      4. 9.4.4 Chennai | | |
      5. 9.4.5 Hyderabad | | |
      6. 9.4.6 Pune | | |
      7. 9.4.7 Ahmedabad | | |
      8. 9.4.8 Rest of India | |
  10. 10 Competitive Landscape | |
    1. 10.1 Market Concentration Analysis (2026) | |
    2. 10.2 Competitive Benchmarking Matrix | |
    3. 10.3 Company Profiles | | |
      1. 10.3.1 Tata BlueScope Steel | | |
      2. 10.3.2 Kirby Building Systems India | | |
      3. 10.3.3 Interarch Building Products | | |
      4. 10.3.4 EPACK Prefab Technologies | | |
      5. 10.3.5 Pennar Industries (PEBS Pennar) | | |
      6. 10.3.6 Everest Industries | | |
      7. 10.3.7 Jindal Buildsys | | |
      8. 10.3.8 Smith Structures India | | |
      9. 10.3.9 Lloyd Insulations (India) | | |
      10. 10.3.10 Multicolor Steels (India) | |
  11. 11 Recent News & Developments | |
  12. 12 Report Scope & Methodology | |
    1. 12.1 Study Period & Base Year | |
    2. 12.2 Data Sources & Citations | |
    3. 12.3 Abbreviations | |
  13. 13 Detailed Sources & Citations | |
  14. 14 Frequently Asked Questions (FAQs) | | LIST OF TABLES | |
  15. TABLE 1 India Pre-engineered Buildings Market Size & Forecast, by Revenue (USD billion), 2021–2035 | |
  16. TABLE 2 India Pre-engineered Buildings Market – Year-over-Year Growth Analysis, 2021–2035 | |
  17. TABLE 3 Driver Impact Analysis Matrix, 2026–2035 | |
  18. TABLE 4 Restraint Impact Analysis Matrix, 2026–2035 | |
  19. TABLE 5 India Pre-engineered Buildings Market Size, by Region, 2021–2035 (USD billion) | |
  20. TABLE 6 North India Market Size, by State/Cluster, 2021–2035 (USD billion) | |
  21. TABLE 7 West India Market Size, by State/Cluster, 2021–2035 (USD billion) | |
  22. TABLE 8 South India Market Size, by State/Cluster, 2021–2035 (USD billion) | |
  23. TABLE 9 East & Northeast India Market Size, by State/Cluster, 2021–2035 (USD billion) | |
  24. TABLE 10 Central India Market Size, by State/Cluster, 2021–2035 (USD billion) | |
  25. TABLE 11 India Pre-engineered Buildings Market Size, by Material Type, 2021–2035 (USD billion) | |
  26. TABLE 12 India Pre-engineered Buildings Market Size, by Application, 2021–2035 (USD billion) | |
  27. TABLE 13 India Pre-engineered Buildings Market Size, by Product Type, 2021–2035 (USD billion) | |
  28. TABLE 14 India Pre-engineered Buildings Market Size, by City Cluster, 2021–2035 (USD billion) | |
  29. TABLE 15 North India Market Size, by Material Type, 2021–2035 (USD billion) | |
  30. TABLE 16 West India Market Size, by Application, 2021–2035 (USD billion) | |
  31. TABLE 17 South India Market Size, by Product Type, 2021–2035 (USD billion) | |
  32. TABLE 18 East & Northeast India Market Size, by Application, 2021–2035 (USD billion) | |
  33. TABLE 19 Central India Market Size, by Material Type, 2021–2035 (USD billion) | |
  34. TABLE 20 Competitive Benchmarking Matrix – India Pre-engineered Buildings Market, 2026 | |
  35. TABLE 21 Company Profiles – Key Players, India Pre-engineered Buildings Market | |
  36. TABLE 22 Recent Developments & Strategic Announcements, 2023–2025 | |
  37. TABLE 23 Report Scope & Methodology Summary | |
  38. TABLE 24 Detailed Sources & Citations Index | | LIST OF FIGURES | |
  39. FIGURE 1 India Pre-engineered Buildings Market — Market Dynamics Overview (Drivers, Restraints, Opportunities) | |
  40. FIGURE 2 Industry Value Chain Analysis | |
  41. FIGURE 3 Porter's Five Forces Analysis | |
  42. FIGURE 4 Market Size Trend & Forecast, 2021–2035 (USD billion) | |
  43. FIGURE 5 Year-over-Year Growth Rate Trend, 2022–2035 (%) | |
  44. FIGURE 6 Market Share by Material Type, 2025 vs 2035 (%) | |
  45. FIGURE 7 Market Share by Application, 2025 vs 2035 (%) | |
  46. FIGURE 8 Market Share by Product Type, 2025 vs 2035 (%) | |
  47. FIGURE 9 Market Share by City Cluster, 2025 (%) | |
  48. FIGURE 10 Regional Market Share Distribution, 2025 (%) | |
  49. FIGURE 11 Regional CAGR Comparison, 2026–2035 (%) | |
  50. FIGURE 12 Competitive Landscape — Estimated Revenue Share Ranges, 2026 | |
  51. FIGURE 13 Market Concentration and Top-5 Share Trend, 2025–2035 | |
  52. FIGURE 14 Driver Impact Weighting Chart, 2026–2035 | |
  53. FIGURE 15 Restraint Severity Heat Map by Region

Segmentation Quick Reference

DimensionSub-SegmentsDominant SegmentFastest Growing Segment
By Material TypeConcrete, Glass, Metal, Timber, Other MaterialsConcreteTimber
By ApplicationResidential, Commercial, OthersResidentialCommercial
By Product TypeModular Buildings, Panelized & Componentized Systems, Other Prefab TypesModular BuildingsPanelized & Componentized Systems
By City ClusterDelhi-NCR, Bangalore, Mumbai, Chennai, Hyderabad, Pune, Ahmedabad, Rest of IndiaRest of IndiaBangalore
By RegionNorth India, West India, South India, East & Northeast India, Central IndiaSouth IndiaEast & Northeast India


Market Segmentation Overview

By Material Type

Sub-SegmentKey Trend
ConcretePrecast panel moulds standardised around repeat housing typologies, lowering unit cost per sanctioned block.
GlassFacade and daylighting specifications tightening under envelope performance codes
MetalCoated coil availability from domestic mills compressing delivery lead times
TimberEngineered timber entering hospitality and campus projects on embodied-carbon grounds.
Other MaterialsInsulated composite and fibre-cement panels gaining cold-chain and clean-room share.


Material selection in India is driven less by preference than by application economics. Concrete dominates where floor plates repeat, and moulds amortise; metal dominates where clear spans matter. Timber's growth rate is the highest in this dimension but starts from a base small enough that certified supply, not buyer appetite, remains the constraint through at least 2029.

By Application

Sub-SegmentKey Trend
ResidentialPublic housing sanctions under PMAY-Urban 2.0 converting into standing panel orders
CommercialData-centre and Grade-A warehouse clients underwriting schedule certainty at premium pricing
OthersState health and education departments standardising factory-built blocks for remote districts


Application mix determines margin profile across the supplier base. Residential volume is reliable but price-competitive, tendered largely by public agencies on lowest-cost terms. Commercial work carries better economics because delivery certainty outweighs unit cost for clients whose revenue clock starts at handover. The institutional bucket is smaller but increasingly systematic in its procurement.

By Product Type

Sub-SegmentKey Trend
Modular BuildingsRental fleets redeployed across construction, mining, and event contracts
Panelized & Componentized SystemsVertical scalability clearing the transport radius ceiling that caps volumetric economics.
Other Prefab TypesContainer conversions and seismic core pods serving specialised public and NGO demand


Product type maps closely to project geometry. Volumetric modules win where units are small, repetitive, and within roughly 350 km of a plant. Panelized systems win everywhere else, particularly on high-rise housing where a volumetric approach becomes structurally and logistically impractical above eight to ten floors.

By City Cluster

Sub-SegmentKey Trend
Delhi-NCRQuick-commerce dark stores and cold-chain capacity sustaining steady replacement demand
BangaloreColocation capacity and electronics campuses producing the fastest metro growth rate
MumbaiBhiwandi–Panvel warehousing belt paired with Navi Mumbai data-centre construction
ChennaiAutomotive and electronics supplier parks specifying long-span framing as default
HyderabadPharmaceutical block construction and colocation buildout in parallel
PuneChakan–Talegaon industrial belt expansion and ancillary supplier facilities
AhmedabadTextile, chemicals, and Dholera-linked industrial activity
Rest of IndiaTier-2 housing, agri-processing, and mining ancillaries forming the largest single cluster


The most consequential fact in this dimension is that no single metro dominates. The rest of India holds a third of national value, spread across dozens of Tier-2 and Tier-3 cities where local fabrication capacity is thin. Producers building distributed satellite plants inside 300 km catchments will capture demand that metro-anchored competitors cannot serve at a competitive delivered cost.




Download PDF ×

We do not share your information with anyone. However, we may send you emails based on your report interest from time to time. You may contact us at any time to opt-out.