ID: MRFR/CO/3733-CR | January 2018 | Region: Global | 102 pages
Market Scenario
Prefabricated building architecture is a manufacturing process or an assembly site, in which various materials and building systems are combined to form a component or a part of larger onsite assembly or a building, where the structure is to be installed onsite, or installing the building system onsite.
There is seen an increase in the global foreign direct investment (FDI) inflows. According to United States Economic and Social Commission for Asia and Pacific (UNESCAP), it was valued at USD 1.76 trillion in 2015. This amounted for 38% increase compared with 2014. The rise in FDI inflows was more prominent in developed economies, which received USD 962 billion in 2015, i.e. 84% more than in 2014. This along with FDI in retail has pushed the number of construction projects in the region. This induces the demand for prefabricated buildings market in the region.
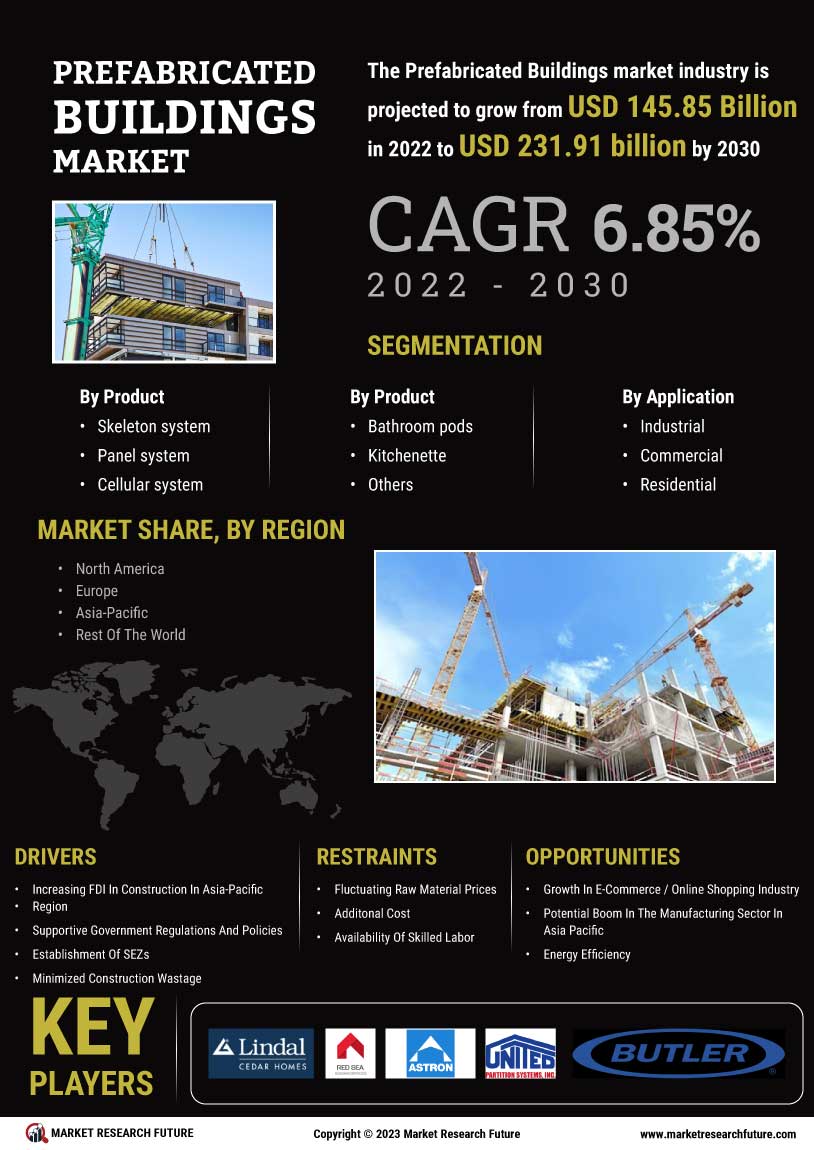
The global prefabricated buildings market has been segmented based on product, module type, application, and region. Based on product, panel system accounted for the largest market share of 33.21% in 2016, and is projected to grow at the highest CAGR during the forecast period. On the basis of module type bathroom pods account for the largest market share in 2016. Based on application, commercial accounted for the largest market share with a market value of USD 36,083.2 million and is projected to grow at the highest CAGR during the forecast period.
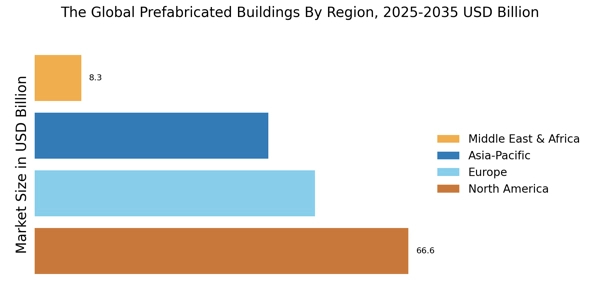
The Asia-Pacific region dominated the global prefabricated construction market in 2016. It is also expected to be the fastest growing region for the prefabricated construction. Increase in industrialization, rising urbanized population, and growth in spending capacity are the factors driving the growth of the market in Asia-Pacific region. In 2016, it accounted for highest CAGR of 5.81% during the forecast period.
Segmentation: Global Prefabricated Buildings Market
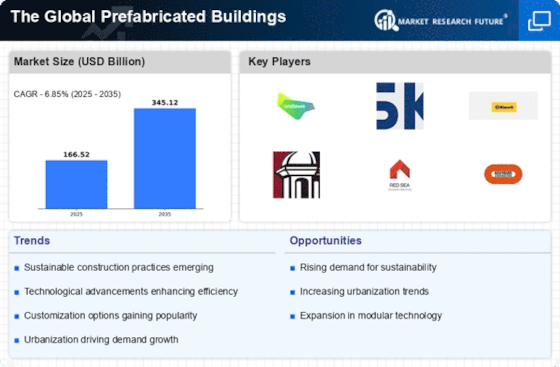
Hence, global Prefabricated Buildings market is expected to reach a market size of USD 135,945.6 million by the end of the forecast period at CAGR of 5.54%.
The report for Global Prefabricated Buildings Market of Market Research Future comprises of extensive primary research along with the detailed analysis of qualitative as well as quantitative aspects by various industry experts, key opinion leaders to gain the deeper insight of the market and industry performance. The report gives the clear picture of current market scenario which includes historical and projected market size in terms of value and volume, technological advancement, macro economical and governing factors in the market. The report provides details information and strategies of the top key players in the industry. The report also gives a broad study of the different market segments and regions.
Frequently Asked Questions (FAQ) :
Global prefabricated buildings market projected to grow at approximately 5.54% CAGR during the assessment period (2017-2023).
The valuation of the global prefabricated buildings market is estimated to increase to USD 135,945.6 MN by the end of 2023.
Increasing FDI in construction in the APAC region, supportive government regulations & policies, and establishment of SEZs, are major tailwinds pushing the growth of the global prefabricated buildings market.
Asia Pacific holds the largest share in the global prefabricated buildings market, followed by North America and Europe, respectively.
Algeco Scotsman, Red Sea Housing Services, Butler Manufacturing Company, Astron Buildings, Champion Home Builders, Inc., Kirby Building Systems LLC, Ritz-Craft Corporation, Lindal Cedar Homes, Inc., Modern Prefab Systems Pvt. Ltd., United Partition Systems Inc., and Par-Kut International Inc., are some of the top players operating in the global prefabricated buildings market.
1 Executive Summary
2 Introduction
2.1 Definition 13
2.2 Scope of the Study 13
2.3 Assumptions 13
2.4 Market Structure 14
3 Research Methodology
3.1 Research Process 15
3.2 Primary Research 16
3.3 Secondary Research 16
3.4 Market Size Estimation 16
3.5 Forecast Model 18
4 Market Dynamics
4.1 Drivers 20
4.1.1 Increasing FDI in construction in Asia-Pacific region 20
4.1.2 Supportive Government Regulations And Policies 21
4.1.3 Establishment of SEZs 22
4.1.4 Minimized construction wastage 22
4.2 Restraints 23
4.2.1 Fluctuating raw material prices 23
4.2.2 Additonal Cost 24
4.2.3 Availability of skilled labor 24
4.3 Opportunities 25
4.3.1 Growth in E-Commerce / Online shopping industry 25
4.3.2 Potential boom in the manufacturing sector in Asia Pacific 25
4.3.3 Energy Efficiency 26
5 Market Factor Analysis
5.1 Porter's Five Forces Analysis 27
5.1.1 Threat of New Entrants 28
5.1.2 Bargaining Power of Suppliers 28
5.1.3 Bargaining Power of Buyers 28
5.1.4 Threat of Substitutes 28
5.1.5 Rivalry 28
5.2 Value Chain Analysis 29
6 Global Prefabricated Buildings Market, By Product
6.1 Overview 32
6.1.1 Skeleton System 32
6.1.2 Panel System 32
6.1.3 Cellular System 32
6.1.4 Combined System 32
7 Global Prefabricated Buildings Market, By Module Type
7.1 Overview 35
7.1.1 Bathroom Pods 35
7.1.2 Kitchenette 35
8 Global Prefabricated Buildings Market, By Application
8.1 Overview 38
8.1.1 Industrial 38
8.1.2 Commercial 38
8.1.3 Residential 38
9 Global Prefabricated Buildings Market, By Region
9.1 Introduction 41
9.2 North America 43
9.2.1 U.S. 45
9.2.2 Canada 47
9.3 Europe 49
9.3.1 Germany 51
9.3.2 U.K. 52
9.3.3 France 55
9.3.4 Rest of Europe 57
9.4 Asia-Pacific 59
9.4.1 China 62
9.4.2 Japan 63
9.4.3 India 65
9.4.4 Rest of Asia-Pacific 67
9.5 Rest of the World 69
9.5.1 South America 71
9.5.2 Middle East & Africa 73
10 Competitive Scenario
10.1 Competitive Landscape 75
10.2 Competitive Benchmarking 76
10.3 Market Share Analysis 77
11 Company Profile
11.1 Red Sea Housing Services 78
11.1.1 Company Overview 78
11.1.2 Financial Overview 78
11.1.3 Recent Projects 79
11.1.4 Strategy 80
11.1.5 SWOT Analysis 80
11.2 Algeco Scotsman 81
11.2.1 Company Overview 81
11.2.2 Financial Overview 81
11.2.3 Strategy 82
11.2.4 Key Developments 82
11.2.5 SWOT Analysis 83
11.3 Butler Manufacturing Company 84
11.3.1 Company Overview 84
11.3.2 Financial Overview 84
11.3.3 Product/Service Offering 84
11.3.4 Strategy 85
11.3.5 SWOT Analysis 85
11.4 Champion Home Builders, Inc. 86
11.4.1 Company Overview 86
11.4.2 Financial Overview 86
11.4.3 Strategy 86
11.4.4 SWOT Analysis 87
11.5 Astron Buildings 88
11.5.1 Company Overview 88
11.5.2 Financial Overview 88
11.5.3 SWOT Analysis 88
11.5.1 Product Offering 89
11.5.2 Strategy 89
11.5.3 Recent Projects 90
11.6 Kirby Building Systems LLC 91
11.6.1 Financial Overview 91
11.6.2 Product/Service Offering 92
11.6.3 Strategy 93
11.7 Lindal Cedar Homes, Inc. 94
11.7.1 Company Overview 94
11.7.2 Financial Overview 94
11.7.3 Strategy 94
11.8 Ritz-Craft Corporation 95
11.8.1 Company Overview 95
11.8.2 Financial Overview 95
11.8.3 Strategy 95
11.9 Modern Prefab Systems Pvt. Ltd. 96
11.9.1 Company Overview 96
11.9.2 Financial Overview 96
11.9.3 Product Offering 96
11.9.4 Strategy 97
11.10 Par-Kut International Inc. 98
11.10.1 Company Overview 98
11.10.2 Financial Overview 98
11.10.3 Product Offering 98
11.10.4 Strategy 99
11.11 United Partition Systems Inc. 100
11.11.1 Company Overview 100
11.11.2 Financial Overview 100
11.11.3 Product Offering 100
11.11.4 Strategy 100
12 List of Tables
TABLE 1 MARKET SYNOPSIS 12
TABLE 2 SHARE OF TOP FIVE COUNTRIES ATTRACTING FDI EQUITY INFLOWS FOR CONSTRUCTION DEVELOPMENT, 2020-2027 (USD MILLION) 20
TABLE 3 INDIA: GOVERNMENT INVESTMENT IN SEZ 22
TABLE 4 GLOBAL PREFABRICATED BUILDINGS MARKET, BY PRODUCT, 2020-2027 (USD MILLION) 33
TABLE 5 GLOBAL PREFABRICATED BUILDINGS MARKET, BY MODULE TYPE, 2020-2027 (USD MILLION) 36
TABLE 6 GLOBAL PREFABRICATED BUILDINGS MARKET, BY APPLICATION, 2020-2027 (USD MILLION) 39
TABLE 7 GLOBAL PREFABRICATED BUILDINGS MARKET, BY REGION, 2020-2027 (USD MILLION) 42
TABLE 8 NORTH AMERICA: PREFABRICATED BUILDINGS MARKET, BY COUNTRY, 2020-2027 (USD MILLION) 43
TABLE 9 NORTH AMERICA: PREFABRICATED BUILDINGS MARKET, BY PRODUCT, 2020-2027 (USD MILLION) 43
TABLE 10 NORTH AMERICA: PREFABRICATED BUILDINGS MARKET, BY MODULE TYPE, 2020-2027 (USD MILLION) 44
TABLE 11 NORTH AMERICA: PREFABRICATED BUILDINGS MARKET, BY APPLICATION, 2020-2027 (USD MILLION) 44
TABLE 12 ANNUAL VALUE OF CONSTRUCTION, U.S., 2020-2027 (USD MILLION) 45
TABLE 13 U.S.: PREFABRICATED BUILDINGS MARKET, BY PRODUCT, 2020-2027 (USD MILLION) 45
TABLE 14 U.S.: PREFABRICATED BUILDINGS MARKET SIZE, BY MODULE TYPE, 2020-2027 (USD MILLION) 46
TABLE 15 U.S.: PREFABRICATED BUILDINGS MARKET, BY APPLICATION, 2020-2027 (USD MILLION) 46
TABLE 16 CANADA: PREFABRICATED BUILDINGS MARKET, BY PRODUCT, 2020-2027 (USD MILLION) 47
TABLE 17 CANADA: PREFABRICATED BUILDINGS MARKET SIZE, BY MODULE TYPE, 2020-2027 (USD MILLION) 47
TABLE 18 CANADA: PREFABRICATED BUILDINGS MARKET, BY APPLICATION, 2020-2027 (USD MILLION) 48
TABLE 19 EUROPE: PREFABRICATED BUILDINGS MARKET, BY COUNTRY, 2020-2027 (USD MILLION) 49
TABLE 20 EUROPE: PREFABRICATED BUILDINGS MARKET, BY PRODUCT, 2020-2027 (USD MILLION) 49
TABLE 21 EUROPE: PREFABRICATED BUILDINGS MARKET, BY MODULE TYPE, 2020-2027 (USD MILLION) 50
TABLE 22 EUROPE: PREFABRICATED BUILDINGS MARKET, BY APPLICATION, 2020-2027 (USD MILLION) 50
TABLE 23 GERMANY: PREFABRICATED BUILDINGS MARKET, BY PRODUCT, 2020-2027 (USD MILLION) 51
TABLE 24 GERMANY: PREFABRICATED BUILDINGS MARKET, BY MODULE TYPE, 2020-2027 (USD MILLION) 51
TABLE 25 GERMANY: PREFABRICATED BUILDINGS MARKET, BY APPLICATION, 2020-2027 (USD MILLION) 52
TABLE 26 U.K.: PREFABRICATED BUILDINGS MARKET, BY PRODUCT, 2020-2027 (USD MILLION) 53
TABLE 27 U.K.: PREFABRICATED BUILDINGS MARKET, BY MODULE TYPE, 2020-2027 (USD MILLION) 53
TABLE 28 U.K.: PREFABRICATED BUILDINGS MARKET, BY APPLICATION, 2020-2027 (USD MILLION) 54
TABLE 29 FRANCE: PREFABRICATED BUILDINGS MARKET, BY PRODUCT, 2020-2027 (USD MILLION) 55
TABLE 30 FRANCE: PREFABRICATED BUILDINGS MARKET, BY MODULE TYPE, 2020-2027 (USD MILLION) 55
TABLE 31 FRANCE: PREFABRICATED BUILDINGS MARKET, BY APPLICATION, 2020-2027 (USD MILLION) 56
TABLE 32 REST OF EUROPE: PREFABRICATED BUILDINGS MARKET, BY PRODUCT, 2020-2027 (USD MILLION) 57
TABLE 33 REST OF EUROPE: PREFABRICATED BUILDINGS MARKET, BY MODULE TYPE, 2020-2027 (USD MILLION) 57
TABLE 34 REST OF EUROPE: PREFABRICATED BUILDINGS MARKET, BY APPLICATION, 2020-2027 (USD MILLION) 58
TABLE 35 ASIA-PACIFIC: PREFABRICATED BUILDINGS MARKET, BY COUNTRY, 2020-2027 (USD MILLION) 60
TABLE 36 ASIA-PACIFIC: PREFABRICATED BUILDINGS MARKET, BY PRODUCT, 2020-2027 (USD MILLION) 60
TABLE 37 ASIA-PACIFIC: PREFABRICATED BUILDINGS MARKET, BY MODULE TYPE, 2020-2027 (USD MILLION) 61
TABLE 38 ASIA-PACIFIC: PREFABRICATED BUILDINGS MARKET, BY APPLICATION, 2020-2027 (USD MILLION) 61
TABLE 39 CHINA: PREFABRICATED BUILDINGS MARKET, BY PRODUCT, 2020-2027 (USD MILLION) 62
TABLE 40 CHINA: PREFABRICATED BUILDINGS MARKET, BY MODULE TYPE, 2020-2027 (USD MILLION) 62
TABLE 41 CHINA: PREFABRICATED BUILDINGS MARKET, BY APPLICATION, 2020-2027 (USD MILLION) 63
TABLE 42 JAPAN: PREFABRICATED BUILDINGS MARKET, BY PRODUCT, 2020-2027 (USD MILLION) 63
TABLE 43 JAPAN: PREFABRICATED BUILDINGS MARKET, BY MODULE TYPE, 2020-2027 (USD MILLION) 64
TABLE 44 JAPAN: PREFABRICATED BUILDINGS MARKET, BY APPLICATION, 2020-2027 (USD MILLION) 64
TABLE 45 INDIA: PREFABRICATED BUILDINGS MARKET, BY PRODUCT, 2020-2027 (USD MILLION) 65
TABLE 46 INDIA: PREFABRICATED BUILDINGS MARKET, BY MODULE TYPE, 2020-2027 (USD MILLION) 65
TABLE 47 INDIA: PREFABRICATED BUILDINGS MARKET, BY APPLICATION, 2020-2027 (USD MILLION) 66
TABLE 48 REST OF ASIA-PACIFIC: PREFABRICATED BUILDINGS MARKET, BY PRODUCT, 2020-2027 (USD MILLION) 67
TABLE 49 REST OF ASIA-PACIFIC: PREFABRICATED BUILDINGS MARKET, BY MODULE TYPE, 2020-2027 (USD MILLION) 67
TABLE 50 REST OF ASIA-PACIFIC: PREFABRICATED BUILDINGS MARKET, BY APPLICATION, 2020-2027 (USD MILLION) 68
TABLE 51 ROW: PREFABRICATED BUILDINGS MARKET, BY COUNTRY, 2020-2027 (USD MILLION) 69
TABLE 52 ROW: PREFABRICATED BUILDINGS MARKET, BY PRODUCT, 2020-2027 (USD MILLION) 69
TABLE 53 ROW: PREFABRICATED BUILDINGS MARKET, BY MODULE TYPE, 2020-2027 (USD MILLION) 70
TABLE 54 ROW: PREFABRICATED BUILDINGS MARKET, BY APPLICATION, 2020-2027 (USD MILLIONS) 70
TABLE 55 SOUTH AMERICA: PREFABRICATED BUILDINGS MARKET, BY PRODUCT, 2020-2027 (USD MILLION) 71
TABLE 56 SOUTH AMERICA: PREFABRICATED BUILDINGS MARKET, BY MODULE TYPE, 2020-2027 (USD MILLION) 71
TABLE 57 SOUTH AMERICA: PREFABRICATED BUILDINGS MARKET, BY APPLICATION, 2020-2027 (USD MILLION)\ 72
TABLE 58 MIDDLE EAST & AFRICA: PREFABRICATED BUILDINGS MARKET, BY PRODUCT, 2020-2027 (USD MILLION) 73
TABLE 59 MIDDLE EAST & AFRICA: PREFABRICATED BUILDINGS MARKET, BY MODULE TYPE, 2020-2027 (USD MILLION) 73
TABLE 60 MIDDLE EAST & AFRICA: PREFABRICATED BUILDINGS MARKET, BY APPLICATION, 2020-2027 (USD MILLION) 74
TABLE 61 RED SEA HOUSING SERVICES: GEOGRAPHIC REVENUE MIX, 2020 (%) 79
13 List of Figures
FIGURE 1 RESEARCH PROCESS OF MRFR 15
FIGURE 2 TOP DOWN & BOTTOM UP APPROACH 17
FIGURE 3 GLOBAL PREFABRICATED BUILDINGS MARKET: DRIVERS, RESTRAINTS AND TRENDS 19
FIGURE 4 FDI INFLOWS, ASIA-PACIFIC, 2020-2027 (USD BILLION) 21
FIGURE 5 GLOBAL PREFABRICATED BUILDINGS MARKET: DRIVERS IMPACT ANALYSIS 23
FIGURE 6 GLOBAL HISTORIC AND FORECASTED STEEL PRICES, 2020-2027 (USD/TONNE) 24
FIGURE 7 GLOBAL PREFABRICATED BUILDINGS MARKET: BARRIERS IMPACT ANALYSIS 25
FIGURE 8 PORTER'S 5 FORCES ANALYSIS OF GLOBAL PREFABRICATED BUILDINGS MARKET 27
FIGURE 9 VALUE CHAIN ANALYSIS OF GLOBAL PREFABRICATED BUILDINGS MARKET 29
FIGURE 10 GLOBAL PREFABRICATED BUILDINGS MARKET, BY PRODUCT, 2020 (IN %) 33
FIGURE 11 GLOBAL PREFABRICATED BUILDINGS MARKET, BY MODULE TYPE, 2020 (IN %) 35
FIGURE 12 GLOBAL PREFABRICATED BUILDINGS MARKET, BY APPLICATION, 2020 (IN %) 39
FIGURE 13 PREFABRICATED BUILDINGS MARKET SHARE, BY REGION, 2020 (IN %) 41
FIGURE 14 VALUE OF CONSTRUCTION IN GREAT BRITAIN, 2020-2027 (USD MILLION) 52
FIGURE 15 FDI INFLOWS, ASIA-PACIFIC, 2020-2027 (USD BILLION) 59
FIGURE 16 GROWTH STRATEGIES ADOPTED BY KEY PLAYERS IN GLOBAL PREFABRICATED BUILDINGS MARKET, 2020-2027, (%) 75
FIGURE 17 GLOBAL PREFABRICATED BUILDINGS MARKET: COMPETITIVE BENCHMARKING 76
FIGURE 18 GLOBAL PREFABRICATED BUILDINGS MARKET: MARKET SHARE ANALYSIS 77
FIGURE 19 RED SEA HOUSING SERVICES: TOTAL REVENUE VS SEGMENTAL REVENUE (USD MILLION) 78
FIGURE 20 ALGECO SCOTSMAN: TOTAL REVENUE, 2020-2027 (USD MILLION) 81
FIGURE 21 ALGECO SCOTSMAN: GEOGRAPHIC REVENUE MIX, 2020 (%) 82
FIGURE 22 ALGECO SCOTSMAN: KEY DEVELOPMENTS, 2020-2027 (%) 82
FIGURE 23 CHAMPION HOME BUILDERS, INC.: KEY DEVELOPMENTS, 2020-2027 (%) 86