ID: MRFR/LS/0267-CR | August 2019 | Region: Global | 130 pages
The Global Immortalized Cell Line Market is expected to register 9.30% CAGR and is anticipated to reach USD 4,105.62 Million by 2023. Immortalized cell lines are either tumorous cells that do not stop dividing or cells that have been artificially manipulated to proliferate indefinitely and can, thus, be cultured over several generations. These cell lines are expected to grow due to the rise in vaccine production and innovative technologies.
Besides, the ability of cell line culture to provide more physiologically relevant information and more accurate data in-vitro tests has led cell line culture systems to become acceptable in comparison to media culture.
The increasing application in biotech and pharmaceutical companies and hospitals, a growing number of patients in need of organ transplantation, and the rise in the patient population affected by cancer are the major drivers propelling market growth. However, the high cost of equipment and developing a stable strain of cell line and maintaining and preventing it from contamination may hinder the growth of the market.
Market Dynamics
The increasing demand for organ donation due to scarcity in the availability of organs is driving the need for artificially created biological cells. For instance, according to the US Department of Health & Human Services Organ Procurement and Transplantation Network (OPTN), as of November 2016, 121,678 patients were waiting for a life-saving organ transplant. This rising demand for an organ transplant is expected to drive the growth of the market during the forecast period. Additionally, increasing application in biotech and pharmaceutical companies and hospitals and rise in the patient population affected by cancer are likely to support market growth. On the other hand, the high cost of equipment and developing a stable strain of cell line and maintaining and preventing it from contamination is anticipated to hamper the market growth.
Global Immortalized Cell Line Market Size, by End User, 2017 (USD Million)
Source: MRFR Analysis
Segmentation
The global immortalized cell line market has been segmented into method, application, and end user.
Based on the method, the global market has been segmented into virus induction, hTERT expression, inactivation of tumor suppression genes, and others. The virus induction segment is further divided into EBV genes, SV40 T antigen, HPV-16 E6/6 gene, and others. The hTERT expression segment is sub-segmented into P53 and Myc T58A.
The global immortalized cell line market, based on application, is segmented into diagnostics, drug discovery, vaccine production, tissue engineering and regenerative medicine, and others.
Based on end user, the global market is segmented into pharmaceutical and biopharmaceutical companies, Contract Research Organizations (CROs), and research laboratories. The pharmaceutical and biopharmaceutical companies segment accounted for a market value of USD 1,323.79 million in 2017.
Key Players
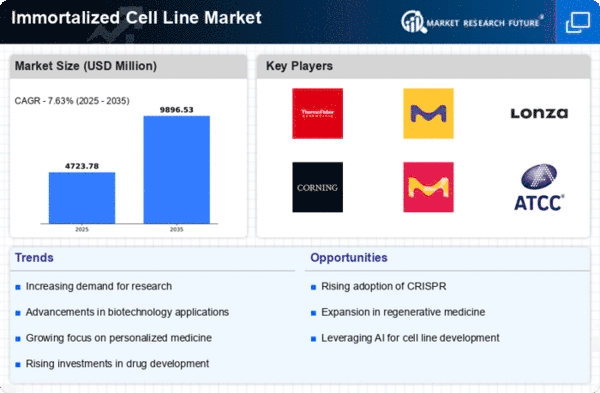
The prominent players in the global immortalized cell line market are Thermo Fisher Scientific (US), ATCC (American Type Culture Collection Inc.) (US), Valneva (France), Sartorius AG (Germany), Lonza Group, AG (Switzerland), Merck KGaA (Germany), Selexis SA (Switzerland), WuXi App Tec (China), European Collection of Authenticated Cell Cultures (ECACC) (Europe), and Corning Incorporated (US)
Some of the key strategies followed by the players operating in the global immortalized cell line market are innovation, product development, acquisition, and expansion.
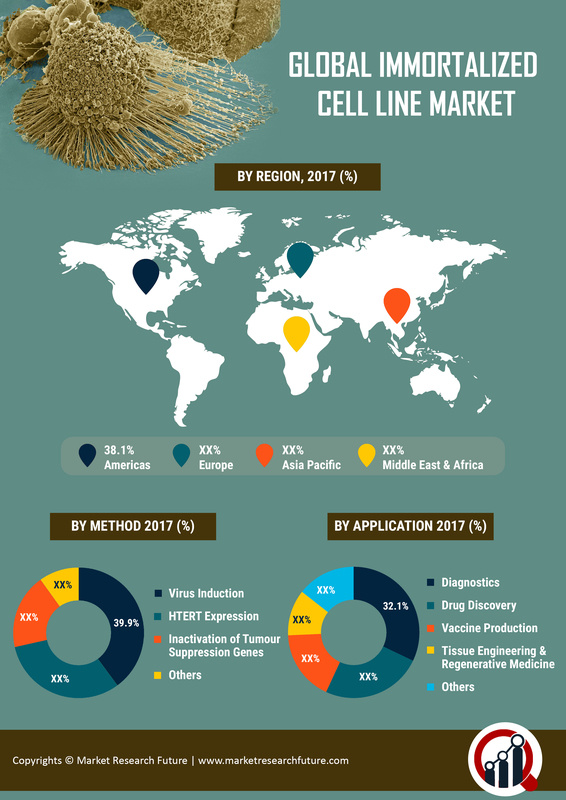
Global Immortalized Cell Line Market Share, by Region, 2017 (%)
Source: MRFR Analysis
Regional Analysis
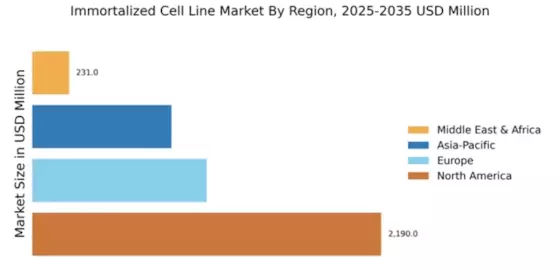
The global immortalized cell line market, based on region, is segmented into the Americas, Europe, Asia-Pacific, and the Middle East & Africa.
The Americas is estimated to dominate the global immortalized cell line market during the forecast period. This is attributed to an increase in the occurrence of cancer, the presence of well-established pharmaceutical and biotechnology industry, increasing awareness of immortalized cell lines, and strong research funding.
The European market for immortalized cell line is expected to be the second-largest during the forecast period. Increasing government support, well-developed technology, and rising cases of cancer are expected to boost the growth of the market in this region.
Asia-Pacific is estimated to be the fastest-growing market due to the increasing expenditure on healthcare by government and private sector companies. Moreover, the growing awareness about healthcare and large untapped patient population have led to the increased focus of key players on expansion in this region. Furthermore, the region accounted for a market share of 17.8% in 2017.
The immortalized cell line market in the Middle East & Africa is expected to hold the least market share.
Key Updates
Market Segmentation
Global Immortalized Cell Line Market, by Method
Global Immortalized Cell Line Market, by Application
Global Immortalized Cell Line Market, by End User
Global Immortalized Cell Line Market, by Region
Intended Audience
Frequently Asked Questions (FAQ) :
Immortalized Cell Line Market is predicted to touch USD 4,105.62 million by 2023.
Immortalized Cell Line Market is projected to grow at a 9.30% CAGR between 2020-2027.
North America is projected to dominate the Immortalized Cell Line Market.
Pharmaceutical & biopharmaceutical companies will dominate the Immortalized Cell Line Market.
Increasing prevalence of cancer, growing need for organ transplantation, and rising application in hospitals, pharmaceutical & biotech companies are boosting market growth.
The global immortalized cell line market was valued at USD 2,421.34 Million in 2017 and is expected to grow exponentially reaching an estimated USD 4,105.62 Million by the end of the forecast period of 2018-2023. It is projected that the market will expand at a splendid CAGR of 9.30% over the forecast period.
The global immortalized cell line market has been observing persistent growth on account of widening application in biotech and pharmaceutical companies and other healthcare organizations, the surging need for organ transplantation and growing incidences of oncology diseases to name a fews.
Immortalized cell lines have a long shelf life and can be preserved for a longer time. Moreover, cell line culture model is proven to produce more accurate results than the organ culture model which makes them appropriate for use in a wide range of applications. Biotech and pharmaceutical companies use them for gene function studies, drug discovery, testing toxicity of compounds or drugs and in the production of eukaryotic proteins. Being a cost-effective way for growing cells, they find extensive application in bioproduction and diagnostics which fosters the growth of the market.
Immortalized cell lines have significant implications for organ replacement as they are used to create artificial biological cells. The proliferating demand for organ transplantation is expected to drive the global immortalized cell line market over the forecast period.
The initial set up cost of cell line culture laboratory requires substantial investment. For instance, Thermo Fisher offers AlgiMatrix, a 3D culture system for USD 27,000 to USD 30,000. Moreover, legislation and stringent codes of practice governing the use of immortalized cell culture owing to cell line are likely to remain as an impediment to the market growth over the forecast period.
Mounting use of immortalized cell line culture in cancer and stem cell research is expected to offer potential growth opportunities to the global immortalized cell line market. Immortalized cell lines are powerful tools for the biological investigation and are being applied to the study of cancer biology and stem cell research. They are also used to assess the efficacy of anticancer drugs which is expected to reflect positively on the market growth over the forecast period.
The global immortalized cell line market has been segmented based on method, application, and end-user. By method, the market has been segmented into virus induction, HTERT expression, inactivation of tumor suppression genes, and others. The virus induction segment is the leading segment by method and is likely to maintain its dominance over the forecast period due to the towering requirement of the newly developed diagnostic techniques over the globe. HTERT Expression segment is projected to be the fastest growing segment over the forecast period. The HTERT expression segment is further segmented into P53 and Myc T58A. The P53 is the largest sub-segment due to the convenience and stability in the production of cell line culture whereas the T58A is the projected to be the fastest growing sub-segment.
The virus induction segment is further segmented into EBV genes, SV40 T antigen, HPV-16 E6/6 gene and others. The EBV genes are the leading sub-segment owing to increasing demand for this method, whereas, HPV-16 E6/6 gene is the fastest growing sub-segment.
By application, the market has been segmented into diagnostics, vaccine production, drug discovery, tissue engineering and regenerative medicine, target validation, and others. Application wise, the diagnostic segment is projected to be the largest one and was valued at USD 776.58 Million in 2017. Advancements in the study of virus infection and virus diagnostics and a rise in a number of drug approvals can be attributed for the growth of the segment. Vaccine production is the fastest growing application segment due to the broad application of immortalized cell lines in vaccine production and an increasing number of strategic collaborations between immortalized cell line manufacturing companies and biopharmaceutical firms.
By end-user, the market has been segmented into pharmaceutical and biopharmaceutical companies, contract research organizations, research laboratories. The pharmaceutical and biopharmaceutical companies segment is the leading segment due to rising demand for drug discovery research. The contract research organizations segment is slated to be the fastest growing segment. Complex drug development cycle prompts more and more companies to outsource process which can be attributed for the growth of the segment.
Regional Analysis
The global immortalized cell line market spans across the regions of North America, Europe, Asia Pacific and the Middle East & Africa.
The Asia Pacific is the fastest growing market for immortalized cell line. The region offers lucrative growth opportunities for the market owing to the populace demographics. Increasing expenditure on healthcare by the government as well as private companies coupled with a growing number of clinical research organizations in the region support the growth of the market in the region. Additionally, in Asia-Pacific, China is expected to grow owing to the advancement in technology for mammalian cell line development for recombinant protein production.
Currently, North America is dominating the global immortalized cell line market followed by Europe. This growth can be attributed to a strong value maintained by the pharmaceutical sector in both the US and Canada. Also, the increase in the occurrence of cancer, the presence of well-established pharmaceutical and biotechnology industry, increasing awareness of immortalized cell lines, and robust research funding in the region also contributes to the share of the market.
Competitive Tracking
The global immortalized cell line market is highly competitive, characterized by the presence of few established players accounting for the major share of the market. The four major players namely: Lonza Group AG, Corning Incorporated, Thermo Fisher Scientific, Selexis SA account for approximately 65.1% share of the global immortalized cell line market. The other notable players in the market include Lonza Group AG, Thermo Fisher Scientific, Sartorius AG, WuXi App Tec, Corning Incorporated, Selexis SA, Sartorius AG, WuXi App Tec, and others. The market players are aiming to gain a competitive edge over the market by indulging in strategic mergers and acquisitions.
1 Report Prologue
2 Executive Summary
3 Market Introduction
3.1 Scope of Study 19
3.2 Research Objective 19
3.3 List of Assumptions 19
3.4 Market Structure 20
4 Research Methodology
4.1 Research Process 22
4.2 Primary Research 23
4.3 Secondary Research 24
4.4 Market Size Estimation 25
4.5 Forecast Model 25
5 Market Dynamics
5.1 Introduction 27
5.2 Drivers 28
5.2.1 Increasing Application in Biotech & Pharmaceutical Companies and Hospitals 28
5.2.2 Growing Number of Patients in Need of Organ Transplantation 28
5.2.3 Rise in the Patient Population Affected by Cancer 29
5.3 Restraints 29
5.3.1 High Cost of Equipment 29
5.3.2 Developing Stable and Authentic Cell Lines 29
5.4 Opportunities 30
5.4.1 Entering Untapped Markets 30
5.4.2 Increasing Use of cell Line Culture in Cancer and Stem Cell Research 30
6 Market Factor Analysis
6.1 Porters Five Forces Analysis 32
6.1.1 Bargaining Power of Suppliers 32
6.1.2 Bargaining Power of Buyers 32
6.1.3 Threat of New Entrants 32
6.1.4 Threat of Substitutes 33
6.1.5 Intensity of Rivalry 33
6.2 Supply Chain Analysis 33
6.2.1 R&D 33
6.2.2 Manufacturing 33
6.2.3 Distribution & Sales 34
6.2.4 Post-Sales Monitoring 34
6.3 Investment Opportunities 34
6.4 Pricing Analysis 34
7 Immortalized Cell Line Market, by Method
7.1 Overview 36
7.1.1 Virus Induction 38
7.1.2 HTERT Expression 39
7.1.3 Inactivation of Tumour Suppression Genes 40
7.1.4 Others 40
8 Immortalized Cell Line Market, by Application
8.1 Overview 42
8.1.1 Diagnostics 43
8.1.2 Drug Discovery 43
8.1.3 Vaccine Production 44
8.1.4 Tissue Engineering and Regenerative Medicines 45
8.1.5 Others 45
9 Immortalized Cell Line Market, by End-user
9.1 Overview 47
9.1.1 Introduction 47
9.1.2 Pharmaceutical and Biopharmaceutical Companies 48
9.1.3 Contract Research Organizations 48
9.1.4 Research Laboratories 49
10 Global Immortalized Cell Line Market, By Region
10.1 Overview 51
10.2 Americas 52
Immortalized Cell Line Market, by Method
Immortalized Cell Line Market, by Application
Immortalized Cell Line Market, by End-user
10.2.1 North America 54
Immortalized Cell Line Market, by Method
Immortalized Cell Line Market, by Application
Immortalized Cell Line Market, by End-user
10.2.1.1 US 57
Immortalized Cell Line Market, by Method
Immortalized Cell Line Market, by Application
Immortalized Cell Line Market, by End-user
10.2.1.2 Canada 58
Immortalized Cell Line Market, by Method
Immortalized Cell Line Market, by Application
Immortalized Cell Line Market, by End-user
10.2.2 South America 60
Immortalized Cell Line Market, by Method
Immortalized Cell Line Market, by Application
Immortalized Cell Line Market, by End-user
10.3 Europe 62
Immortalized Cell Line Market, by Method
Immortalized Cell Line Market, by Application
Immortalized Cell Line Market, by End-user
10.3.1 Western Europe 65
Immortalized Cell Line Market, by Method
Immortalized Cell Line Market, by Application
Immortalized Cell Line Market, by End-user
10.3.1.1 Germany 67
Immortalized Cell Line Market, by Method
Immortalized Cell Line Market, by Application
Immortalized Cell Line Market, by End-user
10.3.1.2 France 69
Immortalized Cell Line Market, by Method
Immortalized Cell Line Market, by Application
Immortalized Cell Line Market, by End-user
10.3.1.3 UK 71
Immortalized Cell Line Market, by Method
Immortalized Cell Line Market, by Application
Immortalized Cell Line Market, by End-user
10.3.1.4 Italy 73
Immortalized Cell Line Market, by Method
Immortalized Cell Line Market, by Application
Immortalized Cell Line Market, by End-user
10.3.1.5 Spain 75
Immortalized Cell Line Market, by Method
Immortalized Cell Line Market, by Application
Immortalized Cell Line Market, by End-user
10.3.1.6 Rest of Western Europe 76
Immortalized Cell Line Market, by Method
Immortalized Cell Line Market, by Application
Immortalized Cell Line Market, by End-user
10.3.2 Eastern Europe 78
Immortalized Cell Line Market, by Method
Immortalized Cell Line Market, by Application
Immortalized Cell Line Market, by End-user
10.4 Asia-Pacific 80
Immortalized Cell Line Market, by Method
Immortalized Cell Line Market, by Application
Immortalized Cell Line Market, by End-user
10.4.1 Japan 82
Immortalized Cell Line Market, by Method
Immortalized Cell Line Market, by Application
Immortalized Cell Line Market, by End-user
10.4.2 China 84
Immortalized Cell Line Market, by Method
Immortalized Cell Line Market, by Application
Immortalized Cell Line Market, by End-user
10.4.3 India 86
Immortalized Cell Line Market, by Method
Immortalized Cell Line Market, by Application
Immortalized Cell Line Market, by End-user
10.4.4 South Korea 87
Immortalized Cell Line Market, by Method
Immortalized Cell Line Market, by Application
Immortalized Cell Line Market, by End-user
10.4.5 Rest of Asia-Pacific 89
Immortalized Cell Line Market, by Method
Immortalized Cell Line Market, by Application
Immortalized Cell Line Market, by End-user
10.5 Middle East and Africa 91
Immortalized Cell Line Market, by Method
Immortalized Cell Line Market, by Application
Immortalized Cell Line Market, by End-user
10.5.1 Middle East 93
Immortalized Cell Line Market, by Method
Immortalized Cell Line Market, by Application
Immortalized Cell Line Market, by End-user
10.5.2 Africa 95
Immortalized Cell Line Market, by Method
Immortalized Cell Line Market, by Application
Immortalized Cell Line Market, by End-user
11 Competitive Landscape
11.1 Company Market Share Analysis 98
11.1.1 Introduction 98
11.2 Competitive Landscape 99
11.2.1 Introduction 99
11.3 Key Developments 100
12 Company Profiles
12.1 Thermo Fisher Scientific 102
12.1.1 Company Overview 102
12.1.2 Financial Overview 102
12.1.3 Products Offered 103
12.1.4 Key Developments 103
12.1.5 SWOT Analysis 103
12.1.6 Key Strategies 104
12.2 ATCC (American Type Culture Collection Inc.) 105
12.2.1 Company Overview 105
12.2.2 Financial Overview 105
12.2.3 Products Offered 105
12.2.4 Key Developments 106
12.2.5 SWOT Analysis 107
12.2.6 Key Strategies 107
12.3 Valneva 108
12.3.1 Company Overview 108
12.3.2 Financial Overview 108
12.3.3 Products Offered 108
12.3.4 1.3.4 Key Developments 109
12.3.5 SWOT Analysis 109
12.3.6 Key Strategies 109
12.4 Sartorius AG 110
12.4.1 Company Overview 110
12.4.2 Financial Overview 110
12.4.3 Products Offered 111
12.4.4 Key Developments 111
12.4.5 SWOT Analysis 111
12.4.6 Key Strategies 111
12.5 Lonza Group, AG 112
12.5.1 Company Overview 112
12.5.2 Financial Overview 112
12.5.3 Products Offered 112
12.5.4 Key Developments 113
12.5.5 Swot Analysis 113
12.5.6 Key Strategies 113
12.6 Merck KGaA 114
12.6.1 Company Overview 114
12.6.2 Financial Overview 114
12.6.3 Products Offered 115
12.6.4 Key Developments 115
12.6.5 SWOT Analysis 115
12.6.6 Key Strategies 115
12.7 Selexis SA 116
12.7.1 Company Overview 116
12.7.2 Financial Overview 116
12.7.3 Products Offered 116
12.7.4 Key Developments 116
12.7.5 SWOT Analysis 117
12.7.6 Key Strategies 117
12.8 Wuxi App Tec 118
12.8.1 Company Overview 118
12.8.2 Financial Overview 118
12.8.3 Products Offered 119
12.8.4 Key Developments 119
12.8.5 SWOT Analysis 119
12.8.6 Key Strategies 119
12.9 European Collection of Authenticated Cell Cultures (ECACC) 120
12.9.1 Company Overview 120
12.9.2 Financial Overview 120
12.9.3 Products Offered 120
12.9.4 Key Developments 120
12.9.5 SWOT Analysis 121
12.9.6 Key Strategies 121
12.10 Corning Incorporated 122
12.10.1 Company Overview 122
12.10.2 Financial Overview 122
12.10.3 Products Offered 123
12.10.4 Key Developments 123
12.10.5 SWOT Analysis 123
12.10.6 Key Strategies 123
13 Appendix
13.1 Discussion Blue Print 125
14 List of Tables
TABLE 1 MARKET SYNOPSIS 17
TABLE 2 LIST OF ASSUMPTIONS 19
TABLE 3 GLOBAL IMMORTALIZED CELL LINE MARKET, BY METHOD 2020–2027 (USD MILLION) 36
TABLE 4 GLOBAL IMMORTALIZED CELL LINE MARKET FOR VIRUS INDUCTION, BY TYPE 2020–2027 (USD MILLION) 37
TABLE 5 GLOBAL IMMORTALIZED CELL LINE MARKET FOR HTERT EXPRESSION, BY TYPE 2020–2027 (USD MILLION) 37
TABLE 6 GLOBAL IMMORTALIZED CELL LINE MARKET FOR VIRUS INDUCTION, BY REGION 2020–2027 (USD MILLION) 38
TABLE 7 GLOBAL IMMORTALIZED CELL LINE MARKET FOR HTERT EXPRESSION, BY REGION 2020–2027 (USD MILLION) 39
TABLE 8 GLOBAL IMMORTALIZED CELL LINE MARKET FOR INACTIVATION OF TUMOUR SUPPRESSION GENES, BY REGION 2020–2027 (USD MILLION) 40
TABLE 9 GLOBAL IMMORTALIZED CELL LINE MARKET, BY APPLICATION 2020–2027 (USD MILLION) 42
TABLE 10 GLOBAL IMMORTALIZED CELL LINE MARKET FOR DIAGNOSTICS, BY REGION 2020–2027 (USD MILLION) 43
TABLE 11 GLOBAL IMMORTALIZED CELL LINE MARKET FOR DRUG DISCOVERY, BY REGION 2020–2027 (USD MILLION) 43
TABLE 12 GLOBAL IMMORTALIZED CELL LINE MARKET FOR VACCINE PRODUCTION, BY REGION 2020–2027 (USD MILLION) 44
TABLE 13 GLOBAL IMMORTALIZED CELL LINE MARKET FOR TISSUE ENGINEERING & REGENERATIVE MEDICINE, BY REGION 2020–2027 (USD MILLION) 45
TABLE 14 GLOBAL IMMORTALIZED CELL LINE MARKET, BY END-USERS 2020–2027 (USD MILLION) 47
TABLE 15 GLOBAL IMMORTALIZED CELL LINE MARKET FOR PHARMACEUTICAL AND BIOPHARMACEUTICAL COMPANIES, BY REGION 2020–2027 (USD MILLION) 48
TABLE 16 GLOBAL IMMORTALIZED CELL LINE MARKET FOR CONTRACT RESEARCH ORGANIZATIONS, BY REGION 2020–2027 (USD MILLION) 48
TABLE 17 GLOBAL IMMORTALIZED CELL LINE MARKET FOR RESEARCH LABORATORIES, BY REGION 2020–2027 (USD MILLION) 49
TABLE 18 GLOBAL IMMORTALIZED CELL LINE MARKET, BY REGION 2020–2027 (USD MILLION) 51
TABLE 19 GLOBAL IMMORTALIZED CELL LINE MARKET, BY REGION 2020 & 2027 (USD MILLION) 51
TABLE 20 AMERICAS IMMORTALIZED CELL LINE MARKET, BY REGION 2020–2027 (USD MILLION) 52
TABLE 21 AMERICAS IMMORTALIZED CELL LINE MARKET, BY METHOD 2020–2027 (USD MILLION) 53
TABLE 22 AMERICAS IMMORTALIZED CELL LINE MARKET FOR VIRUS INDUCTION, BY TYPE 2020–2027 (USD MILLION) 53
TABLE 23 AMERICAS IMMORTALIZED CELL LINE MARKET FOR HTERT EXPRESSION, BY TYPE 2020–2027 (USD MILLION) 53
TABLE 24 AMERICAS IMMORTALIZED CELL LINE MARKET, BY APPLICATION 2020–2027 (USD MILLION) 54
TABLE 25 AMERICAS IMMORTALIZED CELL LINE MARKET, BY END-USERS 2020–2027 (USD MILLION) 54
TABLE 26 NORTH AMERICAS IMMORTALIZED CELL LINE MARKET, BY COUNTRY 2020–2027 (USD MILLION) 54
TABLE 27 NORTH AMERICAS IMMORTALIZED CELL LINE MARKET, BY METHOD 2020–2027 (USD MILLION) 55
TABLE 28 NORTH AMERICAS IMMORTALIZED CELL LINE MARKET FOR VIRUS INDUCTION, BY TYPE 2020–2027 (USD MILLION) 55
TABLE 29 NORTH AMERICAS IMMORTALIZED CELL LINE MARKET FOR HTERT EXPRESSION, BY TYPE 2020–2027 (USD MILLION) 56
TABLE 30 NORTH AMERICAS IMMORTALIZED CELL LINE MARKET, BY APPLICATION 2020–2027 (USD MILLION) 56
TABLE 31 NORTH AMERICAS IMMORTALIZED CELL LINE MARKET, BY END-USER 2020–2027 (USD MILLION) 56
TABLE 32 US IMMORTALIZED CELL LINE MARKET, BY METHOD 2020–2027 (USD MILLION) 57
TABLE 33 US IMMORTALIZED CELL LINE MARKET FOR VIRUS INDUCTION, BY TYPE 2020–2027 (USD MILLION) 57
TABLE 34 US IMMORTALIZED CELL LINE MARKET FOR HTERT EXPRESSION, BY TYPE 2020–2027 (USD MILLION) 57
TABLE 35 US IMMORTALIZED CELL LINE MARKET, BY APPLICATION 2020–2027 (USD MILLION) 58
TABLE 36 US IMMORTALIZED CELL LINE MARKET, BY END-USER 2020–2027 (USD MILLION) 58
TABLE 37 CANADA IMMORTALIZED CELL LINE MARKET, BY METHOD 2020–2027 (USDMILLION) 58
TABLE 38 CANADA IMMORTALIZED CELL LINE MARKET FOR VIRCANADA INDUCTION, BY TYPE 2020–2027 (USDMILLION) 59
TABLE 39 CANADA IMMORTALIZED CELL LINE MARKET FOR HTERT EXPRESSION, BY TYPE 2020–2027 (USDMILLION) 59
TABLE 40 CANADA IMMORTALIZED CELL LINE MARKET, BY APPLICATION 2020–2027 (USDMILLION) 59
TABLE 41 CANADA IMMORTALIZED CELL LINE MARKET, BY END-USER 2020–2027 (USDMILLION) 60
TABLE 42 SOUTH AMERICA IMMORTALIZED CELL LINE MARKET, BY METHOD 2020–2027 (USD MILLION) 60
TABLE 43 SOUTH AMERICA IMMORTALIZED CELL LINE MARKET FOR VIRSOUTH AMERICA INDUCTION, BY TYPE 2020–2027 (USD MILLION) 60
TABLE 44 SOUTH AMERICA IMMORTALIZED CELL LINE MARKET FOR HTERT EXPRESSION, BY TYPE 2020–2027 (USD MILLION) 61
TABLE 45 SOUTH AMERICA IMMORTALIZED CELL LINE MARKET, BY APPLICATION 2020–2027 (USD MILLION) 61
TABLE 46 SOUTH AMERICA IMMORTALIZED CELL LINE MARKET, BY END-USER 2020–2027 (USD MILLION) 61
TABLE 47 EUROPE IMMORTALIZED CELL LINE MARKET, BY REGION 2020–2027 (USD MILLION) 62
TABLE 48 EUROPE IMMORTALIZED CELL LINE MARKET, BY METHOD 2020–2027 (USD MILLION) 63
TABLE 49 EUROPE IMMORTALIZED CELL LINE MARKET FOR VIRUS INDUCTION, BY TYPE 2020–2027 (USD MILLION) 63
TABLE 50 EUROPE IMMORTALIZED CELL LINE MARKET FOR HTERT EXPRESSION, BY TYPE 2020–2027 (USD MILLION) 63
TABLE 51 EUROPE IMMORTALIZED CELL LINE MARKET, BY APPLICATION 2020–2027 (USD MILLION) 64
TABLE 52 EUROPE IMMORTALIZED CELL LINE MARKET, BY END USERS 2020–2027 (USD MILLION) 64
TABLE 53 WESTERN EUROPE: IMMORTALIZED CELL LINE MARKET, BY COUNTRY, 2020–2027 (USD MILLION) 65
TABLE 54 WESTERN EUROPE IMMORTALIZED CELL LINE MARKET, BY METHOD 2020–2027 (USD MILLION) 65
TABLE 55 WESTERN EUROPE IMMORTALIZED CELL LINE MARKET FOR VIRUS INDUCTION, BY TYPE 2020–2027 (USD MILLION) 66
TABLE 56 WESTERN EUROPE IMMORTALIZED CELL LINE MARKET FOR HTERT EXPRESSION, BY TYPE 2020–2027 (USD MILLION) 66
TABLE 57 WESTERN EUROPE IMMORTALIZED CELL LINE MARKET, BY APPLICATION 2020–2027 (USD MILLION) 66
TABLE 58 WESTERN EUROPE IMMORTALIZED CELL LINE MARKET, BY END USERS 2020–2027 (USD MILLION) 67
TABLE 59 GERMANY IMMORTALIZED CELL LINE MARKET, BY METHOD 2020–2027 (USD MILLION) 67
TABLE 60 GERMANY IMMORTALIZED CELL LINE MARKET FOR VIRUS INDUCTION, BY TYPE 2020–2027 (USD MILLION) 67
TABLE 61 GERMANY IMMORTALIZED CELL LINE MARKET FOR HTERT EXPRESSION, BY TYPE 2020–2027 (USD MILLION) 68
TABLE 62 GERMANY IMMORTALIZED CELL LINE MARKET, BY APPLICATION 2020–2027 (USD MILLION) 68
TABLE 63 GERMANY IMMORTALIZED CELL LINE MARKET, BY END USERS 2020–2027 (USD MILLION) 68
TABLE 64 FRANCE IMMORTALIZED CELL LINE MARKET, BY METHOD 2020–2027 (USD MILLION) 69
TABLE 65 FRANCE IMMORTALIZED CELL LINE MARKET FOR VIRUS INDUCTION, BY TYPE 2020–2027 (USD MILLION) 69
TABLE 66 FRANCE IMMORTALIZED CELL LINE MARKET FOR HTERT EXPRESSION, BY TYPE 2020–2027 (USD MILLION) 69
TABLE 67 FRANCE IMMORTALIZED CELL LINE MARKET, BY APPLICATION 2020–2027 (USD MILLION) 70
TABLE 68 FRANCE IMMORTALIZED CELL LINE MARKET, BY END USERS 2020–2027 (USD MILLION) 70
TABLE 69 U.K IMMORTALIZED CELL LINE MARKET, BY METHOD 2020–2027 (USD MILLION) 71
TABLE 70 U.K IMMORTALIZED CELL LINE MARKET FOR VIRUS INDUCTION, BY TYPE 2020–2027 (USD MILLION) 71
TABLE 71 U.K IMMORTALIZED CELL LINE MARKET FOR HTERT EXPRESSION, BY TYPE 2020–2027 (USD MILLION) 71
TABLE 72 U.K IMMORTALIZED CELL LINE MARKET, BY APPLICATION 2020–2027 (USD MILLION) 72
TABLE 73 U.K IMMORTALIZED CELL LINE MARKET, BY END USERS 2020–2027 (USD MILLION) 72
TABLE 74 ITALY IMMORTALIZED CELL LINE MARKET, BY METHOD 2020–2027 (USD MILLION) 73
TABLE 75 ITALY IMMORTALIZED CELL LINE MARKET FOR VIRUS INDUCTION, BY TYPE 2020–2027 (USD MILLION) 73
TABLE 76 ITALY IMMORTALIZED CELL LINE MARKET FOR HTERT EXPRESSION, BY TYPE 2020–2027 (USD MILLION) 73
TABLE 77 ITALY IMMORTALIZED CELL LINE MARKET, BY APPLICATION 2020–2027 (USD MILLION) 74
TABLE 78 ITALY IMMORTALIZED CELL LINE MARKET, BY END USERS 2020–2027 (USD MILLION) 74
TABLE 79 SPAIN IMMORTALIZED CELL LINE MARKET, BY METHOD 2020–2027 (USD MILLION) 75
TABLE 80 SPAIN IMMORTALIZED CELL LINE MARKET FOR VIRUS INDUCTION, BY TYPE 2020–2027 (USD MILLION) 75
TABLE 81 SPAIN IMMORTALIZED CELL LINE MARKET FOR HTERT EXPRESSION, BY TYPE 2020–2027 (USD MILLION) 75
TABLE 82 SPAIN IMMORTALIZED CELL LINE MARKET, BY APPLICATION 2020–2027 (USD MILLION) 76
TABLE 83 SPAIN IMMORTALIZED CELL LINE MARKET, BY END USERS 2020–2027 (USD MILLION) 76
TABLE 84 REST OF WESTERN EUROPE IMMORTALIZED CELL LINE MARKET, BY METHOD 2020–2027 (USD MILLION) 76
TABLE 85 REST OF WESTERN EUROPE IMMORTALIZED CELL LINE MARKET FOR VIRUS INDUCTION, BY TYPE 2020–2027 (USD MILLION) 77
TABLE 86 REST OF WESTERN EUROPE IMMORTALIZED CELL LINE MARKET FOR HTERT EXPRESSION, BY TYPE 2020–2027 (USD MILLION) 77
TABLE 87 REST OF WESTERN EUROPE IMMORTALIZED CELL LINE MARKET, BY APPLICATION 2020–2027 (USD MILLION) 77
TABLE 88 REST OF WESTERN EUROPE IMMORTALIZED CELL LINE MARKET, BY END USERS 2020–2027 (USD MILLION) 78
TABLE 89 EASTERN EUROPE IMMORTALIZED CELL LINE MARKET, BY METHOD 2020–2027 (USD MILLION) 78
TABLE 90 EASTERN EUROPE IMMORTALIZED CELL LINE MARKET FOR VIRUS INDUCTION, BY TYPE 2020–2027 (USD MILLION) 78
TABLE 91 EASTERN EUROPE IMMORTALIZED CELL LINE MARKET FOR HTERT EXPRESSION, BY TYPE 2020–2027 (USD MILLION) 79
TABLE 92 EASTERN EUROPE IMMORTALIZED CELL LINE MARKET, BY APPLICATION 2020–2027 (USD MILLION) 79
TABLE 93 EASTERN EUROPE IMMORTALIZED CELL LINE MARKET, BY END USERS 2020–2027 (USD MILLION) 79
TABLE 94 ASIA PACIFIC: IMMORTALIZED CELL LINE MARKET, BY COUNTRY, 2020–2027 (USD MILLION) 80
TABLE 95 ASIA-PACIFIC IMMORTALIZED CELL LINE MARKET, BY METHOD 2020–2027 (USD MILLION) 81
TABLE 96 ASIA-PACIFIC IMMORTALIZED CELL LINE MARKET FOR VIRUS INDUCTION, BY TYPE 2020–2027 (USD MILLION) 81
TABLE 97 ASIA-PACIFIC IMMORTALIZED CELL LINE MARKET FOR HTERT EXPRESSION, BY TYPE 2020–2027 (USD MILLION) 81
TABLE 98 ASIA-PACIFIC IMMORTALIZED CELL LINE MARKET, BY APPLICATION 2020–2027 (USD MILLION) 82
TABLE 99 ASIA-PACIFIC IMMORTALIZED CELL LINE MARKET, BY END USERS 2020–2027 (USD MILLION) 82
TABLE 100 JAPAN IMMORTALIZED CELL LINE MARKET, BY METHOD 2020–2027 (USD MILLION) 82
TABLE 101 JAPAN IMMORTALIZED CELL LINE MARKET FOR VIRUS INDUCTION, BY TYPE 2020–2027 (USD MILLION) 83
TABLE 102 JAPAN IMMORTALIZED CELL LINE MARKET FOR HTERT EXPRESSION, BY TYPE 2020–2027 (USD MILLION) 83
TABLE 103 JAPAN IMMORTALIZED CELL LINE MARKET, BY APPLICATION 2020–2027 (USD MILLION) 83
TABLE 104 JAPAN IMMORTALIZED CELL LINE MARKET, BY END USERS 2020–2027 (USD MILLION) 84
TABLE 105 CHINA IMMORTALIZED CELL LINE MARKET, BY METHOD 2020–2027 (USD MILLION) 84
TABLE 106 CHINA IMMORTALIZED CELL LINE MARKET FOR VIRUS INDUCTION, BY TYPE 2020–2027 (USD MILLION) 84
TABLE 107 CHINA IMMORTALIZED CELL LINE MARKET FOR HTERT EXPRESSION, BY TYPE 2020–2027 (USD MILLION) 85
TABLE 108 CHINA IMMORTALIZED CELL LINE MARKET, BY APPLICATION 2020–2027 (USD MILLION) 85
TABLE 109 CHINA IMMORTALIZED CELL LINE MARKET, BY END USERS 2020–2027 (USD MILLION) 85
TABLE 110 INDIA IMMORTALIZED CELL LINE MARKET, BY METHOD 2020–2027 (USD MILLION) 86
TABLE 111 INDIA IMMORTALIZED CELL LINE MARKET FOR VIRUS INDUCTION, BY TYPE 2020–2027 (USD MILLION) 86
TABLE 112 INDIA IMMORTALIZED CELL LINE MARKET FOR HTERT EXPRESSION, BY TYPE 2020–2027 (USD MILLION) 86
TABLE 113 INDIA IMMORTALIZED CELL LINE MARKET, BY APPLICATION 2020–2027 (USD MILLION) 87
TABLE 114 INDIA IMMORTALIZED CELL LINE MARKET, BY END USERS 2020–2027 (USD MILLION) 87
TABLE 115 SOUTH KOREA IMMORTALIZED CELL LINE MARKET, BY METHOD 2020–2027 (USD MILLION) 87
TABLE 116 SOUTH KOREA IMMORTALIZED CELL LINE MARKET FOR VIRUS INDUCTION, BY TYPE 2020–2027 (USD MILLION) 88
TABLE 117 SOUTH KOREA IMMORTALIZED CELL LINE MARKET FOR HTERT EXPRESSION, BY TYPE 2020–2027 (USD MILLION) 88
TABLE 118 SOUTH KOREA IMMORTALIZED CELL LINE MARKET, BY APPLICATION 2020–2027 (USD MILLION) 88
TABLE 119 SOUTH KOREA IMMORTALIZED CELL LINE MARKET, BY END USERS 2020–2027 (USD MILLION) 89
TABLE 120 REST OF ASIA-PACIFIC IMMORTALIZED CELL LINE MARKET, BY METHOD 2020–2027 (USD MILLION) 89
TABLE 121 REST OF ASIA-PACIFIC IMMORTALIZED CELL LINE MARKET FOR VIRUS INDUCTION, BY TYPE 2020–2027 (USD MILLION) 89
TABLE 122 REST OF ASIA-PACIFIC IMMORTALIZED CELL LINE MARKET FOR HTERT EXPRESSION, BY TYPE 2020–2027 (USD MILLION) 90
TABLE 123 REST OF ASIA-PACIFIC IMMORTALIZED CELL LINE MARKET, BY APPLICATION 2020–2027 (USD MILLION) 90
TABLE 124 REST OF ASIA-PACIFIC IMMORTALIZED CELL LINE MARKET, BY END USERS 2020–2027 (USD MILLION) 90
TABLE 125 MIDDLE EAST AND AFRICA: IMMORTALIZED CELL LINE MARKET, BY REGION, 2020–2027 (USD MILLION) 91
TABLE 126 MIDDLE EAST AND AFRICA IMMORTALIZED CELL LINE MARKET, BY METHOD 2020–2027 (USD MILLION) 92
TABLE 127 MIDDLE EAST AND AFRICA IMMORTALIZED CELL LINE MARKET FOR VIRUS INDUCTION, BY TYPE 2020–2027 (USD MILLION) 92
TABLE 128 MIDDLE EAST AND AFRICA IMMORTALIZED CELL LINE MARKET FOR HTERT EXPRESSION, BY TYPE 2020–2027 (USD MILLION) 92
TABLE 129 MIDDLE EAST AND AFRICA IMMORTALIZED CELL LINE MARKET, BY APPLICATION 2020–2027 (USD MILLION) 93
TABLE 130 MIDDLE EAST AND AFRICA IMMORTALIZED CELL LINE MARKET, BY END USERS 2020–2027 (USD MILLION) 93
TABLE 131 MIDDLE EAST IMMORTALIZED CELL LINE MARKET, BY METHOD 2020–2027 (USD MILLION) 93
TABLE 132 MIDDLE EAST IMMORTALIZED CELL LINE MARKET FOR VIRUS INDUCTION, BY TYPE 2020–2027 (USD MILLION) 94
TABLE 133 MIDDLE EAST IMMORTALIZED CELL LINE MARKET FOR HTERT EXPRESSION, BY TYPE 2020–2027 (USD MILLION) 94
TABLE 134 MIDDLE EAST IMMORTALIZED CELL LINE MARKET, BY APPLICATION 2020–2027 (USD MILLION) 94
TABLE 135 MIDDLE EAST IMMORTALIZED CELL LINE MARKET, BY END USERS 2020–2027 (USD MILLION) 95
TABLE 136 AFRICA IMMORTALIZED CELL LINE MARKET, BY METHOD 2020–2027 (USD MILLION) 95
TABLE 137 AFRICA IMMORTALIZED CELL LINE MARKET FOR VIRUS INDUCTION, BY TYPE 2020–2027 (USD MILLION) 95
TABLE 138 AFRICA IMMORTALIZED CELL LINE MARKET FOR HTERT EXPRESSION, BY TYPE 2020–2027 (USD MILLION) 96
TABLE 139 AFRICA IMMORTALIZED CELL LINE MARKET, BY APPLICATION 2020–2027 (USD MILLION) 96
TABLE 140 AFRICA IMMORTALIZED CELL LINE MARKET, BY END USERS 2020–2027 (USD MILLION) 96
TABLE 141 GLOBAL IMMORTALIZED CELL LINE MARKET: KEY DEVELOPMENTS 100
15 List of Figures
FIGURE 1 GLOBAL IMMORTALIZED CELL LINE MARKET: MARKET STRUCTURE 20
FIGURE 2 RESEARCH PROCESS OF MRFR 22
FIGURE 3 TOP-DOWN & BOTTOM-UP APPROACH 25
FIGURE 4 PORTERS FIVE FORCES ANALYSIS OF GLOBAL IMMORTALIZED CELL LINE MARKET 32
FIGURE 5 SUPPLY CHAIN: GLOBAL IMMORTALIZED CELL LINE MARKET 33
FIGURE 6 GLOBAL IMMORTALIZED CELL LINE MARKET, BY METHOD 2020 & 2027 (USD MILLION) 36
FIGURE 7 GLOBAL IMMORTALIZED CELL LINE MARKET, BY APPLICATION 2020 & 2027 (USD MILLION) 42
FIGURE 8 GLOBAL IMMORTALIZED CELL LINE MARKET, BY END-USERS 2020 & 2027 (USD MILLION) 47
FIGURE 9 AMERICAS IMMORTALIZED CELL LINE MARKET, BY REGION 2020 (%) 52
FIGURE 10 NORTH AMERICAS IMMORTALIZED CELL LINE MARKET, BY REGION 2020 (%) 55
FIGURE 11 EUROPE: IMMORTALIZED CELL LINE MARKET SHARE, BY REGION, 2020 (% SHARE) 62
FIGURE 12 WESTERN EUROPE: IMMORTALIZED CELL LINE MARKET, BY COUNTRY, 2020 (%) 65
FIGURE 13 ASIA PACIFIC: IMMORTALIZED CELL LINE MARKET SHARE, BY COUNTRY, 2020 (%) 80
FIGURE 14 THE MIDDLE EAST AND AFRICA: IMMORTALIZED CELL LINE MARKET SHARE, BY REGION, 2020 (%) 91
FIGURE 15 GLOBAL IMMORTALIZED CELL LINE MARKET, MARKET SHARE ANALYSIS 2020 (%) 98
FIGURE 16 GLOBAL IMMORTALIZED CELL LINE MARKET COMPETITIVE LANDSCAPE (%) 99
Global Immortalized Cell Line Market: Competitive Landscape
Lonza Group AG, Corning Incorporated, Thermo Fisher Scientific, and Selexis SA collectively accounted for more than 65.1% of the market share of the global immortalized cell line market in 2017. These companies continue to retain their strong global presence through expansions, mergers & acquisitions, and agreements.
In 2017, Lonza Group AG was the leading player in the market. The company pursued a strategy of acquisitions and expansions to strengthen its position in the global market. The company leverages its expertise in pharmaceuticals and biotech and specialty ingredients to develop new products. The company has a strong foothold with more than 100 sites and offices and approximately 14,500 full-time employees worldwide. Its dominance is likely to remain unchallenged during the assessment period.
Corning Incorporated held the second position in terms of market share, in 2017. It focuses on its strategic decision to work on flexible business models to enable customized solutions to satisfy the unique needs of clients. The company is the innovator in medical science, with expertise in glass science, ceramic science, and optical physics. The company has its research centers in North America, Europe, and Asia. The firm has its products manufactured in over 17 countries. Moreover, it also works in the segment that provides innovative solutions, improving improve productivity and enabling breakthrough discoveries in life science division.
Thermo Fisher Scientific acquired the third spot in the market. The company is focused on technically magnificent products and skilled workforce, which assists its customers to accelerate life science research as well as getting better outcomes in challenging clinical research fields. It also focusses on the pricing of products to provide attractive volume expansion opportunities. The company has adopted the strategy of acquisitions to increase its share in the market. For this, the company acquired Patheon for USD 7.2 million. Patheon’s CDMO services are likely to complement Thermo Fisher Scientific’s life sciences technologies designed to support research, clinical trials, and production.
Selexis SA is one of the most competitive players in this market. The company is engaged in providing mammalian cell-line generation technologies to facilitate the development and translation of new therapies into life-saving medicines. Additionally, the company provides cell-line development, lead identification, and genomic characterization services. The company focuses on providing breakthrough technologies fundamentally impacting and improving drug discovery, drug development, and biopharmaceutical manufacturing.
In the near future, the strategies to gain a significant market share in this growing industry have been varying from acquisitions and agreements to expansions. The established companies are busy in acquiring companies and entering into the agreement with other ecosystem players. Acquisitions are a key focus area for players as the demand for cost-effective and efficient immortal cell lines for numerous applications such as drug discovery, vaccine production, diagnosis, and tissue regeneration, among others is growing rapidly. This surges the growth of the global immortalized cell line market.