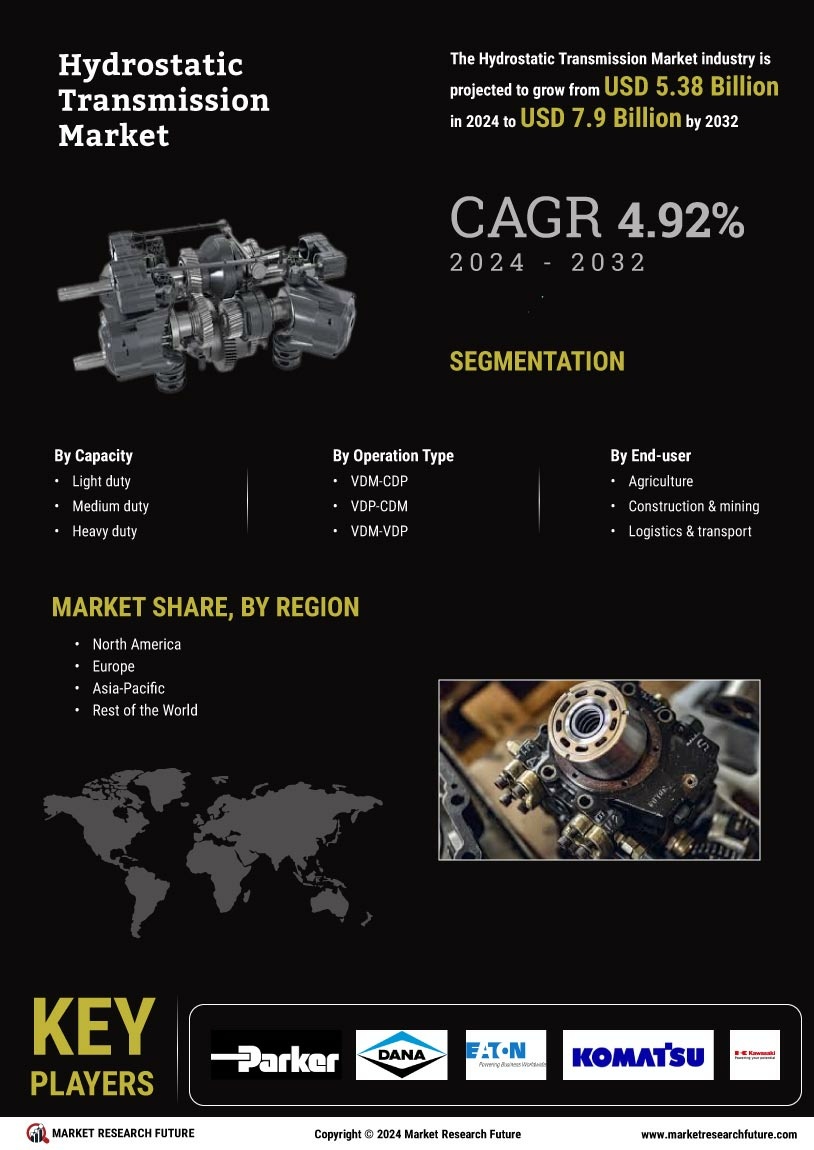
Table Of Contents
1 Executive Summary
1.1 Global Hydrostatic Transmission Market, By Capacity
1.2 Global Hydrostatic Transmission Market, By Operation Type
1.3 Global Hydrostatic Transmission Market, By End User
1.4 Global Hydrostatic Transmission Market, By Region
2 Market Introduction
2.1 Definition
2.2 Scope Of The Study
2.3 Market Structure
3 Research Methodology
3.1 Research Process
3.2 Primary Research
3.3 Secondary Research
3.4 Market Size Estimation
3.5 Top Down & Bottom-Up Approach
3.6 Forecast Model
3.7 List Of Assumptions
4 Market Dynamics
4.1 Introduction
4.2 Drivers
4.2.1 Rising Collaboration And Acquisitions Among Key Players
4.2.2 Growing Demand From End-User Industries
4.2.3 Drivers Impact Analysis
4.3 Restraints
4.3.1 High Cost Of Hydrostatic Transmission Equipment
4.3.2 Restraints Impact Analysis
4.4 Opportunities
4.4.1 Growing Demand From Automotive Industry
4.5 Impact Of Covid-19 On Global Economy
4.6 Impact Of Covid-19 On The Global Hydrostatic Transmission Market
4.7 Supply Chain Impact
4.7.1 Impact On Manufacturer/Developer
4.7.2 Impact On Component/Services Supplier
4.7.3 Impact On Distribution/Logistics
5 Market Factor Analysis
5.1 Supply/Value Chain Analysis
5.1.1 R&D
5.1.2 Manufacturing& Assembly
5.1.3 Distribution & Sales
5.1.4 Post-Sales Monitoring
5.2 Porter’s Five Forces Model
5.2.1 Threat Of New Entrants
5.2.2 Bargaining Power Of Suppliers
5.2.3 Bargaining Power Of Buyers
5.2.4 Threat Of Substitutes
5.2.5 Intensity Of Rivalry
6 Global Hydrostatic Transmission Market, By Capacity
6.1 Overview
6.2 Global Hydrostatic Transmission Market Size, Market Estimates & Forecast By Capacity, 2023-2032
6.2.1 Global Hydrostatic Transmission Market Size: Market Estimates & Forecast By Capacity, 2023-2032
7 Global Hydrostatic Transmission Market, By Operation Type
7.1 Overview
7.2 Global Hydrostatic Transmission Market Size, Market Estimates & Forecast By Operation Type, 2023-2032
7.2.1 Global Hydrostatic Transmission Market Size: Market Estimates & Forecast By Operation Type, 2023-2032
8 Global Hydrostatic Transmission Market, By End User
8.1 Overview
8.2 Global Hydrostatic Transmission Market Size, Market Estimates & Forecast By End User, 2023-2032
8.2.1 Global Hydrostatic Transmission Market Size: Market Estimates & Forecast By End User, 2023-2032
9 Global Drone Logistics And Transporation Market, By Region
9.1 Overview
9.2 North America
9.2.1 U.S.
9.2.2 Canada
9.2.3 Mexico
9.3 Europe
9.3.1 Germany
9.3.2 France
9.3.3 Uk
9.3.4 Italy
9.3.5 Spain
9.3.6 Rest Of Europe
9.4 Asia Pacific
9.4.1 China
9.4.2 India
9.4.3 Japan
9.4.4 Rest Of Asia Pacific
9.5 Middle East & Africa
9.5.1 Saudi Arabia
9.5.2 Uae
9.5.3 South Africa
9.5.4 Rest Of Middle East & Africa
9.6 South America
9.6.1 Brazil
9.6.2 Argentina
9.6.3 Rest Of South America
10 Competitive Landscape
10.1 Competitiveoverview
10.2 Competitive Benchmarking
10.3 Major Players In The Global Hydrostatic Transmission Market
10.4 Major Growth Strategies In The Global Hydrostatic Transmission Market
10.5 Leading Players In Terms Of The Number Of Developments In The Global Hydrostatic Transmission Market
10.6 Key Developments & Growth Strategies
10.6.1 Contracts And Product Integrations
10.6.2 Product Launch/Product Development/Approval
10.6.3 Expansion
11 Company Profiles
11.1 Parker Hannifin Corporation
11.1.1 Company Overview
11.1.2 Financial Overview
11.1.3 Products Offered
11.1.4 Key Developments
11.1.5 Swot Analysis
11.1.6 Key Strategies
11.2 Dana Incorporated
11.2.1 Company Overview
11.2.2 Financial Overview
11.2.3 Products Offered
11.2.4 Key Developments
11.2.5 Swot Analysis
11.2.6 Key Strategies
11.3 Eaton
11.3.1 Company Overview
11.3.2 Financial Overview
11.3.3 Products/Services Offered
11.3.4 Key Developments
11.3.5 Swot Analysis
11.3.6 Key Strategies
11.4 Komatsu America Corp.
11.4.1 Company Overview
11.4.2 Financial Overview
11.4.3 Products/Services Offered
11.4.4 Key Developments
11.4.5 Swot Analysis
11.4.6 Key Strategies
11.5 Kawasaki Heavy Industries, Ltd.
11.5.1 Company Overview
11.5.2 Financial Overview
11.5.3 Products/Services Offered
11.5.4 Key Developments
11.5.5 Swot Analysis
11.5.6 Key Strategies
11.6 Tuff Torq Corporation
11.6.1 Company Overview
11.6.2 Financial Overview
11.6.3 Products/Services Offered
11.6.4 Key Developments
11.6.5 Swot Analysis
11.6.6 Key Strategies
11.7 Robert Bosch Gmbh
11.7.1 Company Overview
11.7.2 Financial Overview
11.7.3 Products/Services Offered
11.7.4 Key Developments
11.7.5 Swot Analysis
11.7.6 Key Strategies
11.8 Royal Dutch Shell
11.8.1 Company Overview
11.8.2 Financial Overview
11.8.3 Products/Services Offered
11.8.4 Key Developments
11.8.5 Swot Analysis
11.8.6 Key Strategies
11.9 Totalenergies
11.9.1 Company Overview
11.9.2 Financial Overview
11.9.3 Products/Services Offered
11.9.4 Key Developments
11.9.5 Swot Analysis
11.9.6 Key Strategies
11.10 Idemitsu Kosan
11.10.1 Company Overview
11.10.2 Financial Overview
11.10.3 Products Offered
11.10.4 Key Developments
11.10.5 Swot Analysis
11.10.6 Key Strategies
11.11 Indian Oil Corporation
11.11.1 Company Overview
11.11.2 Financial Overview
11.11.3 Products Offered
11.11.4 Key Developments
11.11.5 Swot Analysis
11.11.6 Key Strategies
12 Appendix
12.1 References
List Of Tables
Table 1 List Of Assumptions
Table 2 Global Hydrostatic Transmission Market Estimates & Forecast, By Capacity, 2023-2032 (Usd Million)
Table 3 Global Hydrostatic Transmission Market Estimates & Forecast, By Operation Type, 2023-2032 (Usd Million)
Table 4 Global Hydrostatic Transmission Market Estimates & Forecast, By End User, 2023-2032 (Usd Million)
Table 5 Global Hydrostatic Transmission Market Size, By Region, 2023-2032 (Usd Million)
Table 6 North America: Hydrostatic Transmission Market Size, By Country, 2023-2032 (Usd Million)
Table 7 North America Hydrostatic Transmission Market Estimates & Forecast, By Capacity, 2023-2032 (Usd Million)
Table 8 North America Hydrostatic Transmission Market Estimates & Forecast, By Operation Type, 2023-2032 (Usd Million)
Table 9 North America Hydrostatic Transmission Market Estimates & Forecast, By End User, 2023-2032 (Usd Million)
Table 10 Us Hydrostatic Transmission Market Estimates & Forecast, By Capacity, 2023-2032 (Usd Million)
Table 11 Us Hydrostatic Transmission Market Estimates & Forecast, By Operation Type, 2023-2032 (Usd Million)
Table 12 Us Hydrostatic Transmission Market Estimates & Forecast, By End User, 2023-2032 (Usd Million)
Table 13 Canada Hydrostatic Transmission Market Estimates & Forecast, By Capacity, 2023-2032 (Usd Million)
Table 14 Canada Hydrostatic Transmission Market Estimates & Forecast, By Operation Type, 2023-2032 (Usd Million)
Table 15 Canada Hydrostatic Transmission Market Estimates & Forecast, By End User, 2023-2032 (Usd Million)
Table 16 Mexico Hydrostatic Transmission Market Estimates & Forecast, By Capacity, 2023-2032 (Usd Million)
Table 17 Mexico Hydrostatic Transmission Market Estimates & Forecast, By Operation Type, 2023-2032 (Usd Million)
Table 18 Mexico Hydrostatic Transmission Market Estimates & Forecast, By End User, 2023-2032 (Usd Million)
Table 19 Europe: Hydrostatic Transmission Market Size, By Country, 2023-2032 (Usd Million)
Table 20 Europe Hydrostatic Transmission Market Estimates & Forecast, By Capacity, 2023-2032 (Usd Million)
Table 21 Europe Hydrostatic Transmission Market Estimates & Forecast, By Operation Type, 2023-2032 (Usd Million)
Table 22 Europe Hydrostatic Transmission Market Estimates & Forecast, By End User, 2023-2032 (Usd Million)
Table 23 Germany Hydrostatic Transmission Market Estimates & Forecast, By Capacity, 2023-2032 (Usd Million)
Table 24 Germany Hydrostatic Transmission Market Estimates & Forecast, By Operation Type, 2023-2032 (Usd Million)
Table 25 Germany Hydrostatic Transmission Market Estimates & Forecast, By E