• Cat-intel
  • MedIntelliX
  • Resources
  • About Us
  • Hero Background
    English
    Chinese
    French
    Japanese
    Korean
    German
    Spanish

    Hydrographic Survey Equipment Market Trends

    ID: MRFR/A&D/8146-HCR
    168 Pages
    Sejal Akre
    October 2025

    Hydrographic Survey Equipment Market Research Report Information by Type (Sensing Systems, Positioning Systems, Subsea Sensors, Software and Unmanned Vehicles), Depth (Shallow Water and Deep Water), Application (Hydrographic Charting, Offshore Oil Gas Survey, Port Harbor Management and Coastal Engineering), End User (Commercial, Research and Defense) and Region (North America, Europe, Asia-Paci...

    Share:
    Download PDF ×

    We do not share your information with anyone. However, we may send you emails based on your report interest from time to time. You may contact us at any time to opt-out.

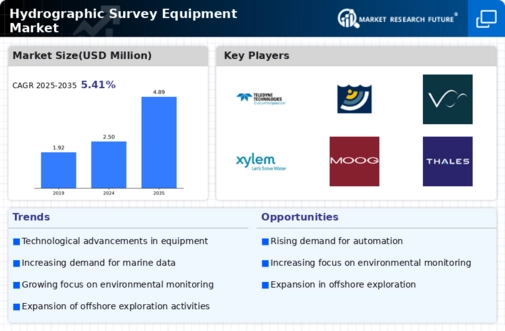
    Hydrographic Survey Equipment Market Infographic
    $ 4,950.0
    $ 5,950.0
    $ 7,250.0

    Market Trends

    Key Emerging Trends in the Hydrographic Survey Equipment Market

    In the Hydrographic Survey Equipment market’s competitive landscape, companies are embarking on strategic initiatives to secure market share and become leaders in offering advanced underwater mapping and surveying solutions. A basic strategy of market positioning is to offer comprehensive and technologically-advanced hydrographic survey equipment. Companies recognize that they have different needs when it comes to surveyors, environmental researchers, and maritime industries; thus, they make their equipment to include high-resolution multibeam as well as single-beam echo sounders, autonomous underwater vehicles (AUVs) among other cutting-edge sensors. This approach makes them versatile providers who can offer precise and efficient data collection solutions while at the same time showing flexibility and expertise in addressing intricate requirements of hydrographic surveys. For instance, strategic partnerships and collaborations play a significant role in market share positioning in Hydrographic Survey Equipment market. Companies realize that underwater mapping projects require collective efforts; hence they are entering into strategic alliances with technology providers, research institutions as well as government agencies. These agreements also foster collaborative strategies such as researches in addition to development projects or knowledge sharing about the latest technologies which facilitate seamless integration of cutting edge features in hydrographic survey equipment products. Such collaborative initiatives boost a company’s position by leveraging on its collective intelligence, resources along with technological capabilities leading successful deployment of innovative surveying solutions across the industry. Moreover, focus on continuous innovation and technological advancement is essential for market share positioning within the Hydrographic Survey Equipment business sector. This is exemplified through investment by businesses into advanced sensors development, employment of artificial intelligent (AI) algorithms together with machine learning (ML) techniques including exploration using unmanned vessels designed for surveys all aimed at ensuring that such firms remain at the forefront of hydrographic surveying technologies. They will also be able to provide innovative features that address emerging challenges along with dynamic requirements inherent in underwater mapping making them leaders providing state-of-the-art solutions towards environmental monitoring; for instance marine infrastructural development and scientific research. Moreover, strategic marketing and communication efforts are key in market share positioning for Hydrographic Survey Equipment. This is how companies effectively sell the values related to their surveying equipment such as precision, efficiency gains or adaptability to diverse environments thus differentiating them from other competitors. In particular, developing targeted marketing campaigns, participating in industry events as well as presenting successful case studies help create a customer base that recognizes the brand among hydrographic survey stakeholders. Therefore, successful marketing strategies position companies as leaders in the Hydrographic Survey Equipment market influencing procurement decisions and capturing significant market shares. Also important for market share positioning is a customer-centric approach. Companies aim at understanding specific needs and challenges facing surveyors, environmental scientists or maritime professions. Thus they customize hydrographic survey equipment to fit underwater mapping specifications while enhancing data accuracy as well as total operational effectiveness thus showing commitment to client satisfaction. Establishing strong relationships with hydrographic survey clients not only fosters brand loyalty but also positions companies as reliable and responsive partners crucial for securing and expanding territories served within this sector. Indicatively, integration of sustainability practices is increasingly becoming an integral element of strategic market share positioning within the Hydrographic Survey Equipment industry. These encompass eco-friendly surveys instruments with less footprints on the environment together with making them using sustainable means which makes those firms become associated with responsible and environmentally friendly surveying activities. By doing this businesses will be able to meet their global sustainability goals thereby addressing environmental concerns besides establishing themselves as leaders providing socially responsible solutions about underwater mapping and surveying. Companies are increasingly acknowledging the need for cybersecurity in hydrographic survey equipment. This is especially important due to increased connectivity and gigabytes of information generated, therefore securing survey data, communication channels and control systems from cyber threats is vital. When companies prioritize strong cybersecurity measures, encryption technologies, and adherence to industry standards, they instill confidence in stakeholders within hydrographic surveys. By focusing on the security of their systems, firms directly address the concerns of the market while positioning themselves as dependable partners in Hydrographic Survey Equipment industry.”

    Market Summary

    As per Market Research Future Analysis, the Global Hydrographic Survey Equipment Market is projected to reach USD 3,760 Million by 2030, registering a CAGR of 5.41% during the forecast period of 2022-2030. The market is driven by increasing maritime trade, demand for accurate nautical charts, and the growing use of Unmanned Underwater Vehicles (UUVs) and Unmanned Surface Vehicles (USVs) for hydrographic surveys. However, stringent regulations, high investment costs, and a lack of technical expertise may hinder growth. The market is segmented by type, depth, application, and end-user, with significant contributions from sensing systems, shallow water surveys, and commercial applications. North America dominated the market in 2019, followed by Europe and Asia-Pacific, which is expected to register the highest CAGR.

    Key Market Trends & Highlights

    Key trends influencing the Hydrographic Survey Equipment Market include advancements in technology and increasing investments in autonomous vessels.

    • Market projected to reach USD 3,760 Million by 2030; CAGR of 5.41% from 2022-2030.
    • Increasing maritime trade and demand for accurate nautical charts driving market growth.
    • UUVs and USVs usage for hydrographic surveys is on the rise.
    • North America held the largest market share in 2019.

    Market Size & Forecast

    Market Size USD 3,760 Million by 2030
    CAGR 5.41% from 2022-2030
    Largest Regional Market Share in 2019 North America
    Highest CAGR Region Asia-Pacific.

    Major Players

    Kongsberg Gruppen ASA, Chesapeake Technology, EdgeTech, Environmental Systems Research Institute, Innomar Technologie GmbH, Ixblue SAS, Mitcham Industries Inc., Saab AB, Sonardyne International Ltd., Teledyne Technologies Inc.

    Market Trends

    The ongoing advancements in hydrographic survey equipment are poised to enhance the precision and efficiency of marine data collection, thereby supporting sustainable ocean management and resource exploration.

    National Oceanic and Atmospheric Administration (NOAA)

    Hydrographic Survey Equipment Market Market Drivers

    Market Growth Projections

    The Global Hydrographic Survey Equipment Market Industry is projected to experience a compound annual growth rate (CAGR) of 6.31% from 2025 to 2035. This growth is indicative of the increasing reliance on hydrographic surveys across various sectors, including marine construction, environmental monitoring, and resource exploration. The market's expansion reflects the ongoing technological advancements and the rising demand for accurate data in marine applications. As stakeholders recognize the value of hydrographic survey equipment in enhancing operational efficiency and safety, the industry is likely to witness sustained growth in the coming years.

    Expansion of Maritime Trade

    The Global Hydrographic Survey Equipment Market Industry is closely linked to the expansion of maritime trade, which necessitates accurate navigation and safety measures. As global trade volumes increase, the demand for reliable hydrographic surveys to ensure safe shipping routes is becoming more pronounced. The growth of container shipping and the development of new trade routes, particularly in emerging markets, are driving investments in hydrographic survey equipment. This trend suggests that the industry will continue to thrive as stakeholders prioritize safety and efficiency in maritime operations, further propelling market growth.

    Rising Environmental Regulations

    The Global Hydrographic Survey Equipment Market Industry is influenced by stringent environmental regulations aimed at protecting marine ecosystems. Governments worldwide are implementing policies that require comprehensive hydrographic surveys before any marine development projects. This regulatory landscape compels developers to invest in high-quality survey equipment to ensure compliance with environmental standards. For example, the need for accurate data to assess the impact of construction on marine habitats is driving the demand for hydrographic survey equipment. Consequently, this trend is expected to bolster market growth as stakeholders prioritize environmental sustainability in their projects.

    Growth in Renewable Energy Projects

    The Global Hydrographic Survey Equipment Market Industry is benefiting from the increasing investment in renewable energy projects, particularly offshore wind and tidal energy. As countries strive to meet their energy needs sustainably, the demand for hydrographic surveys to assess suitable sites for these projects is surging. By 2035, the market is projected to reach 4.89 USD Billion, driven by the need for accurate seabed mapping and environmental assessments. The integration of hydrographic survey equipment in renewable energy initiatives not only supports energy transition efforts but also highlights the industry's pivotal role in facilitating sustainable development.

    Increasing Demand for Marine Infrastructure

    The Global Hydrographic Survey Equipment Market Industry is experiencing heightened demand due to the expansion of marine infrastructure projects. Governments and private entities are investing in ports, harbors, and offshore wind farms, necessitating accurate hydrographic surveys for planning and construction. For instance, the global investment in marine infrastructure is projected to reach 2.5 USD Billion in 2024, reflecting a robust growth trajectory. This surge in infrastructure development underscores the critical role of hydrographic survey equipment in ensuring safety and efficiency in marine operations. As a result, the industry is poised for significant growth, driven by these infrastructural advancements.

    Technological Advancements in Survey Equipment

    Technological innovations are transforming the Global Hydrographic Survey Equipment Market Industry, enhancing the precision and efficiency of data collection. The introduction of advanced sonar systems, autonomous underwater vehicles, and integrated software solutions has revolutionized hydrographic surveying. These technologies allow for real-time data acquisition and processing, which is increasingly essential for modern marine applications. As organizations seek to improve operational efficiency, the demand for state-of-the-art hydrographic survey equipment is likely to rise. This trend indicates a shift towards more sophisticated tools that can meet the evolving needs of the industry, potentially driving market growth significantly.

    Market Segment Insights

    Regional Insights

    Key Companies in the Hydrographic Survey Equipment Market market include

    Industry Developments

      • Focus on Unmanned Vehicles (AUVs & USVs): There's a strong push towards autonomous solutions. Companies like Kongsberg Maritime, Teledyne Marine, and IXblue are investing heavily in developing advanced AUVs and USVs for efficient and cost-effective data collection.

      • Integration and Software Advancements: Several players like Teledyne Technologies, Kongsberg Maritime, and Thales are focusing on integrated solutions that combine hardware, software, and data analytics for improved data processing, visualization, and decision-making.

      • Strategic Partnerships: Key players are collaborating for wider market reach and expertise. For instance, partnerships between sensor manufacturers and software developers are creating more comprehensive solutions.

      • Sustainability Initiatives: Companies are incorporating eco-friendly designs and energy-efficient technologies in their equipment. This aligns with growing environmental regulations and customer preferences.

    Future Outlook

    Hydrographic Survey Equipment Market Future Outlook

    The Hydrographic Survey Equipment Market is projected to grow at a 6.31% CAGR from 2024 to 2035, driven by technological advancements and increasing demand for marine data.

    New opportunities lie in:

    • Develop autonomous underwater vehicles for enhanced survey efficiency.
    • Invest in AI-driven data analysis tools for improved accuracy.
    • Expand into emerging markets with tailored hydrographic solutions.

    By 2035, the Hydrographic Survey Equipment Market is expected to achieve substantial growth, reflecting evolving industry needs.

    Market Segmentation

    Report Scope

    Report Attribute/Metric Details
      Market Size   USD 3,760 Million (2030)
      CAGR   5.41% (2022-2030)
      Base Year   2019
      Forecast Period   2028
      Historical Data   2018
      Forecast Units   Value (USD Million)
      Report Coverage   Revenue Forecast, Competitive Landscape, Growth Factors, and Trends
      Segments Covered   Type, Depth, Application
      Geographies Covered   North America, Europe, Asia-Pacific, and Rest of the World (RoW)
      Key Vendors   Kongsberg Gruppen ASA (Norway), Chesapeake Technology (US),EdgeTech (US), Environmental Systems Research Institute, Inc. (ESRI) (US), Innomar Technologie GmbH (Germany), Ixblue SAS (France), Mitcham Industries Inc. (US), Saab AB (Sweden), Sonardyne International Ltd. (UK), Ixblue SAS (France)
      Key Market Opportunities   Increasing investments in autonomous vessels with advanced technologies
      Key Market Drivers ·  Increasing Maritime Trade. ·  A Rise in the Demand for Accurate Nautical Charts. ·  Increasing Use of UUVs and USVs

    Market Highlights

    Author

    Sejal Akre
    Senior Research Analyst

    She holds an experience of about 6+ years in market research and business consulting, working under the spectrum of information communication technology, telecommunications and semiconductor domains. aarti conceptualizes and implements a scalable business strategy and provides strategic leadership to the clients. her expertise lies in market estimation, competitive intelligence, pipeline analysis, customer assessment, etc.

    Leave a Comment

    Latest Comments

    John Doe
    john@example.com

    This is a great article! Really helped me understand the topic better.

    Posted on July 23, 2025, 10:15 AM
    Jane Smith
    jane@domain.com

    Thanks for sharing this. I’ve bookmarked it for later reference.

    Posted on July 22, 2025, 7:45 PM

    FAQs

    What is the CAGR for Hydrographic survey equipment industry?

    Hydrographic survey equipment market can expand at 5.41% CAGR by 2030.

    What is the valuation of the Hydrographic survey equipment market?

    By 2030, the Hydrographic survey equipment market value can touch to USD 3,760 Mn.

    Who are key players of the Hydrographic survey equipment industry?

    Kongsberg Gruppen ASA (Norway), Chesapeake Technology (US), and EdgeTech (US) are some reputed names in the Hydrographic survey equipment market.

    What is the Hydrographic survey equipment market driver?

    The rise in maritime trade can promote the Hydrographic survey equipment market.

    What is the Hydrographic survey equipment market restrain?

    Time inefficiency is one of the restrains on the Hydrographic survey equipment market expansion.

    1. Table of Contents
    2. Executive Summary
      1. MARKET ATTRACTIVENESS ANALYSIS
        1. GLOBAL HYDROGRAPHIC SURVEY EQUIPMENT MARKET, BY TYPE
        2. GLOBAL HYDROGRAPHIC SURVEY EQUIPMENT MARKET, BY DEPTH
        3. GLOBAL HYDROGRAPHIC SURVEY EQUIPMENT MARKET, BY APPLICATION
        4. GLOBAL HYDROGRAPHIC SURVEY EQUIPMENT MARKET, BY END USER
        5. GLOBAL HYDROGRAPHIC SURVEY EQUIPMENT MARKET, BY REGION
    3. Market Introduction
      1. MARKET DEFINITION
      2. Scope of the Study
      3. MARKET STRUCTURE
      4. KEY BUYING CRITERIA
      5. MARKET FACTOR INDICATOR ANALYSIS
    4. Research Methodology
      1. RESEARCH PROCESS
      2. PRIMARY RESEARCH
      3. SECONDARY RESEARCH
      4. MARKET SIZE ESTIMATION
      5. FORECAST MODEL
      6. LIST OF ASSUMPTIONS
    5. MARKET INSIGHTS
    6. MARKET DYNAMICS
      1. INTRODUCTION
      2. DRIVERS
        1. INCREASING MARITIME TRADE
        2. RISE IN DEMAND FOR ACCURATE NAUTICAL CHARTS
        3. INCREASING USE OF UUVS AND USVS
        4. DRIVERS IMPACT ANALYSIS
      3. RESTRAINTS
        1. ISSUES RELATED TO STRINGENT REGULATIONS IMPLEMENTED BY GOVERNMENT AUTHORITIES
        2. COST AND TIME INEFFICIENCY
        3. RESTRAINTS IMPACT ANALYSIS
      4. OPPORTUNITIES
      5. MARKET/TECHNOLOGICAL TRENDS
      6. PATENT TRENDS
      7. REGULATORY LANDSCAPE/STANDARDS
    7. MARKET FACTOR ANALYSIS
      1. SUPPLY CHAIN ANALYSIS
        1. R&D
        2. MANUFACTURING
        3. DISTRIBUTION & SALES
        4. POST-SALES MONITORING
      2. PORTER’S FIVE FORCES ANALYSIS
        1. THREAT OF NEW ENTRANTS
        2. BARGAINING POWER OF SUPPLIERS
        3. BARGAINING POWER OF BUYERS
        4. THREAT OF SUBSTITUTES
        5. INTENSITY OF RIVALRY
    8. GLOBAL HYDROGRAPHIC SURVEY EQUIPMENT MARKET, BY TYPE
      1. INTRODUCTION
      2. SENSING SYSTEMS
      3. POSITIONING SYSTEMS
      4. SUBSEA SENSORS
      5. SOFTWARE
      6. UNMANNED VEHICLES
    9. GLOBAL HYDROGRAPHIC SURVEY EQUIPMENT MARKET, BY DEPTH
      1. INTRODUCTION
      2. SHALLOW WATER
      3. DEEP WATER
    10. GLOBAL HYDROGRAPHIC SURVEY EQUIPMENT MARKET, BY APPLICATION
      1. INTRODUCTION
      2. HYDROGRAPHIC CHARTING
      3. OFFSHORE OIL & GAS SURVEY
      4. PORT AND HARBOR MANAGEMENT
      5. COASTAL ENGINEERING
    11. GLOBAL HYDROGRAPHIC SURVEY EQUIPMENT MARKET, BY END USER
      1. INTRODUCTION
      2. COMMERCIAL
      3. RESEARCH
      4. DEFENSE
    12. GLOBAL HYDROGRAPHIC SURVEY EQUIPMENT MARKET, BY REGION
      1. INTRODUCTION
      2. NORTH AMERICA
        1. US
        2. CANADA
      3. EUROPE
        1. UK
        2. GERMANY
        3. FRANCE
        4. NORWAY
        5. RUSSIA
        6. NETHERLANDS
        7. REST OF EUROPE
      4. ASIA-PACIFIC
        1. CHINA
        2. INDIA
        3. JAPAN
        4. MALAYSIA
        5. REST OF ASIA-PACIFIC
      5. MIDDLE EAST & AFRICA
        1. UAE
        2. SAUDI ARABIA
        3. ISRAEL
        4. REST OF THE MIDDLE EAST & AFRICA
      6. LATIN AMERICA
        1. BRAZIL
        2. MEXICO
        3. REST OF THE LATIN AMERICA
    13. Competitive Landscape
      1. COMPETITIVE OVERVIEW
      2. COMPETITOR DASHBOARD
      3. MAJOR GROWTH STRATEGIES IN THE GLOBAL HYDROGRAPHIC SURVEY EQUIPMENT MARKET
      4. COMPETITIVE BENCHMARKING
      5. MARKET SHARE ANALYSIS
      6. LEADING PLAYER IN TERMS OF NUMBER OF DEVELOPMENTS IN THE GLOBAL HYDROGRAPHIC SURVEY EQUIPMENT MARKET
      7. KEY DEVELOPMENTS & GROWTH STRATEGIES
        1. PRODUCT LAUNCHES/SERVICE DEPLOYMENTS
        2. MERGERS & ACQUISITIONS
        3. JOINT VENTURES
    14. COMPANY PROFILES
      1. KEY MARKET PLAYERS
    15. (COMPANY OVERVIEW, PRODUCTS & SERVICES OFFERED, FINANCIAL OVERVIEW, KEY DEVELOPMENTS, SWOT ANALYSIS, AND KEY STRATEGIES TO BE COVERED FOR PUBLIC COMPANIES)
      1. KONGSBERG
      2. CHESAPEAKE TECHNOLOGY
      3. EDGETECH
      4. ENVIRONMENTAL SYSTEMS RESEARCH INSTITUTE, INC. (ESRI)
      5. INNOMAR TECHNOLOGIE GMBH
      6. IXBLUE SAS
      7. MITCHAM INDUSTRIES INC.
      8. SAAB AB
      9. SONARDYNE INTERNATIONAL LTD.
      10. IXBLUE SAS
    16. OTHER PROMINENT PLAYERS
      1. SYQWEST INC.
      2. TELEDYNE TECHNOLOGIES INC.
      3. TRITECH INTERNATIONAL LTD.
      4. VALEPORT LTD.
      5. XYLEM, INC.
      6. MOOG INC.
      7. SEAFLOOR SYSTEMS INC.
      8. RAYTHEON TECHNOLOGIES CORPORATION
      9. THALES GROUP
      10. ATLAS ELECTRONIK GMBH
    17. APPENDIX
      1. REFERENCES
      2. RELATED REPORTS
      3. LIST OF ABBREVIATIONS
    18. List of Tables and Figures
      1. LIST OF TABLES
      2. TABLE 1 LIST OF ASSUMPTIONS
      3. TABLE 2 MAJOR PATENTS GRANTED FOR HYDROGRAPHIC SURVEY EQUIPMENT (2014–2020)
      4. TABLE 3 GLOBAL HYDROGRAPHIC SURVEY EQUIPMENT MARKET, BY TYPE, 2020-2030 (USD MILLION)
      5. TABLE 4 GLOBAL HYDROGRAPHIC SURVEY EQUIPMENT MARKET, BY APPLICATION, 2020-2030(USD MILLION)
      6. TABLE 5 GLOBAL HYDROGRAPHIC SURVEY EQUIPMENT MARKET, BY END USER, 2020-2030 (USD MILLION)
      7. TABLE 6 GLOBAL HYDROGRAPHIC SURVEY EQUIPMENT MARKET, BY DEPTH, 2020-2030 (USD MILLION)
      8. TABLE 7 GLOBAL HYDROGRAPHIC SURVEY EQUIPMENT MARKET, BY REGION, 2020-2030 (USD MILLION)
      9. TABLE 8 NORTH AMERICA: HYDROGRAPHIC SURVEY EQUIPMENT MARKET, BY COUNTRY, 2020-2030(USD MILLION)
      10. TABLE 9 NORTH AMERICA: HYDROGRAPHIC SURVEY EQUIPMENT MARKET, BY TYPE, 2020-2030 (USD MILLION)
      11. TABLE 10 NORTH AMERICA: HYDROGRAPHIC SURVEY EQUIPMENT MARKET, BY APPLICATION, 2020-2030 (USD MILLION)
      12. TABLE 11 NORTH AMERICA: HYDROGRAPHIC SURVEY EQUIPMENT MARKET, BY END USER, 2020-2030 (USD MILLION)
      13. TABLE 12 NORTH AMERICA: HYDROGRAPHIC SURVEY EQUIPMENT MARKET, BY DEPTH, 2020-2030 (USD MILLION)
      14. TABLE 13 US: HYDROGRAPHIC SURVEY EQUIPMENT MARKET, BY TYPE, 2020-2030 (USD MILLION)
      15. TABLE 14 US: HYDROGRAPHIC SURVEY EQUIPMENT MARKET, BY APPLICATION, 2020-2030 (USD MILLION)
      16. TABLE 15 US: HYDROGRAPHIC SURVEY EQUIPMENT MARKET, BY END USER, 2020-2030 (USD MILLION)
      17. TABLE 16 US: HYDROGRAPHIC SURVEY EQUIPMENT MARKET, BY DEPTH, 2020-2030 (USD MILLION)
      18. TABLE 17 CANADA: HYDROGRAPHIC SURVEY EQUIPMENT MARKET, BY TYPE, 2020-2030 (USD MILLION)
      19. TABLE 18 CANADA: HYDROGRAPHIC SURVEY EQUIPMENT MARKET, BY APPLICATION, 2020-2030 (USD MILLION)
      20. TABLE 19 CANADA: HYDROGRAPHIC SURVEY EQUIPMENT MARKET, BY END USER, 2020-2030 (USD MILLION)
      21. TABLE 20 CANADA: HYDROGRAPHIC SURVEY EQUIPMENT MARKET, BY DEPTH, 2020-2030 (USD MILLION)
      22. TABLE 21 EUROPE: HYDROGRAPHIC SURVEY EQUIPMENT MARKET, BY COUNTRY, 2020-2030 (USD MILLION)
      23. TABLE 22 EUROPE: HYDROGRAPHIC SURVEY EQUIPMENT MARKET, BY TYPE, 2020-2030 (USD MILLION)
      24. TABLE 23 EUROPE: HYDROGRAPHIC SURVEY EQUIPMENT MARKET, BY APPLICATION, 2020-2030 (USD MILLION)
      25. TABLE 24 EUROPE: HYDROGRAPHIC SURVEY EQUIPMENT MARKET, BY END USER, 2020-2030 (USD MILLION)
      26. TABLE 25 EUROPE: HYDROGRAPHIC SURVEY EQUIPMENT MARKET, BY DEPTH, 2020-2030 (USD MILLION)
      27. TABLE 26 UK: HYDROGRAPHIC SURVEY EQUIPMENT MARKET, BY TYPE, 2020-2030 (USD MILLION)
      28. TABLE 27 UK: HYDROGRAPHIC SURVEY EQUIPMENT MARKET, BY APPLICATION, 2020-2030 (USD MILLION)
      29. TABLE 28 UK: HYDROGRAPHIC SURVEY EQUIPMENT MARKET, BY END USER, 2020-2030 (USD MILLION)
      30. TABLE 29 UK: HYDROGRAPHIC SURVEY EQUIPMENT MARKET, BY DEPTH, 2020-2030 (USD MILLION)
      31. TABLE 30 GERMANY: HYDROGRAPHIC SURVEY EQUIPMENT MARKET, BY TYPE, 2020-2030 (USD MILLION)
      32. TABLE 31 GERMANY: HYDROGRAPHIC SURVEY EQUIPMENT MARKET, BY APPLICATION, 2020-2030 (USD MILLION)
      33. TABLE 32 GERMANY: HYDROGRAPHIC SURVEY EQUIPMENT MARKET, BY END USER, 2020-2030 (USD MILLION)
      34. TABLE 33 GERMANY: HYDROGRAPHIC SURVEY EQUIPMENT MARKET, BY DEPTH, 2020-2030 (USD MILLION)
      35. TABLE 34 FRANCE: HYDROGRAPHIC SURVEY EQUIPMENT MARKET, BY TYPE, 2020-2030 (USD MILLION)
      36. TABLE 35 FRANCE: HYDROGRAPHIC SURVEY EQUIPMENT MARKET, BY APPLICATION, 2020-2030 (USD MILLION)
      37. TABLE 36 FRANCE: HYDROGRAPHIC SURVEY EQUIPMENT MARKET, BY END USER, 2020-2030 (USD MILLION)
      38. TABLE 37 FRANCE: HYDROGRAPHIC SURVEY EQUIPMENT MARKET, BY DEPTH, 2020-2030 (USD MILLION)
      39. TABLE 38 NORWAY: HYDROGRAPHIC SURVEY EQUIPMENT MARKET, BY TYPE, 2020-2030 (USD MILLION)
      40. TABLE 39 NORWAY: HYDROGRAPHIC SURVEY EQUIPMENT MARKET, BY APPLICATION, 2020-2030 (USD MILLION)
      41. TABLE 40 NORWAY: HYDROGRAPHIC SURVEY EQUIPMENT MARKET, BY END USER, 2020-2030 (USD MILLION)
      42. TABLE 41 NORWAY: HYDROGRAPHIC SURVEY EQUIPMENT MARKET, BY DEPTH, 2020-2030 (USD MILLION)
      43. TABLE 42 RUSSIA: HYDROGRAPHIC SURVEY EQUIPMENT MARKET, BY TYPE, 2020-2030 (USD MILLION)
      44. TABLE 43 RUSSIA: HYDROGRAPHIC SURVEY EQUIPMENT MARKET, BY APPLICATION, 2020-2030 (USD MILLION)
      45. TABLE 44 RUSSIA: HYDROGRAPHIC SURVEY EQUIPMENT MARKET, BY END USER, 2020-2030 (USD MILLION)
      46. TABLE 45 RUSSIA: HYDROGRAPHIC SURVEY EQUIPMENT MARKET, BY DEPTH, 2020-2030 (USD MILLION)
      47. TABLE 46 NETHERLANDS: HYDROGRAPHIC SURVEY EQUIPMENT MARKET, BY TYPE, 2020-2030 (USD MILLION)
      48. TABLE 47 NETHERLANDS: HYDROGRAPHIC SURVEY EQUIPMENT MARKET, BY APPLICATION, 2020-2030 (USD MILLION)
      49. TABLE 48 NETHERLANDS: HYDROGRAPHIC SURVEY EQUIPMENT MARKET, BY END USER, 2020-2030 (USD MILLION)
      50. TABLE 49 NETHERLANDS: HYDROGRAPHIC SURVEY EQUIPMENT MARKET, BY DEPTH, 2020-2030 (USD MILLION)
      51. TABLE 50 REST OF EUROPE: HYDROGRAPHIC SURVEY EQUIPMENT MARKET, BY TYPE, 2020-2030 (USD MILLION)
      52. TABLE 51 REST OF EUROPE: HYDROGRAPHIC SURVEY EQUIPMENT MARKET, BY APPLICATION, 2020-2030 (USD MILLION)
      53. TABLE 52 REST OF EUROPE: HYDROGRAPHIC SURVEY EQUIPMENT MARKET, BY END USER, 2020-2030 (USD MILLION)
      54. TABLE 53 REST OF EUROPE: HYDROGRAPHIC SURVEY EQUIPMENT MARKET, BY DEPTH, 2020-2030 (USD MILLION)
      55. TABLE 54 ASIA-PACIFIC: HYDROGRAPHIC SURVEY EQUIPMENT MARKET, BY COUNTRY, 2020-2030 (USD MILLION)
      56. TABLE 55 ASIA-PACIFIC: HYDROGRAPHIC SURVEY EQUIPMENT MARKET, BY TYPE, 2020-2030 (USD MILLION)
      57. TABLE 56 ASIA-PACIFIC: HYDROGRAPHIC SURVEY EQUIPMENT MARKET, BY APPLICATION, 2020-2030 (USD MILLION)
      58. TABLE 57 ASIA-PACIFIC: HYDROGRAPHIC SURVEY EQUIPMENT MARKET, BY END USER, 2020-2030 (USD MILLION)
      59. TABLE 58 ASIA-PACIFIC: HYDROGRAPHIC SURVEY EQUIPMENT MARKET, BY DEPTH, 2020-2030 (USD MILLION)
      60. TABLE 59 CHINA: HYDROGRAPHIC SURVEY EQUIPMENT MARKET, BY TYPE, 2020-2030 (USD MILLION)
      61. TABLE 60 CHINA: HYDROGRAPHIC SURVEY EQUIPMENT MARKET, BY APPLICATION, 2020-2030 (USD MILLION)
      62. TABLE 61 CHINA: HYDROGRAPHIC SURVEY EQUIPMENT MARKET, BY END USER, 2020-2030 (USD MILLION)
      63. TABLE 62 CHINA: HYDROGRAPHIC SURVEY EQUIPMENT MARKET, BY DEPTH, 2020-2030 (USD MILLION)
      64. TABLE 63 INDIA: HYDROGRAPHIC SURVEY EQUIPMENT MARKET, BY TYPE, 2020-2030 (USD MILLION)
      65. TABLE 64 INDIA: HYDROGRAPHIC SURVEY EQUIPMENT MARKET, BY APPLICATION, 2020-2030 (USD MILLION)
      66. TABLE 65 INDIA: HYDROGRAPHIC SURVEY EQUIPMENT MARKET, BY END USER, 2020-2030 (USD MILLION)
      67. TABLE 66 INDIA: HYDROGRAPHIC SURVEY EQUIPMENT MARKET, BY DEPTH, 2020-2030 (USD MILLION)
      68. TABLE 67 JAPAN: HYDROGRAPHIC SURVEY EQUIPMENT MARKET, BY TYPE, 2020-2030 (USD MILLION)
      69. TABLE 68 JAPAN: HYDROGRAPHIC SURVEY EQUIPMENT MARKET, BY APPLICATION, 2020-2030 (USD MILLION)
      70. TABLE 69 JAPAN: HYDROGRAPHIC SURVEY EQUIPMENT MARKET, BY END USER, 2020-2030 (USD MILLION)
      71. TABLE 70 JAPAN: HYDROGRAPHIC SURVEY EQUIPMENT MARKET, BY DEPTH, 2020-2030 (USD MILLION)
      72. TABLE 71 MALAYSIA: HYDROGRAPHIC SURVEY EQUIPMENT MARKET, BY TYPE, 2020-2030 (USD MILLION)
      73. TABLE 72 MALAYSIA: HYDROGRAPHIC SURVEY EQUIPMENT MARKET, BY APPLICATION, 2020-2030 (USD MILLION)
      74. TABLE 73 MALAYSIA: HYDROGRAPHIC SURVEY EQUIPMENT MARKET, BY END USER, 2020-2030 (USD MILLION)
      75. TABLE 74 MALAYSIA: HYDROGRAPHIC SURVEY EQUIPMENT MARKET, BY DEPTH, 2020-2030 (USD MILLION)
      76. TABLE 75 REST OF ASIA-PACIFIC: HYDROGRAPHIC SURVEY EQUIPMENT MARKET, BY TYPE, 2020-2030 (USD MILLION)
      77. TABLE 76 REST OF ASIA-PACIFIC: HYDROGRAPHIC SURVEY EQUIPMENT MARKET, BY APPLICATION, 2020-2030 (USD MILLION)
      78. TABLE 77 REST OF ASIA-PACIFIC: HYDROGRAPHIC SURVEY EQUIPMENT MARKET, BY END USER, 2020-2030 (USD MILLION)
      79. TABLE 78 REST OF ASIA-PACIFIC: HYDROGRAPHIC SURVEY EQUIPMENT MARKET, BY DEPTH, 2020-2030 (USD MILLION)
      80. TABLE 79 MIDDLE EAST & AFRICA: HYDROGRAPHIC SURVEY EQUIPMENT MARKET, BY COUNTRY, 2020-2030 (USD MILLION)
      81. TABLE 80 MIDDLE EAST & AFRICA: HYDROGRAPHIC SURVEY EQUIPMENT MARKET, BY TYPE, 2020-2030 (USD MILLION)
      82. TABLE 81 MIDDLE EAST & AFRICA: HYDROGRAPHIC SURVEY EQUIPMENT MARKET, BY APPLICATION, 2020-2030 (USD MILLION)
      83. TABLE 82 MIDDLE EAST & AFRICA: HYDROGRAPHIC SURVEY EQUIPMENT MARKET, BY END USER, 2020-2030 (USD MILLION)
      84. TABLE 83 MIDDLE EAST & AFRICA: HYDROGRAPHIC SURVEY EQUIPMENT MARKET, BY DEPTH, 2020-2030 (USD MILLION)
      85. TABLE 84 UAE: HYDROGRAPHIC SURVEY EQUIPMENT MARKET, BY TYPE, 2020-2030 (USD MILLION)
      86. TABLE 85 UAE: HYDROGRAPHIC SURVEY EQUIPMENT MARKET, BY APPLICATION, 2020-2030 (USD MILLION)
      87. TABLE 86 UAE: HYDROGRAPHIC SURVEY EQUIPMENT MARKET, BY END USER, 2020-2030 (USD MILLION)
      88. TABLE 87 UAE: HYDROGRAPHIC SURVEY EQUIPMENT MARKET, BY DEPTH, 2020-2030 (USD MILLION)
      89. TABLE 88 SAUDI ARABIA: HYDROGRAPHIC SURVEY EQUIPMENT MARKET, BY TYPE, 2020-2030 (USD MILLION)
      90. TABLE 89 SAUDI ARABIA: HYDROGRAPHIC SURVEY EQUIPMENT MARKET, BY APPLICATION, 2020-2030 (USD MILLION)
      91. TABLE 90 SAUDI ARABIA: HYDROGRAPHIC SURVEY EQUIPMENT MARKET, BY END USER, 2020-2030 (USD MILLION)
      92. TABLE 91 SAUDI ARABIA: HYDROGRAPHIC SURVEY EQUIPMENT MARKET, BY DEPTH, 2020-2030 (USD MILLION)
      93. TABLE 92 ISRAEL: HYDROGRAPHIC SURVEY EQUIPMENT MARKET, BY TYPE, 2020-2030 (USD MILLION)
      94. TABLE 93 ISRAEL: HYDROGRAPHIC SURVEY EQUIPMENT MARKET, BY APPLICATION, 2020-2030 (USD MILLION)
      95. TABLE 94 ISRAEL: HYDROGRAPHIC SURVEY EQUIPMENT MARKET, BY END USER, 2020-2030 (USD MILLION)
      96. TABLE 95 ISRAEL: HYDROGRAPHIC SURVEY EQUIPMENT MARKET, BY DEPTH, 2020-2030 (USD MILLION)
      97. TABLE 96 REST OF THE MIDDLE EAST & AFRICA: HYDROGRAPHIC SURVEY EQUIPMENT MARKET, BY TYPE, 2020-2030 (USD MILLION)
      98. TABLE 97 REST OF THE MIDDLE EAST & AFRICA: HYDROGRAPHIC SURVEY EQUIPMENT MARKET, BY APPLICATION, 2020-2030 (USD MILLION)
      99. TABLE 98 REST OF THE MIDDLE EAST & AFRICA: HYDROGRAPHIC SURVEY EQUIPMENT MARKET, BY END USER, 2020-2030 (USD MILLION)
      100. TABLE 99 REST OF THE MIDDLE EAST & AFRICA: HYDROGRAPHIC SURVEY EQUIPMENT MARKET, BY DEPTH, 2020-2030 (USD MILLION)
      101. TABLE 100 LATIN AMERICA: HYDROGRAPHIC SURVEY EQUIPMENT MARKET, BY COUNTRY, 2020-2030 (USD MILLION)
      102. TABLE 101 LATIN AMERICA: HYDROGRAPHIC SURVEY EQUIPMENT MARKET, BY TYPE, 2020-2030 (USD MILLION)
      103. TABLE 102 LATIN AMERICA: HYDROGRAPHIC SURVEY EQUIPMENT MARKET, BY APPLICATION, 2020-2030 (USD MILLION)
      104. TABLE 103 LATIN AMERICA: HYDROGRAPHIC SURVEY EQUIPMENT MARKET, BY END USER, 2020-2030 (USD MILLION)
      105. TABLE 104 LATIN AMERICA: HYDROGRAPHIC SURVEY EQUIPMENT MARKET, BY DEPTH, 2020-2030 (USD MILLION)
      106. TABLE 105 BRAZIL: HYDROGRAPHIC SURVEY EQUIPMENT MARKET, BY TYPE, 2020-2030 (USD MILLION)
      107. TABLE 106 BRAZIL: HYDROGRAPHIC SURVEY EQUIPMENT MARKET, BY APPLICATION, 2020-2030 (USD MILLION)
      108. TABLE 107 BRAZIL: HYDROGRAPHIC SURVEY EQUIPMENT MARKET, BY END USER, 2020-2030 (USD MILLION)
      109. TABLE 108 BRAZIL: HYDROGRAPHIC SURVEY EQUIPMENT MARKET, BY DEPTH, 2020-2030 (USD MILLION)
      110. TABLE 109 MEXICO: HYDROGRAPHIC SURVEY EQUIPMENT MARKET, BY TYPE, 2020-2030 (USD MILLION)
      111. TABLE 110 MEXICO: HYDROGRAPHIC SURVEY EQUIPMENT MARKET, BY APPLICATION, 2020-2030 (USD MILLION)
      112. TABLE 111 MEXICO: HYDROGRAPHIC SURVEY EQUIPMENT MARKET, BY END USER, 2020-2030 (USD MILLION)
      113. TABLE 112 MEXICO: HYDROGRAPHIC SURVEY EQUIPMENT MARKET, BY DEPTH, 2020-2030 (USD MILLION)
      114. TABLE 113 REST OF THE LATIN AMERICA: HYDROGRAPHIC SURVEY EQUIPMENT MARKET, BY TYPE, 2020-2030 (USD MILLION)
      115. TABLE 114 REST OF THE LATIN AMERICA: HYDROGRAPHIC SURVEY EQUIPMENT MARKET, BY APPLICATION, 2020-2030 (USD MILLION)
      116. TABLE 115 REST OF THE LATIN AMERICA: HYDROGRAPHIC SURVEY EQUIPMENT MARKET, BY END USER, 2020-2030 (USD MILLION)
      117. TABLE 116 REST OF THE LATIN AMERICA: HYDROGRAPHIC SURVEY EQUIPMENT MARKET, BY DEPTH, 2020-2030 (USD MILLION)
      118. TABLE 117 THE MOST ACTIVE PLAYERS IN THE GLOBAL HYDROGRAPHIC SURVEY EQUIPMENT MARKET
      119. TABLE 118 CONTRACTS & AGREEMENTS
      120. TABLE 119 MERGERS & ACQUISITIONS
      121. TABLE 120 PRODUCT/SERVICE DEVELOPMENTS
      122. TABLE 121 EXPANSIONS & INVESTMENTS
      123. TABLE 122 JOINT VENTURES & PARTNERSHIPS   LIST OF FIGURES
      124. FIGURE 1 MARKET SYNOPSIS
      125. FIGURE 2 GLOBAL HYDROGRAPHIC SURVEY EQUIPMENT MARKET: MARKET ATTRACTIVENESS ANALYSIS
      126. FIGURE 3 GLOBAL HYDROGRAPHIC SURVEY EQUIPMENT MARKET ANALYSIS, BY TYPE
      127. FIGURE 4 GLOBAL HYDROGRAPHIC SURVEY EQUIPMENT MARKET ANALYSIS, BY APPLICATION
      128. FIGURE 5 GLOBAL HYDROGRAPHIC SURVEY EQUIPMENT MARKET ANALYSIS, BY END USER
      129. FIGURE 6 GLOBAL HYDROGRAPHIC SURVEY EQUIPMENT MARKET ANALYSIS, BY DEPTH
      130. FIGURE 7 GLOBAL HYDROGRAPHIC SURVEY EQUIPMENT MARKET ANALYSIS, BY REGION
      131. FIGURE 8 GLOBAL HYDROGRAPHIC SURVEY EQUIPMENT MARKET: MARKET STRUCTURE
      132. FIGURE 9 KEY BUYING CRITERIA FOR HYDROGRAPHIC SURVEY EQUIPMENT TECHNOLOGIES
      133. FIGURE 10 RESEARCH PROCESS OF MRFR
      134. FIGURE 11 NORTH AMERICA: MARKET SIZE & MARKET SHARE, BY COUNTRY, 2020 VS 2028
      135. FIGURE 12 EUROPE: MARKET SIZE & MARKET SHARE, BY COUNTRY, 2020 VS 2028
      136. FIGURE 13 ASIA-PACIFIC: MARKET SIZE & MARKET SHARE, BY COUNTRY, 2020 VS 2028
      137. FIGURE 14 MIDDLE EAST & AFRICA: MARKET SIZE & MARKET SHARE, BY COUNTRY, 2020 VS 2028
      138. FIGURE 15 LATIN AMERICA: MARKET SIZE & MARKET SHARE, BY COUNTRY, 2020 VS 2028
      139. FIGURE 16 MARKET DYNAMICS OVERVIEW
      140. FIGURE 17 DRIVERS IMPACT ANALYSIS: GLOBAL HYDROGRAPHIC SURVEY EQUIPMENT MARKET
      141. FIGURE 18 RESTRAINTS IMPACT ANALYSIS: GLOBAL HYDROGRAPHIC SURVEY EQUIPMENT MARKET
      142. FIGURE 19 PORTER’S FIVE FORCES ANALYSIS OF THE GLOBAL HYDROGRAPHIC SURVEY EQUIPMENT MARKET
      143. FIGURE 20 SUPPLY CHAIN: GLOBAL HYDROGRAPHIC SURVEY EQUIPMENT MARKET
      144. FIGURE 21 GLOBAL HYDROGRAPHIC SURVEY EQUIPMENT MARKET SHARE, BY TYPE, 2020 (% SHARE)
      145. FIGURE 22 GLOBAL HYDROGRAPHIC SURVEY EQUIPMENT MARKET SHARE, BY END USER, 2020 (% SHARE)
      146. FIGURE 23 GLOBAL HYDROGRAPHIC SURVEY EQUIPMENT MARKET SHARE, BY APPLICATION, 2020 (% SHARE)
      147. FIGURE 24 GLOBAL HYDROGRAPHIC SURVEY EQUIPMENT MARKET SHARE, BY DEPTH, 2020 (% SHARE)
      148. FIGURE 25 GLOBAL HYDROGRAPHIC SURVEY EQUIPMENT MARKET SHARE, BY REGION, 2020 (% SHARE)
      149. FIGURE 26 NORTH AMERICA: HYDROGRAPHIC SURVEY EQUIPMENT MARKET SHARE, BY COUNTRY, 2020 (% SHARE)
      150. FIGURE 27 EUROPE: HYDROGRAPHIC SURVEY EQUIPMENT MARKET SHARE, BY COUNTRY, 2020 (% SHARE)
      151. FIGURE 28 ASIA-PACIFIC: HYDROGRAPHIC SURVEY EQUIPMENT MARKET SHARE, BY COUNTRY, 2020 (% SHARE)
      152. FIGURE 29 MIDDLE EAST & AFRICA: HYDROGRAPHIC SURVEY EQUIPMENT MARKET SHARE, BY COUNTRY, 2020 (% SHARE)
      153. FIGURE 30 LATIN AMERICA: HYDROGRAPHIC SURVEY EQUIPMENT MARKET SHARE, BY REGION, 2020 (% SHARE)
      154. FIGURE 31 COMPETITOR DASHBOARD: GLOBAL HYDROGRAPHIC SURVEY EQUIPMENT MARKET
      155. FIGURE 32 CAPITAL MARKET RATIO AND FINANCIAL MATRIX
      156. FIGURE 33 CONTRACTS & AGREEMENTS: THE MAJOR STRATEGY ADOPTED BY KEY PLAYERS IN THE GLOBAL HYDROGRAPHIC SURVEY EQUIPMENT MARKET
      157. FIGURE 34 BENCHMARKING OF MAJOR COMPETITORS
      158. FIGURE 35 MAJOR SERVICE PROVIDERS MARKET SHARE ANALYSIS, 2020

    Hydrographic Survey Equipment Market Segmentation

    Market Segmentation Overview

    • Detailed segmentation data will be available in the full report
    • Comprehensive analysis by multiple parameters
    • Regional and country-level breakdowns
    • Market size forecasts by segment
    Infographic

    Free Sample Request

    Kindly complete the form below to receive a free sample of this Report

    Get Free Sample

    Customer Strories

    “I am very pleased with how market segments have been defined in a relevant way for my purposes (such as "Portable Freezers & refrigerators" and "last-mile"). In general the report is well structured. Thanks very much for your efforts.”

    Victoria Milne

    Founder
    Case Study
    Chemicals and Materials