Hydraulic Pumps Market (2026 - 2035)

ID: MRFR/EnP/6267-CR 179 Pages Chitranshi Jaiswal Last Updated: October 17, 2026
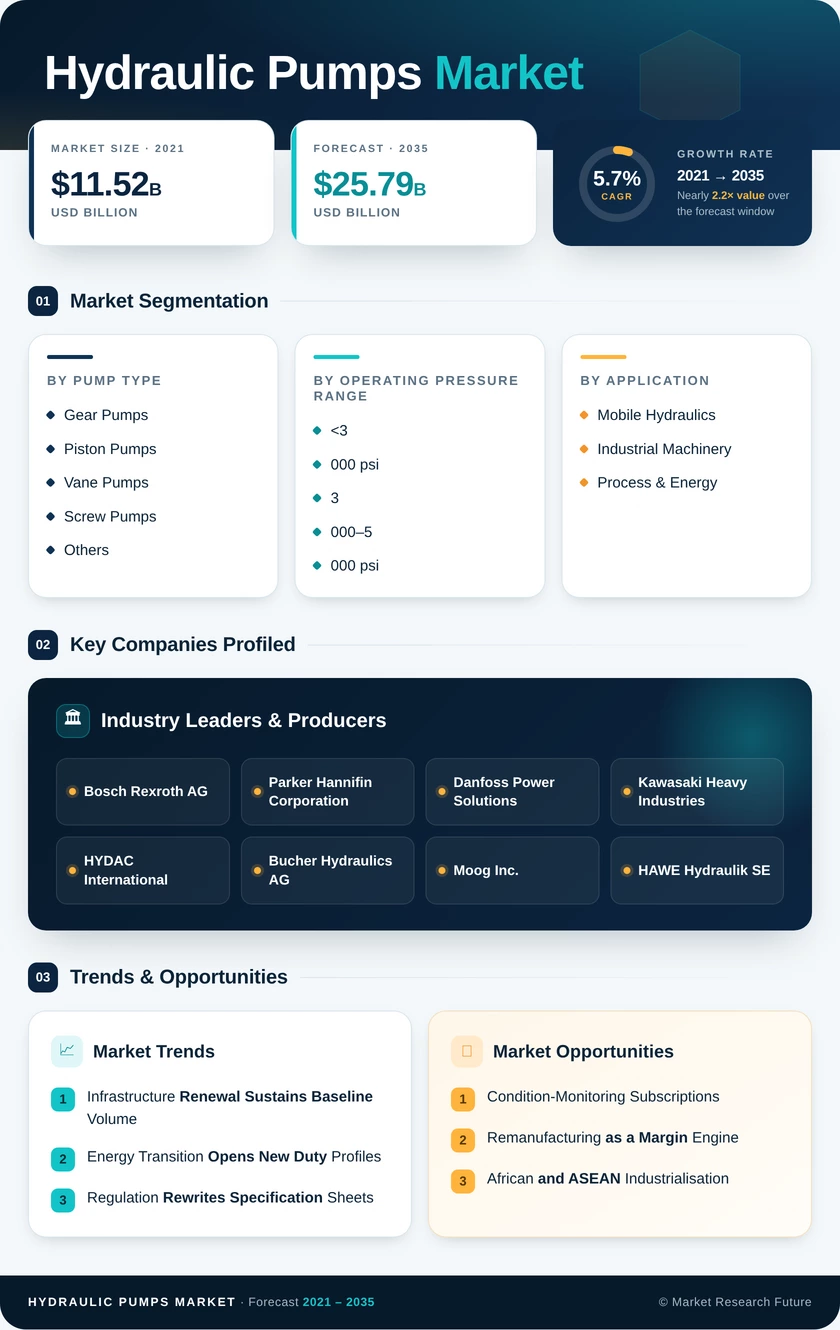
Hydraulic Pumps Market Research Report By Pump Type (Gear Pumps, Piston Pumps, Vane Pumps, Screw Pumps, Others), By Operating Pressure Range (5,000 psi), By Application (Mobile Hydraulics, Industrial Machinery, Process & Energy), By End-User Vertical (Construction, Agriculture, Oil & Gas, Material Handling, Power Generation, Automotive & Transportation, Mining, Others) and By Regional (North America, Europe, South America, Asia Pacific, Middle East and Africa) - Growth & Industry Forecast to 2035
Hydraulic Pumps Market
Market Size
Forecast Period2026-2035
CAGR (2026-2035)5.7%
2025 Market SizeUSD 14.82 Billion
2035 Market SizeUSD 25.79 Billion
Key Players
Bosch Rexroth AG
Parker Hannifin Corporation
Danfoss Power Solutions
Kawasaki Heavy Industries
HYDAC International
Bucher Hydraulics AG
Opportunities
  • Condition-Monitoring Subscriptions
  • Remanufacturing as a Margin Engine
  • African and ASEAN Industrialisation
  1. 1 Market Overview |
    1. 1.1 Study Assumptions & Market Definition |
    2. 1.2 Scope of the Study |
    3. 1.3 Research Methodology
  2. 2 Market Summary & Key Takeaways |
    1. 2.1 Key Findings by Pump Type |
    2. 2.2 Key Findings by Sector |
    3. 2.3 Key Findings by Geography
  3. 3 Market Size & Forecast (2021–2035) |
    1. 3.1 Historical Market Size (2021–2025) |
    2. 3.2 Current & Forecast Market Size (2026–2035) |
    3. 3.3 Market Size by Revenue (USD Billion) |
    4. 3.4 Year-over-Year Growth Analysis
  4. 4 Market Drivers Analysis |
    1. 4.1 Infrastructure Renewal & Construction Fleet Expansion |
    2. 4.2 Energy-Transition Capital Expenditure |
    3. 4.3 Emissions and Efficiency Regulation |
    4. 4.4 Factory Automation & Industrial Retrofit Cycles |
    5. 4.5 Aftermarket & Remanufacturing Demand
  5. 5 Market Restraints Analysis |
    1. 5.1 Electro-Mechanical Actuator Substitution |
    2. 5.2 Input Cost & Casting Supply Volatility |
    3. 5.3 Skilled Fluid-Power Technician Shortage |
    4. 5.4 Extended Equipment Life & Rebuild Culture |
    5. 5.5 Leakage and Environmental Compliance Costs
  6. 6 Market Opportunity Analysis |
    1. 6.1 Condition-Monitoring Subscriptions |
    2. 6.2 Remanufacturing as a Margin Engine |
    3. 6.3 African and ASEAN Industrialisation |
    4. 6.4 Hydrogen & Electrolyser Balance-of-Plant |
    5. 6.5 Efficiency-Rated Product Tiers |
    6. 6.6 Industry Value Chain Analysis |
    7. 6.7 Porter's Five Forces Analysis
  7. 7 Regional Analysis |
    1. 7.1 North America | |
      1. 7.1.1 United States | |
      2. 7.1.2 Canada | |
      3. 7.1.3 Mexico |
    2. 7.2 Europe | |
      1. 7.2.1 Germany | |
      2. 7.2.2 United Kingdom | |
      3. 7.2.3 France | |
      4. 7.2.4 Italy | |
      5. 7.2.5 Spain | |
      6. 7.2.6 Nordic Countries | |
      7. 7.2.7 Russia | |
      8. 7.2.8 Rest of Europe |
    3. 7.3 Asia-Pacific | |
      1. 7.3.1 China | |
      2. 7.3.2 India | |
      3. 7.3.3 Japan | |
      4. 7.3.4 South Korea | |
      5. 7.3.5 ASEAN | |
      6. 7.3.6 Rest of Asia-Pacific |
    4. 7.4 South America | |
      1. 7.4.1 Brazil | |
      2. 7.4.2 Argentina | |
      3. 7.4.3 Rest of South America |
    5. 7.5 Middle East & Africa | |
      1. 7.5.1 Saudi Arabia | |
      2. 7.5.2 UAE | |
      3. 7.5.3 South Africa | |
      4. 7.5.4 Egypt | |
      5. 7.5.5 Rest of Middle East & Africa
  8. 8 Future Outlook (2026–2035) |
    1. 8.1 Predictive Maintenance as Standard Equipment |
    2. 8.2 Hybrid & Electrified Drive Architectures |
    3. 8.3 Fluid Chemistry and Environmental Liability |
    4. 8.4 Efficiency Reporting and Sustainability Disclosure
  9. 9 Segmentation Analysis |
    1. 9.1 By Pump Type | |
      1. 9.1.1 Gear Pumps | |
      2. 9.1.2 Piston Pumps | |
      3. 9.1.3 Vane Pumps | |
      4. 9.1.4 Screw Pumps | |
      5. 9.1.5 Others |
    2. 9.2 By Operating Pressure Range | |
      1. 9.2.1 5,000 psi |
    3. 9.3 By Application | |
      1. 9.3.1 Mobile Hydraulics | |
      2. 9.3.2 Industrial Machinery | |
      3. 9.3.3 Process & Energy |
    4. 9.4 By End-User Vertical | |
      1. 9.4.1 Construction | |
      2. 9.4.2 Agriculture | |
      3. 9.4.3 Oil & Gas | |
      4. 9.4.4 Material Handling | |
      5. 9.4.5 Power Generation | |
      6. 9.4.6 Automotive & Transportation | |
      7. 9.4.7 Mining | |
      8. 9.4.8 Others
  10. 10 Competitive Landscape |
    1. 10.1 Market Share Analysis (2026) |
    2. 10.2 Competitive Benchmarking Matrix |
    3. 10.3 Company Profiles | |
      1. 10.3.1 Bosch Rexroth AG | |
      2. 10.3.2 Parker Hannifin Corporation | |
      3. 10.3.3 Danfoss Power Solutions | |
      4. 10.3.4 Kawasaki Heavy Industries | |
      5. 10.3.5 HYDAC International | |
      6. 10.3.6 Bucher Hydraulics AG | |
      7. 10.3.7 Moog Inc. | |
      8. 10.3.8 HAWE Hydraulik SE | |
      9. 10.3.9 Casappa S.p.A. | |
      10. 10.3.10 Yuken Kogyo Co., Ltd. | |
      11. 10.3.11 Liebherr Group | |
      12. 10.3.12 Enerpac Tool Group
  11. 11 Recent Developments & News
  12. 12 Report Scope & Methodology |
    1. 12.1 Study Period & Base Year |
    2. 12.2 Data Sources & Citations |
    3. 12.3 Abbreviations
  13. 13 Detailed Sources & Citations
  14. 14 Frequently Asked Questions
  15. 15 LIST OF TABLES |
  16. TABLE 1 Global Hydraulic Pumps Market Size & Forecast, by Revenue (USD Billion), 2021–2035 |
  17. TABLE 2 Global Hydraulic Pumps Market – Year-over-Year Growth Analysis, 2021–2035 |
  18. TABLE 3 Driver Impact Analysis Matrix, 2026–2035 |
  19. TABLE 4 Restraint Impact Analysis Matrix, 2026–2035 |
  20. TABLE 5 Global Market Size, by Pump Type, 2021–2035 (USD Billion) |
  21. TABLE 6 Global Market Size, by Operating Pressure Range, 2021–2035 (USD Billion) |
  22. TABLE 7 Global Market Size, by Application, 2021–2035 (USD Billion) |
  23. TABLE 8 Global Market Size, by End-User Vertical, 2021–2035 (USD Billion) |
  24. TABLE 9 Global Market Size, by Region, 2021–2035 (USD Billion) |
  25. TABLE 10 Regional Summary – Share, Value and Investment Themes, 2025 |
  26. TABLE 11 North America Market Size, by Country, 2021–2035 (USD Billion) |
  27. TABLE 12 Europe Market Size, by Country, 2021–2035 (USD Billion) |
  28. TABLE 13 Asia-Pacific Market Size, by Country, 2021–2035 (USD Billion) |
  29. TABLE 14 South America Market Size, by Country, 2021–2035 (USD Billion) |
  30. TABLE 15 Middle East & Africa Market Size, by Country, 2021–2035 (USD Billion) |
  31. TABLE 16 North America Market Size, by Pump Type, 2021–2035 (USD Billion) |
  32. TABLE 17 North America Market Size, by Application, 2021–2035 (USD Billion) |
  33. TABLE 18 North America Market Size, by End-User Vertical, 2021–2035 (USD Billion) |
  34. TABLE 19 Europe Market Size, by Pump Type, 2021–2035 (USD Billion) |
  35. TABLE 20 Europe Market Size, by Operating Pressure Range, 2021–2035 (USD Billion) |
  36. TABLE 21 Europe Market Size, by End-User Vertical, 2021–2035 (USD Billion) |
  37. TABLE 22 Asia-Pacific Market Size, by Pump Type, 2021–2035 (USD Billion) |
  38. TABLE 23 Asia-Pacific Market Size, by Application, 2021–2035 (USD Billion) |
  39. TABLE 24 Asia-Pacific Market Size, by End-User Vertical, 2021–2035 (USD Billion) |
  40. TABLE 25 South America Market Size, by Pump Type, 2021–2035 (USD Billion) |
  41. TABLE 26 South America Market Size, by End-User Vertical, 2021–2035 (USD Billion) |
  42. TABLE 27 Middle East & Africa Market Size, by Pump Type, 2021–2035 (USD Billion) |
  43. TABLE 28 Middle East & Africa Market Size, by End-User Vertical, 2021–2035 (USD Billion) |
  44. TABLE 29 United States Market Size, by Application, 2021–2035 (USD Billion) |
  45. TABLE 30 China Market Size, by Pump Type, 2021–2035 (USD Billion) |
  46. TABLE 31 India Market Size, by End-User Vertical, 2021–2035 (USD Billion) |
  47. TABLE 32 Germany Market Size, by Operating Pressure Range, 2021–2035 (USD Billion) |
  48. TABLE 33 Saudi Arabia Market Size, by Application, 2021–2035 (USD Billion) |
  49. TABLE 34 Competitive Benchmarking Matrix, 2026 |
  50. TABLE 35 Company Profiles – Key Players |
  51. TABLE 36 Recent Developments & Strategic Announcements, 2023–2025 |
  52. TABLE 37 Report Scope & Methodology Summary |
  53. TABLE 38 Detailed Sources & Citations Index |
  54. TABLE 39 Segmentation Quick Reference Matrix |
  55. TABLE 40 Abbreviations & Glossary
  56. 16 LIST OF FIGURES |
  57. FIGURE 1 Market Dynamics – Drivers, Restraints and Opportunities Overview |
  58. FIGURE 2 Industry Value Chain Analysis |
  59. FIGURE 3 Porter's Five Forces Analysis |
  60. FIGURE 4 Global Market Size Trend, 2021–2035 (USD Billion) |
  61. FIGURE 5 Year-over-Year Growth Trajectory, 2022–2035 (%) |
  62. FIGURE 6 Market Share by Pump Type, 2025 vs 2035 (%) |
  63. FIGURE 7 Market Share by Operating Pressure Range, 2025 (%) |
  64. FIGURE 8 Market Share by Application, 2025 vs 2035 (%) |
  65. FIGURE 9 Market Share by End-User Vertical, 2025 (%) |
  66. FIGURE 10 Regional Market Share, 2025 (%) |
  67. FIGURE 11 Regional CAGR Comparison, 2026–2035 (%) |
  68. FIGURE 12 North America Country-Level Share, 2025 (%) |
  69. FIGURE 13 Europe Country-Level Share, 2025 (%) |
  70. FIGURE 14 Asia-Pacific Country-Level Share, 2025 (%) |
  71. FIGURE 15 South America Country-Level Share, 2025 (%) |
  72. FIGURE 16 Middle East & Africa Country-Level Share, 2025 (%) |
  73. FIGURE 17 Competitive Landscape – Estimated Revenue Share Bands, 2026 |
  74. FIGURE 18 Competitive Positioning Matrix – Portfolio Breadth vs Digital Capability |
  75. FIGURE 19 Driver Impact Contribution to Headline CAGR (Directional) |
  76. FIGURE 20 Restraint Impact Drag on Headline CAGR (Directional)

Segmentation Quick Reference

DimensionSub-SegmentsDominant SegmentFastest Growing Segment
By Pump TypeGear Pumps, Piston Pumps, Vane Pumps, Screw Pumps, OthersGear PumpsPiston Pumps
By Operating Pressure Range<3,000 psi, 3,000–5,000 psi, >5,000 psi3,000–5,000 psi>5,000 psi
By ApplicationMobile Hydraulics, Industrial Machinery, Process & EnergyMobile HydraulicsProcess & Energy
By End-User VerticalConstruction, Agriculture, Oil & Gas, Material Handling, Power Generation, Automotive & Transportation, Mining, OthersConstructionPower Generation
By GeographyNorth America, Europe, Asia-Pacific, South America, Middle East & AfricaAsia-PacificMiddle East & Africa


Market Segmentation Overview

By Pump Type

Sub-SegmentKey Trend
Gear PumpsContamination tolerance and low cost sustain dominance in mobile equipment despite slow share erosion
Piston PumpsEfficiency mandates and closed-loop drivetrains drive fastest expansion across all pressure classes
Vane PumpsQuiet operation keeps them entrenched in machine-tool and moulding applications
Screw PumpsGrowth concentrated in marine lubrication and low-pulsation transfer duty
OthersRadial piston and specialty designs serve narrow high-value niches


Product mix is shifting gradually rather than abruptly. Gear architectures retain volume leadership because service networks and inventory systems are built around them, while piston product captures the incremental value created by efficiency regulation and electrified machine platforms.

By Operating Pressure Range

Sub-SegmentKey Trend
<3,000 psiMost exposed to electro-mechanical substitution in light-duty applications
3,000–5,000 psiIndustry volume centre matching standard construction and agricultural specification
>5,000 psiCompact machine design and deep-mining duty push adoption upward with thin competition


Pressure migration is one of the most reliable structural trends in this industry. Machine designers shrink envelopes and reduce weight by raising system pressure, which steadily pulls demand toward the upper band and away from commodity low-pressure product.

By Application

Sub-SegmentKey Trend
Mobile HydraulicsVolume anchor tied to construction, agriculture and material-handling fleet cycles
Industrial MachineryServo-controlled power units replacing constantly running fixed-speed systems
Process & EnergyRenewables, hydrogen and grid-storage installations add new certified duty profiles


Application dynamics separate volume from value. Mobile equipment delivers unit scale and predictable aftermarket revenue, while process and energy work carries longer qualification cycles, higher specification barriers, and correspondingly better pricing power.

By End-User Vertical

Sub-SegmentKey Trend
ConstructionPublic capital formation determines cycle timing more than private demand
AgricultureEmerging-economy mechanisation sustains steady multi-year volume growth
Oil & GasWorkover and pipeline maintenance activity drives replacement demand
Material HandlingWarehouse automation and port throughput expansion lift adoption
Power GenerationTurbine controls and plant auxiliaries expand hydraulic content per megawatt
Automotive & TransportationPress-line modernisation and EV plant construction add capacity demand
MiningShovel, crusher and drill-rig fleets require high-pressure, high-duty equipment
OthersMarine, forestry and aerospace ground support form a stable specialty base


Vertical exposure determines cyclical risk. Suppliers weighted toward construction and mining face amplified swings tied to commodity and stimulus cycles, whereas those with power generation and material handling exposure enjoy smoother, policy-supported demand through 2035.

By Geography

Sub-SegmentKey Trend
North AmericaReshoring construction and oilfield services underpin second-largest regional position
EuropeRegulatory stringency drives premium specification and remanufacturing adoption
Asia-PacificChinese machinery output and Indian mechanisation sustain global leadership
South AmericaCopper and lithium expansion lift mining-linked equipment demand
Middle East & AfricaGiga-projects and mining licences deliver the fastest regional growth


Geographic strategy increasingly turns on service density rather than product cost. Regions with fast-growing installed bases but shallow technical support networks — ASEAN, East Africa, and the Gulf — represent the clearest whitespace for suppliers willing to invest ahead of demand.




Download PDF ×

We do not share your information with anyone. However, we may send you emails based on your report interest from time to time. You may contact us at any time to opt-out.