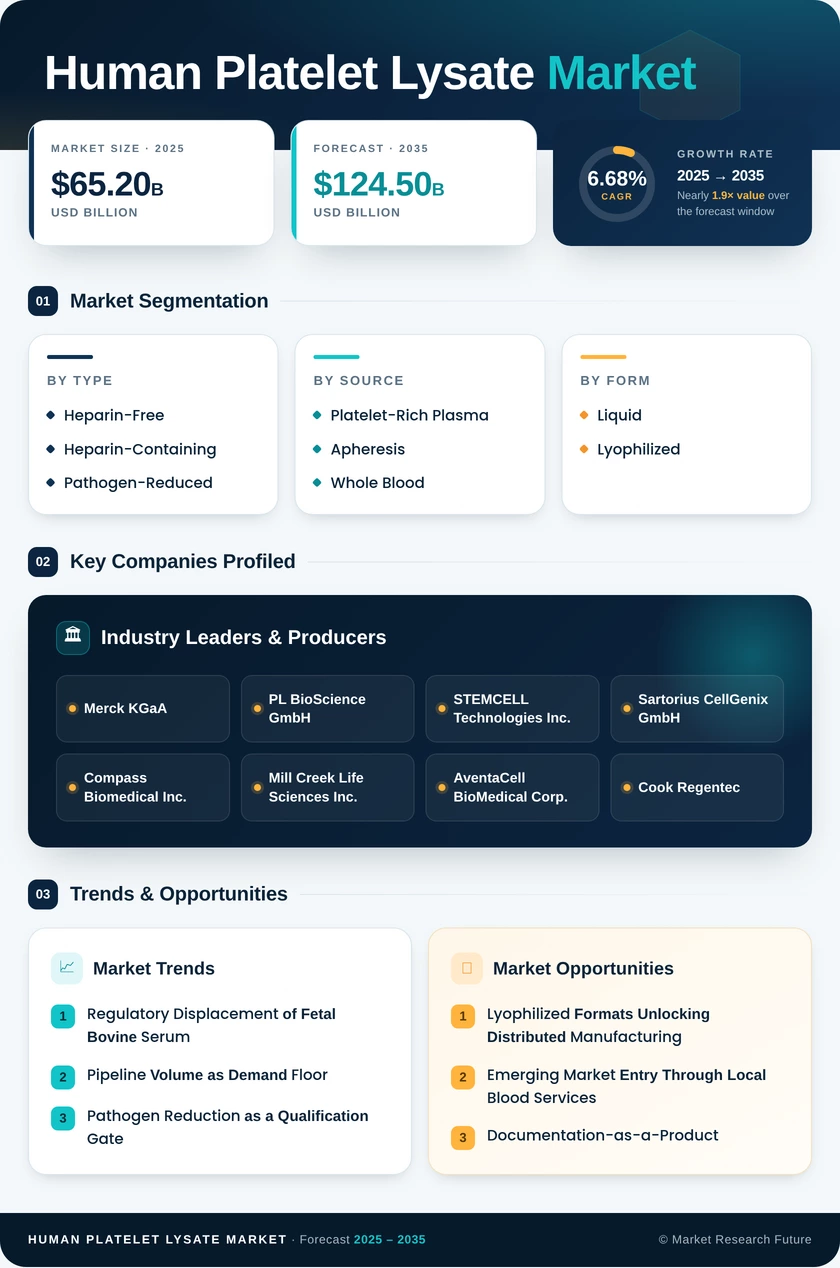
Human Platelet Lysate Market (2026 - 2035)

Human Platelet Lysate Market Research Report By Application (Cell Therapy, Regenerative Medicine, Tissue Engineering, Vaccines Development, Drug Development), By End Use (Pharmaceutical Companies, Academic Research Institutes, Biotechnology Companies, Contract Research Organizations), By Source (Peripheral Blood, Umbilical Cord Blood, Bone Marrow, Platelet Rich Plasma), By Formulation Type (Liquid Formulation, Lyophilized Formulation, Cell Culture Supplement) and By Regional (North America, Europe, South America, Asia Pacific, Middle East and Africa) - Growth & Industry Forecast 2025 To 2035

Forecast Period
2026-2035
CAGR
6.68%
2025 Market Size
USD 65.2 Million
2035 Market Size
USD 124.5 Million
Healthcare ● Updated August 2026 Report ID: MRFR/HC/35200-HCR | Pages: 128 | Author: Satyendra Maurya, Rahul Gotadki
  1. 1 Market Summary |
    1. 1.1 Study Assumptions & Market Definition |
    2. 1.2 Scope of the Study |
    3. 1.3 Research Methodology
  2. 2 Key Report Takeaways |
    1. 2.1 By Product Type |
    2. 2.2 By Application and End User |
    3. 2.3 By Geography
  3. 3 Market Size & Forecast (2021–2035) |
    1. 3.1 Historical Market Size (2021–2024) |
    2. 3.2 Base Year Assessment (2025) |
    3. 3.3 Forecast Market Size (2026–2035) |
    4. 3.4 Year-over-Year Growth Analysis
  4. 4 Driver Impact Analysis |
    1. 4.1 Regulatory Displacement of Fetal Bovine Serum |
    2. 4.2 Pipeline Volume as Demand Floor |
    3. 4.3 Pathogen Reduction as a Qualification Gate |
    4. 4.4 Blood Establishment Economics
  5. 5 Restraints Impact Analysis |
    1. 5.1 Finite Donor Feedstock |
    2. 5.2 Comparability and Switching Cost |
    3. 5.3 Standards Fragmentation
  6. 6 Opportunity Analysis |
    1. 6.1 Lyophilized Formats Unlocking Distributed Manufacturing |
    2. 6.2 Emerging Market Entry Through Local Blood Services |
    3. 6.3 Documentation-as-a-Product |
    4. 6.4 Reserved-Lot and Banking Contracts |
    5. 6.5 Synthetic and Recombinant Adjacency |
    6. 6.6 Industry Value Chain Analysis |
    7. 6.7 Porter's Five Forces Analysis
  7. 7 Regional Market Share & Country-Level Analysis |
    1. 7.1 North America | |
      1. 7.1.1 US | |
      2. 7.1.2 Canada | |
      3. 7.1.3 Mexico |
    2. 7.2 Europe | |
      1. 7.2.1 Germany | |
      2. 7.2.2 UK | |
      3. 7.2.3 France | |
      4. 7.2.4 Italy | |
      5. 7.2.5 Spain | |
      6. 7.2.6 Nordic Countries | |
      7. 7.2.7 Russia | |
      8. 7.2.8 Rest of Europe |
    3. 7.3 Asia-Pacific | |
      1. 7.3.1 China | |
      2. 7.3.2 India | |
      3. 7.3.3 Japan | |
      4. 7.3.4 South Korea | |
      5. 7.3.5 ASEAN | |
      6. 7.3.6 Rest of Asia-Pacific |
    4. 7.4 South America | |
      1. 7.4.1 Brazil | |
      2. 7.4.2 Argentina | |
      3. 7.4.3 Rest of South America |
    5. 7.5 Middle East & Africa | |
      1. 7.5.1 Saudi Arabia | |
      2. 7.5.2 UAE | |
      3. 7.5.3 South Africa | |
      4. 7.5.4 Egypt | |
      5. 7.5.5 Rest of Middle East & Africa
  8. 8 Future Outlook (2026–2035) |
    1. 8.1 Standardization Becomes the Competitive Battleground |
    2. 8.2 Synthetic Supply Enters the Model |
    3. 8.3 Ambient Logistics Reshape Geography |
    4. 8.4 Sustainability Credentials Gain Commercial Weight
  9. 9 Market Segmentation Analysis |
    1. 9.1 By Product Type | |
      1. 9.1.1 Heparin-Free | |
      2. 9.1.2 Heparin-Containing | |
      3. 9.1.3 Pathogen-Reduced |
    2. 9.2 By Source | |
      1. 9.2.1 Apheresis | |
      2. 9.2.2 Whole Blood | |
      3. 9.2.3 Platelet-Rich Plasma |
    3. 9.3 By Form | |
      1. 9.3.1 Liquid | |
      2. 9.3.2 Lyophilized |
    4. 9.4 By Application | |
      1. 9.4.1 Cell and Gene Therapy Manufacturing | |
      2. 9.4.2 Regenerative Medicine | |
      3. 9.4.3 Research and Development | |
      4. 9.4.4 Tissue Engineering | |
      5. 9.4.5 Vaccine Production |
    5. 9.5 By End User | |
      1. 9.5.1 Pharmaceutical and Biotechnology Companies | |
      2. 9.5.2 Academic and Research Institutes | |
      3. 9.5.3 CROs and CDMOs | |
      4. 9.5.4 Hospitals and Cell Therapy Centres
  10. 10 Competitive Landscape |
    1. 10.1 Market Concentration Analysis (2026) |
    2. 10.2 Competitive Benchmarking Matrix |
    3. 10.3 Company Profiles | |
      1. 10.3.1 Merck KGaA | |
      2. 10.3.2 PL BioScience GmbH | |
      3. 10.3.3 STEMCELL Technologies Inc. | |
      4. 10.3.4 Sartorius CellGenix GmbH | |
      5. 10.3.5 Compass Biomedical Inc. | |
      6. 10.3.6 Mill Creek Life Sciences Inc. | |
      7. 10.3.7 AventaCell BioMedical Corp. | |
      8. 10.3.8 Cook Regentec | |
      9. 10.3.9 Lonza Group Ltd. | |
      10. 10.3.10 Trinova Biochem GmbH | |
      11. 10.3.11 BioIVT / ZenBio Inc.
  11. 11 Recent News & Developments (2023–2025)
  12. 12 Report Scope & Methodology |
    1. 12.1 Study Period & Base Year |
    2. 12.2 Data Sources & Citations |
    3. 12.3 Abbreviations
  13. 13 Detailed Sources & Citations
  14. 14 Frequently Asked Questions
  15. 15 LIST OF TABLES |
  16. TABLE 1 Global Human Platelet Lysate Market Size & Forecast, by Revenue (USD Million), 2021–2035 |
  17. TABLE 2 Global Human Platelet Lysate Market — Year-over-Year Growth Analysis, 2021–2035 |
  18. TABLE 3 Driver Impact Analysis Matrix, 2026–2035 |
  19. TABLE 4 Restraint Impact Analysis Matrix, 2026–2035 |
  20. TABLE 5 Global Market Size, by Product Type, 2021–2035 (USD Million) |
  21. TABLE 6 Global Market Size, by Source, 2021–2035 (USD Million) |
  22. TABLE 7 Global Market Size, by Form, 2021–2035 (USD Million) |
  23. TABLE 8 Global Market Size, by Application, 2021–2035 (USD Million) |
  24. TABLE 9 Global Market Size, by End User, 2021–2035 (USD Million) |
  25. TABLE 10 Global Market Size, by Region, 2021–2035 (USD Million) |
  26. TABLE 11 Regional Summary — Share, Value and Growth Metrics, 2025 |
  27. TABLE 12 North America Market Size, by Country, 2021–2035 (USD Million) |
  28. TABLE 13 Europe Market Size, by Country, 2021–2035 (USD Million) |
  29. TABLE 14 Asia-Pacific Market Size, by Country, 2021–2035 (USD Million) |
  30. TABLE 15 South America Market Size, by Country, 2021–2035 (USD Million) |
  31. TABLE 16 Middle East & Africa Market Size, by Country, 2021–2035 (USD Million) |
  32. TABLE 17 North America Market Size, by Product Type, 2021–2035 (USD Million) |
  33. TABLE 18 North America Market Size, by Application, 2021–2035 (USD Million) |
  34. TABLE 19 North America Market Size, by End User, 2021–2035 (USD Million) |
  35. TABLE 20 Europe Market Size, by Product Type, 2021–2035 (USD Million) |
  36. TABLE 21 Europe Market Size, by Application, 2021–2035 (USD Million) |
  37. TABLE 22 Europe Market Size, by End User, 2021–2035 (USD Million) |
  38. TABLE 23 Asia-Pacific Market Size, by Product Type, 2021–2035 (USD Million) |
  39. TABLE 24 Asia-Pacific Market Size, by Application, 2021–2035 (USD Million) |
  40. TABLE 25 Asia-Pacific Market Size, by End User, 2021–2035 (USD Million) |
  41. TABLE 26 South America Market Size, by Product Type, 2021–2035 (USD Million) |
  42. TABLE 27 South America Market Size, by Application, 2021–2035 (USD Million) |
  43. TABLE 28 Middle East & Africa Market Size, by Product Type, 2021–2035 (USD Million) |
  44. TABLE 29 Middle East & Africa Market Size, by Application, 2021–2035 (USD Million) |
  45. TABLE 30 Competitive Benchmarking Matrix, 2026 |
  46. TABLE 31 Company Profiles — Key Players |
  47. TABLE 32 Recent Developments & Strategic Announcements, 2023–2025 |
  48. TABLE 33 Report Scope & Methodology Summary |
  49. TABLE 34 Detailed Sources & Citations
  50. 16 LIST OF FIGURES |
  51. FIGURE 1 Global Human Platelet Lysate Market — Market Dynamics Snapshot (Drivers, Restraints, Opportunities) |
  52. FIGURE 2 Industry Value Chain Analysis — Blood Establishment to End-User Manufacturing |
  53. FIGURE 3 Porter's Five Forces Analysis |
  54. FIGURE 4 Global Market Size Trend, 2021–2035 (USD Million) |
  55. FIGURE 5 Year-over-Year Growth Trend, 2022–2035 (%) |
  56. FIGURE 6 Market Share by Product Type, 2025 vs 2035 (%) |
  57. FIGURE 7 Market Share by Source, 2025 (%) |
  58. FIGURE 8 Market Share by Form, 2025 vs 2035 (%) |
  59. FIGURE 9 Market Share by Application, 2025 (%) |
  60. FIGURE 10 Market Share by End User, 2025 (%) |
  61. FIGURE 11 Regional Revenue Share, 2025 (%) |
  62. FIGURE 12 Regional CAGR Comparison, 2026–2035 (%) |
  63. FIGURE 13 North America Country-Level Share, 2025 (%) |
  64. FIGURE 14 Europe Country-Level Share, 2025 (%) |
  65. FIGURE 15 Asia-Pacific Country-Level Share, 2025 (%) |
  66. FIGURE 16 Competitive Landscape — Estimated Revenue Share Bands, 2026 |
  67. FIGURE 17 Competitive Positioning Matrix — Regulatory Depth vs Production Scale |
  68. FIGURE 18 Driver Impact Weighting Chart, 2026–2035
Share::
Request Free Sample

Segmentation Quick Reference

DimensionSub-SegmentsDominant SegmentFastest Growing Segment
Product TypeHeparin-Free, Heparin-Containing, Pathogen-ReducedHeparin-FreeHeparin-Containing
SourceApheresis, Whole Blood, Platelet-Rich PlasmaPlatelet-Rich PlasmaWhole Blood
FormLiquid, LyophilizedLiquidLyophilized
ApplicationCell and Gene Therapy Manufacturing, Regenerative Medicine, Research and Development, Tissue Engineering, Vaccine ProductionCell and Gene Therapy ManufacturingTissue Engineering
End UserPharmaceutical and Biotechnology Companies, Academic and Research Institutes, CROs and CDMOs, Hospitals and Cell Therapy CentresPharmaceutical and Biotechnology CompaniesHospitals and Cell Therapy Centres
GeographyNorth America, Europe, Asia-Pacific, South America, Middle East & AfricaNorth AmericaAsia-Pacific


Market Segmentation Overview

By Product Type

Sub-SegmentKey Trend
Heparin-FreePreferred for injectable-destined products; removes anticoagulant carryover from release testing
Heparin-ContainingRetains cost advantage and prevents gel formation in specific media systems
Pathogen-ReducedGamma irradiation and UV treatment moving from differentiator to baseline expectation for clinical use


Product tier selection is now a regulatory decision rather than a procurement one. Sponsors entering clinical phases increasingly specify pathogen-reduced, heparin-free material at protocol design stage, which locks supplier choice years ahead of commercial volume.

By Source

Sub-SegmentKey Trend
ApheresisTighter donor pool control and superior traceability documentation
Whole BloodLeukoreduction filter recovery improving yield economics
Platelet-Rich PlasmaLargest installed processing base; established blood establishment workflows


Feedstock sourcing determines both cost structure and traceability depth. Apheresis-derived material commands a premium where regulators demand named-donor documentation, while whole-blood routes are attracting investment as recovery techniques improve.

By Form

Sub-SegmentKey Trend
LiquidDirect use with no reconstitution step; dominant installed workflow
LyophilizedAmbient shipping and extended shelf life enabling distributed manufacturing


By Application

Sub-SegmentKey Trend
Cell and Gene Therapy ManufacturingLargest consumption base, driven by clinical and commercial batch volume
Regenerative MedicineMSC-based programs expanding across orthopaedic and immunomodulatory indications
Research and DevelopmentSteady academic and preclinical demand at research-grade price tiers
Tissue EngineeringFastest growth as scaffold-seeded constructs advance toward clinical use
Vaccine ProductionNiche cell substrate expansion applications


Application mix is migrating from research toward regulated manufacturing. That shift raises average selling price per litre even where volume growth appears modest, because clinical-grade tiers carry substantially different economics.

By End User

Sub-SegmentKey Trend
Pharmaceutical and Biotechnology CompaniesOwn the batch records regulators inspect; anchor demand for documented product
Academic and Research InstitutesGrant-funded, price-sensitive, dominated by research-grade tiers
CROs and CDMOsOutsourced clinical batch production expanding rapidly in Asia-Pacific
Hospitals and Cell Therapy CentresHospital exemption and point-of-care models driving fastest growth


Buyer behaviour diverges sharply across these groups. Pharmaceutical buyers negotiate multi-year reserved-lot contracts; hospital and academic channels purchase in small, irregular volumes where distributor relationships matter more than direct supplier engagement.

By Geography

Sub-SegmentKey Trend
North AmericaDocumentation depth and Drug Master File coverage decide contracts
EuropePharmacopoeial head start and supplier consolidation concentrating share
Asia-PacificFastest growth via regional GMP capacity and technology partnerships
South AmericaResearch-weighted demand constrained by import pricing and cold chain
Middle East & AfricaSovereign programs creating demand ahead of local supply capability


Regional dynamics reflect manufacturing capacity rather than demographics. Asia-Pacific's growth premium rests on capacity build-out and technology partnerships, while European share is increasingly held by a narrowing group of consolidated specialists.




Share::
Request Free Sample
Download PDF ×

We do not share your information with anyone. However, we may send you emails based on your report interest from time to time. You may contact us at any time to opt-out.