ID: MRFR/MED/0577-HCR | February 2021 | Region: Global | 110 pages
Market Scenario
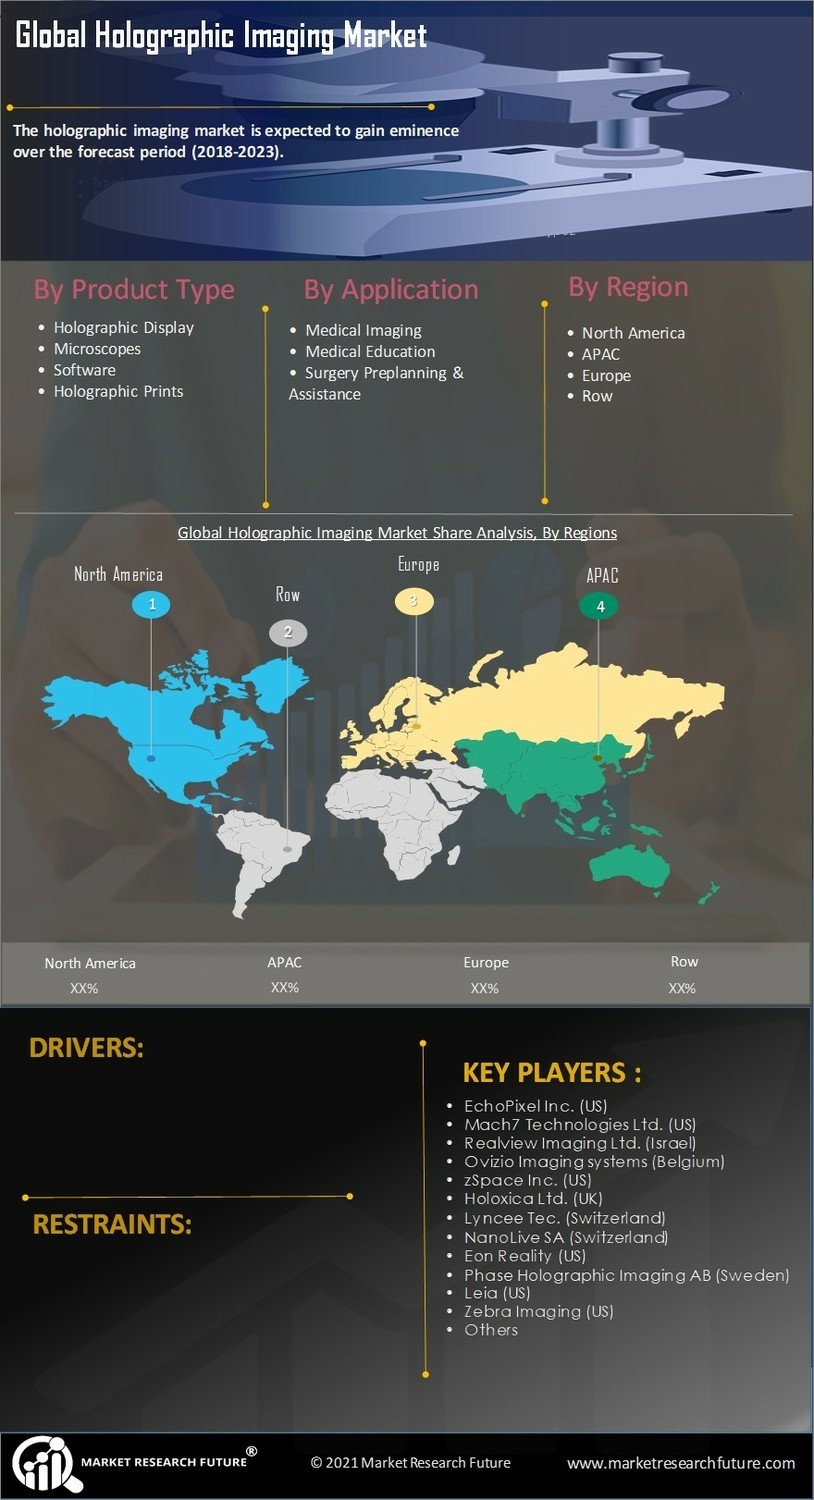
The global holographic imaging market is expected to gain eminence over the forecast period (2018-2023). It is projected that the holographic imaging market is anticipated to register a CAGR of 30% during the forecast period of 2018–2023.
Factors such as growing awareness about the holographic imaging in medical education, medical research, and increase in holography techniques adoption by the academic medical centers, surgeons, and biomedical researchers are driving the growth over the forecast period.
Furthermore, endoscopic holography for high resolution used in non-invasive surgeries coupled with the tools available for the interpretation of interferograms is expected to create significant growth opportunities for players operating in the holographic imaging market. Though, factors such as the high computational cost of processing, the requirement for sophisticated and complicated recording methods, and issues associated with projection under the sunlight, are some of the factor restraining the growth of the market.
Research Methodology
Sources: Annual reports, Press release, White paper, and Company presentation
Regional Market Summary
The Americas dominated the global holographic imaging market over the forecast period owing to the increasing biomedical research initiatives in holographic image technology and adoption of holographic products by research academics centers and laboratories. Brazil holds the considerable share in holographic imaging market share due to increase in preference for the use of holographic imaging technology for medical training and surgeries.
Europe is the second largest market after Americas owing to the increase in research and development activities and new products launching in the near future. For instance, in July 2015, Phase Holographic Imaging entered into a collaboration agreement with the University of California, San Francisco (USCF), to enhance the ongoing skin cancer research process by incorporating Holomonitor. Furthermore, collaborations and partnerships are also expected to be a fueling factor for the global holographic imaging market. For example, in August 2014, Phase Holographic Imaging (PHI) entered into a collaboration agreement with Northeastern University of Boston and provided its Holomonitor technology.
The Asia-Pacific is the fastest growing region for the holographic imaging due increase in population, especially in India and China. Japan holds the largest revenue share in the Asia-Pacific region. China is poised to be the fastest growing market on account of its large manufacturing base, increase in demand for better healthcare infrastructure and changes in the population.
The Middle East and Africa hold the lowest share of the global holographic imaging market due to growing instances of outsourcing the manufacturing of holographic imaging devices are expected to inhibit development costs while focusing on the development of highly advanced technologies.
Key Players
Some of the key players in the global holographic imaging market are EchoPixel, Inc. (US), Mach7 Technologies Ltd. (US), Realview Imaging Ltd. (Israel), Ovizio Imaging systems (Belgium), zSpace, Inc. (US), Holoxica Ltd. (UK), Lyncee Tec. (Switzerland), NanoLive SA (Switzerland), Eon Reality (US), Phase Holographic Imaging AB (Sweden) Leia (US), Zebra Imaging (US), and others.
Segmentation
The global holographic imaging market is segmented on the basis of product type, application, and end-user.
Based on the product type, the global holographic imaging market is classified as holographic display, microscopes, software, holographic prints, and others.
The holographic display segment is divided into laser, touchable, piston, semi-transparent and others. The touchable segment is further divided into segment is further divided into a skin sensor, health patch, others.
Based on the application, the global holographic imaging market is classified into medical imaging, medical education, surgery preplanning & assistance, interventional cardiology, digital intimacy, biomedical research, and others. The medical imaging segment is further divided into ophthalmology, dentistry, urology, otology, orthopedics, and others.
Based on end-user, the global holographic imaging market is classified as pharmaceutical and biotechnology companies, research organizations, academic medical centers, hospitals and clinics, and others.
Intended Audience
Frequently Asked Questions (FAQ) :
The holographic imaging market is predicted to grow at a 30% CAGR between 2018-2023.
North America is predicted to dominate the holographic imaging market.
Growing awareness about holographic imaging and increasing adoption by surgeons and biomedical researchers are boosting market growth.
High computational processing cost, the need for complicated and sophisticated recording techniques, and problems related to projection under sunrays may deter market growth.
Key competitors in the holographic imaging market include Zebra Imaging (US), Leia (US), Phase Holographic Imaging AB (Sweden), Eon Reality (US), NanoLive SA (Switzerland), Lyncee Tec. (Switzerland), Holoxica Ltd. (UK), zSpace, Inc. (US), Ovizio Imaging systems (Belgium), Realview Imaging Ltd. (Israel), Mach7 Technologies Ltd. (US), and EchoPixel, Inc. (US).
Table of Content
Report Prologue
Market Introduction
2.1 Definition
2.2 Scope of the Study
2.2.1 Research Objective
2.2.2 Assumptions
2.2.3 Limitations
Research Methodology
3.1 Introduction
3.2 Primary Research
3.3 Secondary Research
3.4 Market Size Estimation
Market Dynamics
4.1 Drivers
4.2 Restraints
4.3 Opportunities
4.4 Challenges
4.5 Macroeconomic Indicators
4.6 Technology Trends & Assessment
Market Factor Analysis
5.1 Porter’s Five Forces Analysis
5.1.1 Bargaining Power of Suppliers
5.1.2 Bargaining Power of Buyers
5.1.3 Threat of New Entrants
5.1.4 Threat of Substitutes
5.1.5 Intensity of Rivalry
5.2 Value Chain Analysis
5.3 Investment Feasibility Analysis
5.4 Pricing Analysis
Global Holographic Imaging Market, by Product Type
6.1 Introduction
6.2 Holographic Display
6.2.1 Laser
6.2.2 Touchable
6.2.2.1 Skin Sensor
6.2.2.1 Health Patch
6.2.2.3 Others
6.2.3 Piston
6.2.4 Semi-transparent
6.3 Microscopes
Market Estimates & Forecast, 2020-2027
Market Estimates & Forecast, by Region/Country, 2020-2027
6.4 Software
Market Estimates & Forecast, 2020-2027
Market Estimates & Forecast, by Region/Country, 2020-2027
6.6 Holographic Prints
Market Estimates & Forecast, 2020-2027
Market Estimates & Forecast, by Region/Country, 2020-2027
6.7 Others
Market Estimates & Forecast, 2020-2027
Market Estimates & Forecast, by Region/Country, 2020-2027
Global Holographic Imaging Market, by Application
7.1 Introduction
7.2 Medical Imaging
7.2.1 Ophthalmology
7.2.2 Dentistry
7.2.3 Urology
7.2.4 Otology
7.2.5 Orthopedics
7.2.6 Others
7.3 Medical Education
Market Estimates & Forecast, 2020-2027
Market Estimates & Forecast, by Region/Country, 2020-2027
7.4 Surgery Preplanning & Assistance
Market Estimates & Forecast, 2020-2027
Market Estimates & Forecast, by Region/Country, 2020-2027
7.5 Interventional Cardiology
Market Estimates & Forecast, 2020-2027
Market Estimates & Forecast, by Region/Country, 2020-2027
7.6 Digital Intimacy
Market Estimates & Forecast, 2020-2027
Market Estimates & Forecast, by Region/Country, 2020-2027
7.7 Biomedical Research
Market Estimates & Forecast, 2020-2027
Market Estimates & Forecast, by Region/Country, 2020-2027
7.8 Others
Global Holographic Imaging Market, by End-User
8.1 Introduction
8.2 Pharmaceutical & Biotechnology companies
Market Estimates & Forecast, 2020-2027
Market Estimates & Forecast, by Region/Country, 2020-2027
8.3 Research organizations
Market Estimates & Forecast, 2020-2027
Market Estimates & Forecast, by Region/Country, 2020-2027
8.4 Academic medical centers
Market Estimates & Forecast, 2020-2027
Market Estimates & Forecast, by Region/Country, 2020-2027
8.4 Hospitals & Clinics
Market Estimates & Forecast, 2020-2027
Market Estimates & Forecast, by Region/Country, 2020-2027
8.5 Others
Market Estimates & Forecast, 2020-2027
Market Estimates & Forecast, by Region/Country, 2020-2027
10 Global Holographic Imaging Market, by Region
10.1 Introduction
10.2 Americas
Market Estimates & Forecast, by Region, 2020-2027
Market Estimates & Forecast, by Product Type, 2020-2027
Market Estimates & Forecast, by Application, 2020-2027
Market Estimates & Forecast, by End-User, 2020-2027
10.2.1 North America
Market Estimates & Forecast, by Product Type, 2020-2027
Market Estimates & Forecast, by Application, 2020-2027
Market Estimates & Forecast, by End-User, 2020-2027
10.2.1.1 US
Market Estimates & Forecast, by Product Type, 2020-2027
Market Estimates & Forecast, by Application, 2020-2027
Market Estimates & Forecast, by End-User, 2020-2027
10.2.1.2 Canada
Market Estimates & Forecast, by Product Type, 2020-2027
Market Estimates & Forecast, by Application, 2020-2027
Market Estimates & Forecast, by End-User, 2020-2027
10.2.2 South America
Market Estimates & Forecast, by Product Type, 2020-2027
Market Estimates & Forecast, by Application, 2020-2027
Market Estimates & Forecast, by End-User, 2020-2027
10.3 Europe
Market Estimates & Forecast, by Region, 2020-2027
Market Estimates & Forecast, by Product Type, 2020-2027
Market Estimates & Forecast, by Application, 2020-2027
Market Estimates & Forecast, by End-User, 2020-2027
10.3.1 Western Europe
Market Estimates & Forecast, by Product Type, 2020-2027
Market Estimates & Forecast, by Application, 2020-2027
Market Estimates & Forecast, by End-User, 2020-2027
10.3.1.1 Germany
Market Estimates & Forecast, by Product Type, 2020-2027
Market Estimates & Forecast, by Application, 2020-2027
Market Estimates & Forecast, by End-User, 2020-2027
10.3.1.2 France
Market Estimates & Forecast, by Product Type, 2020-2027
Market Estimates & Forecast, by Application, 2020-2027
Market Estimates & Forecast, by End-User, 2020-2027
10.3.1.3 UK
Market Estimates & Forecast, by Product Type, 2020-2027
Market Estimates & Forecast, by Application, 2020-2027
Market Estimates & Forecast, by End-User, 2020-2027
10.3.1.4 Italy
Market Estimates & Forecast, by Product Type, 2020-2027
Market Estimates & Forecast, by Application, 2020-2027
Market Estimates & Forecast, by End-User, 2020-2027
10.3.1.5 Spain
Market Estimates & Forecast, by Product Type, 2020-2027
Market Estimates & Forecast, by Application, 2020-2027
Market Estimates & Forecast, by End-User, 2020-2027
10.3.1.6 Rest of Western Europe
Market Estimates & Forecast, by Product Type, 2020-2027
Market Estimates & Forecast, by Application, 2020-2027
Market Estimates & Forecast, by End-User, 2020-2027
10.3.2 Eastern Europe
Market Estimates & Forecast, by Product Type, 2020-2027
Market Estimates & Forecast, by Application, 2020-2027
Market Estimates & Forecast, by End-User, 2020-2027
10.4 Asia-Pacific
Market Estimates & Forecast, by Country, 2020-2027
Market Estimates & Forecast, by Product Type, 2020-2027
Market Estimates & Forecast, by Application, 2020-2027
Market Estimates & Forecast, by End-User, 2020-2027
10.4.1 Japan
Market Estimates & Forecast, by Product Type, 2020-2027
Market Estimates & Forecast, by Application, 2020-2027
Market Estimates & Forecast, by End-User, 2020-2027
10.4.2 China
Market Estimates & Forecast, by Product Type, 2020-2027
Market Estimates & Forecast, by Application, 2020-2027
Market Estimates & Forecast, by End-User, 2020-2027
10.4.3 India
Market Estimates & Forecast, by Product Type, 2020-2027
Market Estimates & Forecast, by Application, 2020-2027
Market Estimates & Forecast, by End-User, 2020-2027
10.4.4 Australia
Market Estimates & Forecast, by Product Type, 2020-2027
Market Estimates & Forecast, by Application, 2020-2027
Market Estimates & Forecast, by End-User, 2020-2027
10.4.5 Republic of Korea
Market Estimates & Forecast, by Product Type, 2020-2027
Market Estimates & Forecast, by Application, 2020-2027
Market Estimates & Forecast, by End-User, 2020-2027
10.4.6 Rest of Asia-Pacific
Market Estimates & Forecast, by Product Type, 2020-2027
Market Estimates & Forecast, by Application, 2020-2027
Market Estimates & Forecast, by End-User, 2020-2027
10.5 The Middle East & Africa
Market Estimates & Forecast, by Region, 2020-2027
Market Estimates & Forecast, by Product Type, 2020-2027
Market Estimates & Forecast, by Application, 2020-2027
Market Estimates & Forecast, by End-User, 2020-2027
10.5.1 Middle East
Market Estimates & Forecast, by Product Type, 2020-2027
Market Estimates & Forecast, by Application, 2020-2027
Market Estimates & Forecast, by End-User, 2020-2027
10.5.2 Africa
Market Estimates & Forecast, by Product Type, 2020-2027
Market Estimates & Forecast, by Application, 2020-2027
Market Estimates & Forecast, by End-User, 2020-2027
11 Company Landscape
11.1 Introduction
11.2 Market Share Analysis
11.3 Key Development & Strategies
12 Company Profiles
12.1 EON Reality
12.1.1 Company Overview
12.1.2 Product Overview
12.1.3 Financials
12.1.4 SWOT Analysis
12.2 Holoxica Limited
12.2.1 Company Overview
12.2.2 Product Overview
12.2.3 Financial Overview
12.2.4 Key Developments
12.2.5 SWOT Analysis
12.3 Mach7 Technologies Limited
12.3.1 Company Overview
12.3.2 Product Overview
12.3.3 Financial Overview
12.3.4 Key Development
12.3.5 SWOT Analysis
12.4 Phase Holographic Imaging
12.4.1 Company Overview
12.4.2 Product/Business Segment Overview
12.4.3 Financial Overview
12.4.4 Key Development
12.4.5 SWOT Analysis
12.5 Ovizio Imaging Systems NVSA
12.5.1 Company Overview
12.5.2 Product Overview
12.5.3 Financial overview
12.5.4 Key Developments
12.6 Zebra Imaging, Inc.
12.6.1 Company Overview
12.6.2 Product Overview
12.6.3 Financial Overview
12.6.4 Key Developments
12.7 Nanolive SA
12.7.1 Overview
12.7.2 Product Overview
12.7.3 Financials
12.7.4 Key Developments
12.7.5 SWOT Analysis
12.8 RealView Imaging Ltd.
12.8.1 Overview
12.8.2 Product Overview
12.8.3 Financials
12.8.4 Key Developments
12.8.5 SWOT Analysis
12.9 EchoPixel, Inc.
12.9.1 Overview
12.9.2 Product Overview
12.9.3 Financials
12.9.4 Key Developments
12.9.5 SWOT Analysis
12.10 Lyncee Tec SA
12.10.1 Overview
12.10.2 Product Overview
12.10.3 Financials
12.10.4 Key Developments
12.10.5 SWOT Analysis
12.11 zSpace, Inc.
12.11.1 Overview
12.11.2 Product Overview
12.11.3 Financials
12.11.4 Key Developments
12.11.5 SWOT Analysis
12.12 Musion Das Hologram Ltd.
12.12.1 Overview
12.12.2 Product Overview
12.12.3 Financials
12.12.4 Key Developments
12.12.5 SWOT Analysis
12.13 Provision Holdings Inc.
12.13.1 Overview
12.13.2 Product Overview
12.13.3 Financials
12.13.4 Key Developments
12.13.5 SWOT Analysis
12.14 Qualcomm
12.14.1 Overview
12.14.2 Product Overview
12.14.3 Financials
12.14.4 Key Developments
12.14.5 SWOT Analysis
12.15 Others
13 Appendix
LIST OF TABLES
Table 1 Holographic imaging Industry Synopsis, 2020-2027
Table 2 Global Holographic imaging Market Estimates and Forecast, 2020-2027, (USD Million)
Table 3 Global Holographic imaging Market, by Region, 2020-2027, (USD Million)
Table 4 Global Holographic imaging Market, by Product Type, 2020-2027, (USD Million)
Table 5 Global Holographic imaging Market, by Application, 2020-2027, (USD Million)
Table 6 Global Holographic imaging Market, by End-Users, 2020-2027, (USD Million)
Table 7 North America Holographic imaging Market, by Product Type, 2020-2027, (USD Million)
Table 8 North America Holographic imaging Market, by Application, 2020-2027, (USD Million)
Table 9 North America Holographic imaging Market, by End-Users, 2020-2027, (USD Million)
Table 10 US Holographic imaging Market, by Product Type, 2020-2027, (USD Million)
Table 11 US Holographic imaging Market, by Application, 2020-2027, (USD Million)
Table 12 US Holographic imaging Market, by End-Users, 2020-2027, (USD Million)
Table 13 Canada Holographic imaging Market, by Product Type, 2020-2027, (USD Million)
Table 14 Canada Holographic imaging Market, by Application, 2020-2027, (USD Million)
Table 15 Canada Holographic imaging Market, by End-Users, 2020-2027, (USD Million)
Table 16 South America Holographic imaging Market, by Product Type, 2020-2027, (USD Million)
Table 17 South America Holographic imaging Market, by End-Users, 2020-2027, (USD Million)
Table 18 Europe Holographic imaging Market, by Product Type, 2020-2027, (USD Million)
Table 19 Europe Holographic imaging Market, by End-Users, 2020-2027, (USD Million)
Table 20 Western Europe Holographic imaging Market, by Product Type, 2020-2027, (USD Million)
Table 21 Western Europe Holographic imaging Market, by End-Users, 2020-2027, (USD Million)
Table 22 Eastern Europe Holographic imaging Market, by Product Type, 2020-2027, (USD Million)
Table 23 Eastern Europe Holographic imaging Market, by Biomaterial, 2020-2027, (USD Million)
Table 24 Eastern Europe Holographic imaging Market, by End-Users, 2020-2027, (USD Million)
Table 25 Asia-Pacific Holographic imaging Market, by Product Type, 2020-2027, (USD Million)
Table 26 Asia-Pacific Holographic imaging Market, by End-Users, 2020-2027, (USD Million)
Table 27 Middle East & Africa Holographic imaging Market, by Product Type, 2020-2027, (USD Million
Table 28 Middle East & Africa Holographic Imaging Market, by Application, 2020-2027, (USD Million)
Table 29 Middle East & Africa Holographic imaging Market, by End-Users, 2020-2027, (USD Million)
LIST OF FIGURES
Figure 1 Research Process
Figure 2 Segmentation for Global Holographic imaging Market
Figure 3 Segmentation Market Dynamics for Holographic imaging Market
Figure 4 Global Holographic imaging Market Share, by Product Type 2020
Figure 5 Global Holographic imaging Market Share, by Application 2020
Figure 6 Global Holographic imaging Market Share, by End-Users, 2020
Figure 7 Global Holographic imaging Market Share, by Region, 2020
Figure 8 North America Holographic imaging Market Share, by Country, 2020
Figure 9 Europe Holographic imaging Market Share, by Country, 2020
Figure 10 Asia-Pacific Holographic imaging Market Share, by Country, 2020
Figure 11 Middle East & Africa Holographic imaging Market Share, by Country, 2020
Figure 12 Global Holographic imaging Market: Company Share Analysis, 2020 (%)
Figure 13 EON Reality: Key Financials
Figure 14 EON Reality: Segmental Revenue
Figure 15 EON Reality: Geographical Revenue
Figure 16 Holoxica Limited: Key Financials
Figure 17 Holoxica Limited: Segmental Revenue
Figure 18 Holoxica Limited: Geographical Revenue
Figure 19 Mach7 Technologies Limited: Key Financials
Figure 20 Mach7 Technologies Limited: Segmental Revenue
Figure 21 Mach7 Technologies Limited: Geographical Revenue
Figure 22 Phase Holographic Imaging: Key Financials
Figure 23 Phase Holographic Imaging: Segmental Revenue
Figure 24 Phase Holographic Imaging: Geographical Revenue
Figure 25 Ovizio Imaging Systems NVSA: Key Financials
Figure 26 Ovizio Imaging Systems NVSA: Segmental Revenue
Figure 27 Ovizio Imaging Systems NVSA. Geographical Revenue
Figure 28 Zebra Imaging, Inc. Key Financials
Figure 29 Zebra Imaging, Inc. Segmental Revenue
Figure 31 Zebra Imaging, Inc. Geographical Revenue