Hearth Market Overview:
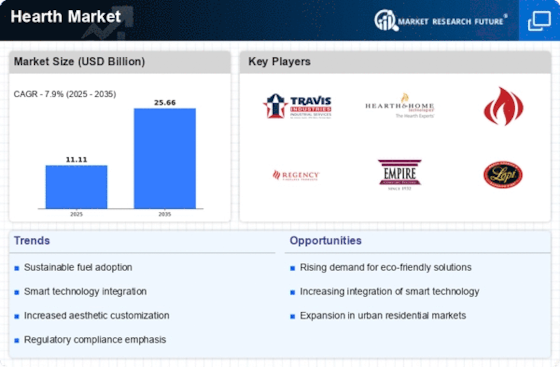
As per MRFR analysis, the Hearth Market Size was estimated at 4.07 (USD billion) in 2023. The Hearth Market is expected to grow from 4.23 (USD billion) in 2024 to 6.4 (USD billion) by 2035. The Hearth Market CAGR (growth rate) is expected to be around 3.84% during the forecast period (2025 - 2035).
Key Hearth Market Trends Highlighted
Significant changes in the Hearth Market are being driven by both technological advancements and changing customer tastes. Energy-efficient and environmentally friendly hearth choices are becoming more and more popular as homeowners look for more comprehensive heating and ambiance solutions. Advanced materials like bioethanol fireplaces and high-efficiency gas logs are becoming more popular.
Customers are choosing sustainable heating options as a result of growing environmental consciousness, which is driving up demand for goods that use renewable energy sources. The growing importance of home comfort and the renewed interest in house remodeling are important market factors.
Especially in areas with colder climates, a lot of people are spending money on hearth solutions to improve their living areas. Due to their ability to create welcoming environments for gatherings, outdoor fireplaces and fire pits are also becoming more and more popular as outdoor living areas become more popular.
Additionally, smart hearth technologies that appeal to tech-savvy customers because of their ease and control are made possible by digital breakthroughs. Expanding into emerging economies, where urbanization and increased disposable incomes are generating a new client base, is one opportunity to seize.
Manufacturers might concentrate on customizing goods to satisfy the distinct tastes of various cultural groups throughout the world. According to recent trends, consumers are prioritizing design and functionality customisation, which is propelling innovation in product offerings.
In conclusion, the Hearth Market is developing as a result of a confluence of consumer demand for sustainable products, improved home settings, and technology improvements, setting the stage for future expansion and growth in the industry.

Source: Primary Research, Secondary Research, MRFR Database and Analyst Review
Hearth Market Drivers
Growing Demand for Energy-efficient Heating Solutions
The Hearth Market is witnessing a surge in demand for energy-efficient heating solutions. This shift is driven by increasing consumer awareness regarding energy conservation and the rising costs of conventional energy sources.
According to the International Energy Agency, energy efficiency improvements accounted for around 30 percent of the global energy demand reduction over the last decade. This trend indicates that more consumers are opting for products that utilize less energy while providing the same level of comfort.
Initiatives by the Global Alliance for Energy Productivity aim to enhance energy saving by promoting advanced heating technologies and financial incentives in various regions, leading to greater investments in the hearth market.
Such organizations play a crucial role in shaping consumer preferences toward energy-efficient hearth solutions, propelling market growth. As consumers continue to seek sustainable options, the Hearth Market is expected to benefit significantly from this paradigm shift.
Urbanization and Increasing Residential Construction
Urbanization is a key driver influencing the Hearth Market. Over the last two decades, urban areas have significantly expanded, with the United Nations projecting that by 2050, nearly 68 percent of the world’s population will reside in urban settings.
This increase is resulting in higher residential construction rates, particularly in developing regions. The World Bank indicates that 1.6 billion people lack adequate housing, thus amplifying the need for more residential development.
This expansion leads to a growing installation of hearth products like fireplaces, stoves, and heaters as homeowners seek to enhance both aesthetic appeal and functionality. Consequently, urbanization not only drives demand for new homes but also incorporates hearth products, impacting the overall growth and development of the Hearth Market.
Rise in Eco-friendly and Renewable Heating Technologies
The Hearth Market is increasingly embracing eco-friendly and renewable heating technologies due to a collective global shift towards sustainability. Over recent years, significant governmental push and incentives have been directed toward renewable energy sources, with initiatives like the Paris Agreement aiming to curb carbon emissions.
The International Renewable Energy Agency reported that the renewable energy sector employed over 11 million people globally as of 2023, indicating the industry's rapid growth. Both governmental policies and private sector initiatives are leading consumers to adopt eco-friendly heating alternatives, such as biomass and solar-fueled heating systems.
As these technologies become mainstream, the Hearth Market is poised for growth, providing innovative solutions aligned with consumers' demand for environmentally responsible heating options.
Hearth Market Segment Insights:
Hearth Market Type Insights
The Hearth Market exhibited significant diversity across its various types, each contributing unique characteristics to the overall landscape. Among these types, Gas Hearths were noteworthy, valued at 1.3 USD billion in 2024, and forecasted to grow to 2.0 USD billion by 2035, showcasing their appeal due to ease of use, efficiency, and lower emissions compared to traditional options.
Wood Hearths also held a significant place, with a valuation of 1.0 USD billion in 2024 and projected to increase to 1.4 USD billion by 2035. This segment's popularity was attributed to the aesthetic and nostalgic value of traditional wood-burning, appealing particularly in rural and suburban areas where natural resources were readily available.
Electric Hearths represented another vital segment, valued at 1.2 USD billion in 2024 and expected to reach 1.8 USD billion by 2035, gained traction due to their convenience and minimal environmental impact. They catered particularly to urban dwellers seeking an easy and clean heating solution.
Pellet Hearths, while generating a smaller revenue of 0.73 USD billion in 2024, are anticipated to grow to 1.2 USD billion by 2035, highlighting their role in the renewable energy movement and emphasizing efficiency.
The rising appeal of environmentally conscious fuel options fostered significant growth in this segment, further diversifying the Hearth Market segmentation. The interplay among these segments reflected broader trends in energy consumption, shifting towards sustainable and efficient heating solutions.
As the market evolves, understanding the different segments within the Hearth Market not only reveals consumer preferences but also charts the trajectory of the industry in response to economic and environmental challenges.

Source: Primary Research, Secondary Research, MRFR Database and Analyst Review
Hearth Market Fuel Source Insights
The Hearth Market, especially within the Fuel Source segment, is showing promising growth as it evolves with changing consumer preferences and environmental concerns. The segmentation of fuel sources includes Natural Gas, Propane, Wood, and Electricity, each holding unique significance.
Natural Gas is rapidly gaining favor for its efficient combustion and lower emissions, making it a popular choice among environmentally conscious consumers. Propane remains significant for its versatility and portability, contributing to a robust market share as it fuels many outdoor and portable hearth appliances.
Wood, on the other hand, appeals to traditionalists and those seeking a rustic aesthetic, often found in rural areas where wood availability is high. Electricity is also gaining traction due to advancements in electric heating technologies, offering convenience and ease of use.
As trends lean towards sustainability and energy efficiency, the Hearth Market is poised for substantial growth, with various fuel sources playing critical roles in shaping consumer choices and driving market dynamics.
Hearth Market Application Insights
The market dynamics are shaped by increasing demand across key segments such as Residential, Commercial, and Industrial. The Residential application remains significant due to rising home improvement and renovation trends, where homeowners invest in efficient and aesthetic heating solutions.
The Commercial sector also plays a vital role as businesses seek to enhance ambiance and comfort for customers while achieving energy efficiency. Meanwhile, the Industrial application, though not dominating, is crucial as it supports various manufacturing processes where heat generation is necessary.
The market is attracting attention owing to innovations in technology and sustainable solutions amid growing environmental concerns. Additionally, the government's push for energy-efficient policies globally promotes the adoption of hearth products, further enhancing the overall Hearth Market revenue.
Thus, understanding the Hearth Market segmentation is essential for stakeholders aiming to leverage potential growth opportunities across these applications.
Hearth Market Control Type Insights
The Hearth Market displays diverse dynamics within its Control Type segment. This segment includes various categories such as Manual Control, Remote Control, and Smart Control, each catering to distinct consumer preferences and technological advancements.
Manual Control remains a foundational choice for users who appreciate traditional functionality, whereas Remote Control has garnered popularity for its ease and convenience. The growing trend of Smart Control reflects an increasing consumer shift towards connected homes, offering advanced features like app integration and voice commands.
These trends highlight the importance of innovation and user experience in the Hearth Market, positioning Smart Control as a dominant player that aligns with the evolving needs for automation and energy efficiency.
Collectively, these diverse control mechanisms not only enhance user engagement but also play a crucial role in the overall revenue generation of the market. Market growth is attributed to rising consumer awareness about home aesthetics and energy conservation, with robust opportunities emerging from advancements in technology and increasing urbanization globally.
Hearth Market Regional Insights
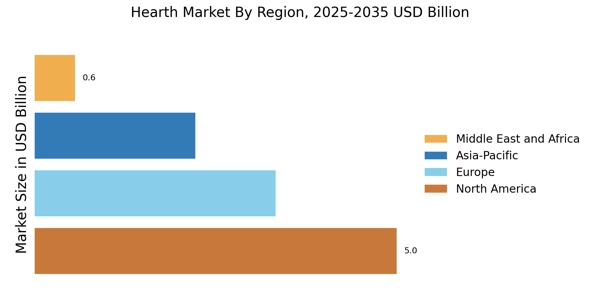
The Hearth Market revenue showcased a diverse segmentation across various regions, with North America leading the pack. Valued at 1.6 USD billion in 2024, North America is expected to increase to 2.12 USD billion by 2035, showcasing its majority holding in the market.
Europe, coming in next, was valued at 1.24 USD billion in 2024 and projected at 1.73 USD billion in 2035, driven by increasing residential and commercial adoption of efficient hearth solutions. South America’s market, while smaller, valued at 0.3 USD billion in 2024 and expected to grow to 0.45 USD billion by 2035, indicates a growing trend of energy efficiency and aesthetic appeal in homes.
The Asia Pacific region had significant growth potential, with values rising from 0.78 USD billion in 2024 to 1.0 USD billion in 2035, likely fueled by urbanization and changing consumer lifestyles. The Middle East and Africa segment, valued at 0.31 USD billion in 2024 and projected at 0.4 USD billion by 2035, reflected an emerging market influenced by climate considerations and home design trends.
Overall, the Hearth Market statistics highlighted regional variations, with North America clearly dominating due to its advanced infrastructure and consumer demand for higher-quality hearth products.

Source: Primary Research, Secondary Research, MRFR Database and Analyst Review
Hearth Market Key Players and Competitive Insights:
The Hearth Market encompasses a vast array of sectors, focusing primarily on baked goods and bread products, attracting considerable attention from various competitors striving to establish a significant market presence. This market is characterized by an increasing consumer demand for high-quality baked goods, leading to a surge in product innovations and diversification of offerings.
Companies within this space leverage various marketing strategies, including organic growth and strategic partnerships, to enhance their competitive edge. Understanding the dynamics of this market involves analyzing the strengths and weaknesses of significant players while assessing their strategies to cater to evolving consumer preferences and market trends.
Flowers Foods has successfully positioned itself within the Hearth Market due to its strong brand recognition and extensive product portfolio. The company offers a broad range of bakery products, including breads, rolls, and snacks, catering to diverse consumer preferences across various segments.
Flowers Foods benefits from a well-established distribution network that spans both domestic and international markets, allowing it to maintain a competitive advantage in terms of accessibility.
The company’s dedication to product quality and innovation, alongside its robust supply chain management, has enabled it to secure a loyal customer base while continuously adapting to market trends, thus reinforcing its presence in the global arena.
Unilever stands as a formidable player within the Hearth Market, driven by its extensive portfolio of brands that includes several established names in the baked goods segment. The company focuses on offering nutritional and convenience-driven products, which resonates well with modern consumers.
With a strong emphasis on sustainability and ethical sourcing, Unilever has fortified its market presence by winning over environmentally conscious consumers. Its continual commitment to research and development allows for the introduction of innovative products that align with consumer desires.
Additionally, Unilever's strategic mergers and acquisitions have facilitated its expansion into new markets and segments, further solidifying its position within the global landscape. Through its investment in technology and marketing initiatives, Unilever continues to enhance its brand visibility and maintain competitive strength in the ever-evolving Hearth Market.
Key Companies in the Hearth Market Include:
-
Flowers Foods
-
Unilever
-
Mondelez International
-
Bunge Limited
-
Mars
-
McCormick & Company
-
Conagra Brands
-
Nestle
-
Danone
-
CocaCola
-
General Mills
-
Associated British Foods
-
Kraft Heinz
-
The Kellogg Company
-
PepsiCo
Hearth Market Developments
Under its main brands, which include Banquet, Birds Eye, Marie Callender's, and Dolly Parton's regional comfort food line, Conagra Brands unveiled over 50 new frozen food products in June 2025, including single-serve meals, vegetable sides, and plant-based alternatives.
Conagra made its debut at the NACS convenience store trade expo in June 2024 with more than 50 snacks and frozen goods, including its new FATTY smoked meat stick line, which was introduced in October 2024. In an effort to cater to smaller homes, Flowers Foods launched its 2025 product line in April 2025, including new healthier options like multigrain loaves, sandwich rolls, keto hot dog buns, and micro breads.
Targeting health-conscious consumers, Flowers introduced 11 creative new baked goods in April 2025 under the Nature's Own, Dave's Killer Bread, Wonder, and Tastykake brands. Flowers extended its "Bakery of the Future" initiative to 17 additional bakeries in February 2024, bringing the total number of locations implementing cutting-edge smart-baking technologies to 32 out of 46.
Hearth Market Segmentation Insights
-
Hearth Market Type Outlook
-
Gas Hearths
-
Wood Hearths
-
Electric Hearths
-
Pellet Hearths
-
Hearth Market Fuel Source Outlook
-
Natural Gas
-
Propane
-
Wood
-
Electricity
-
Hearth Market Application Outlook
-
Residential
-
Commercial
-
Industrial
-
Hearth Market Control Type Outlook
-
Manual Control
-
Remote Control
-
Smart Control
-
Hearth Market Regional Outlook
-
North America
-
Europe
-
South America
-
Asia Pacific
-
Middle East and Africa
Report Attribute/Metric
|
Details
|
Market Size 2023
|
4.07 (USD billion)
|
Market Size 2024
|
4.23 (USD billion)
|
Market Size 2035
|
6.4 (USD billion)
|
Compound Annual Growth Rate (CAGR)
|
3.84% (2025 - 2035)
|
Report Coverage
|
Revenue Forecast, Competitive Landscape, Growth Factors, and Trends
|
Base Year
|
2024
|
Market Forecast Period
|
2025 - 2035
|
Historical Data
|
2019 - 2024
|
Market Forecast Units
|
USD billion
|
Key Companies Profiled
|
Flowers Foods, Unilever, Mondelez International, Bunge Limited, Mars, McCormick & Company, Conagra Brands, Nestle, Danone, Coca-Cola, General Mills, Associated British Foods, Kraft Heinz, The Kellogg Company, PepsiCo
|
Segments Covered
|
Type, Fuel Source, Application, Control Type, Regional
|
Key Market Opportunities
|
Increasing demand for energy-efficient solutions, Rising popularity of smart home integration, Expansion in emerging markets, Growth in eco-friendly heating alternatives, Technological advancements in design and functionality
|
Key Market Dynamics
|
rising energy costs, increasing environmental awareness, innovative heating technologies, regulatory standards and compliance, growing demand for home improvement
|
Countries Covered
|
North America, Europe, APAC, South America, MEA
|
Frequently Asked Questions (FAQ):
The Hearth Industry was valued at 4.23 USD billion in 2024.
By 2035, the Hearth Industry is projected to reach a value of 6.4 USD billion.
The expected CAGR for the Hearth Market from 2025 to 2035 is 3.84%.
North America was the largest market share, valued at 1.6 USD billion in 2024.
The market value for Gas Hearths is anticipated to reach 2.0 USD billion by 2035.
Major players include Flowers Foods, Unilever, Mondelez International, and Nestle, among others.
The European Hearth Market is expected to be valued at 1.73 USD billion in 2035.
In 2024, the market size for Wood Hearths was 1.0 USD billion.
The market is driven by increasing demand for home heating solutions and innovation in hearth technology.
The market may face challenges such as regulatory changes and environmental concerns related to emissions.
TABLE OF CONTENTS
1. EXECUTIVE SUMMARY
1.1. Market Overview
1.2. Key Findings
1.3. Market Segmentation
1.4. Competitive Landscape
1.5. Challenges and Opportunities
1.6. Future Outlook
2. MARKET INTRODUCTION
2.1. Definition
2.2. Scope of the study
2.2.1. Research Objective
2.2.2. Assumption
2.2.3. Limitations
3. RESEARCH METHODOLOGY
3.1. Overview
3.2. Data Mining
3.3. Secondary Research
3.4. Primary Research
3.4.1. Primary Interviews and Information Gathering Process
3.4.2. Breakdown of Primary Respondents
3.5. Forecasting Model
3.6. Market Size Estimation
3.6.1. Bottom-Up Approach
3.6.2. Top-Down Approach
3.7. Data Triangulation
3.8. Validation
4. MARKET DYNAMICS
4.1. Overview
4.2. Drivers
4.3. Restraints
4.4. Opportunities
5. MARKET FACTOR ANALYSIS
5.1. Value chain Analysis
5.2. Porter's Five Forces Analysis
5.2.1. Bargaining Power of Suppliers
5.2.2. Bargaining Power of Buyers
5.2.3. Threat of New Entrants
5.2.4. Threat of Substitutes
5.2.5. Intensity of Rivalry
5.3. COVID-19 Impact Analysis
5.3.1. Market Impact Analysis
5.3.2. Regional Impact
5.3.3. Opportunity and Threat Analysis
6. HEARTH MARKET, BY TYPE (USD BILLION)
6.1. Gas Hearths
6.2. Wood Hearths
6.3. Electric Hearths
6.4. Pellet Hearths
7. HEARTH MARKET, BY FUEL SOURCE (USD BILLION)
7.1. Natural Gas
7.2. Propane
7.3. Wood
7.4. Electricity
8. HEARTH MARKET, BY APPLICATION (USD BILLION)
8.1. Residential
8.2. Commercial
8.3. Industrial
9. HEARTH MARKET, BY CONTROL TYPE (USD BILLION)
9.1. Manual Control
9.2. Remote Control
9.3. Smart Control
10. HEARTH MARKET, BY REGIONAL (USD BILLION)
10.1. North America
10.1.1. US
10.1.2. Canada
10.2. Europe
10.2.1. Germany
10.2.2. UK
10.2.3. France
10.2.4. Russia
10.2.5. Italy
10.2.6. Spain
10.2.7. Rest of Europe
10.3. APAC
10.3.1. China
10.3.2. India
10.3.3. Japan
10.3.4. South Korea
10.3.5. Malaysia
10.3.6. Thailand
10.3.7. Indonesia
10.3.8. Rest of APAC
10.4. South America
10.4.1. Brazil
10.4.2. Mexico
10.4.3. Argentina
10.4.4. Rest of South America
10.5. MEA
10.5.1. GCC Countries
10.5.2. South Africa
10.5.3. Rest of MEA
11. COMPETITIVE LANDSCAPE
11.1. Overview
11.2. Competitive Analysis
11.3. Market share Analysis
11.4. Major Growth Strategy in the Hearth Market
11.5. Competitive Benchmarking
11.6. Leading Players in Terms of Number of Developments in the Hearth Market
11.7. Key developments and growth strategies
11.7.1. New Product Launch/Service Deployment
11.7.2. Merger & Acquisitions
11.7.3. Joint Ventures
11.8. Major Players Financial Matrix
11.8.1. Sales and Operating Income
11.8.2. Major Players R&D Expenditure. 2023
12. COMPANY PROFILES
12.1. Flowers Foods
12.1.1. Financial Overview
12.1.2. Products Offered
12.1.3. Key Developments
12.1.4. SWOT Analysis
12.1.5. Key Strategies
12.2. Unilever
12.2.1. Financial Overview
12.2.2. Products Offered
12.2.3. Key Developments
12.2.4. SWOT Analysis
12.2.5. Key Strategies
12.3. Mondelez International
12.3.1. Financial Overview
12.3.2. Products Offered
12.3.3. Key Developments
12.3.4. SWOT Analysis
12.3.5. Key Strategies
12.4. Bunge Limited
12.4.1. Financial Overview
12.4.2. Products Offered
12.4.3. Key Developments
12.4.4. SWOT Analysis
12.4.5. Key Strategies
12.5. Mars
12.5.1. Financial Overview
12.5.2. Products Offered
12.5.3. Key Developments
12.5.4. SWOT Analysis
12.5.5. Key Strategies
12.6. McCormick & Company
12.6.1. Financial Overview
12.6.2. Products Offered
12.6.3. Key Developments
12.6.4. SWOT Analysis
12.6.5. Key Strategies
12.7. Conagra Brands
12.7.1. Financial Overview
12.7.2. Products Offered
12.7.3. Key Developments
12.7.4. SWOT Analysis
12.7.5. Key Strategies
12.8. Nestle
12.8.1. Financial Overview
12.8.2. Products Offered
12.8.3. Key Developments
12.8.4. SWOT Analysis
12.8.5. Key Strategies
12.9. Danone
12.9.1. Financial Overview
12.9.2. Products Offered
12.9.3. Key Developments
12.9.4. SWOT Analysis
12.9.5. Key Strategies
12.10. CocaCola
12.10.1. Financial Overview
12.10.2. Products Offered
12.10.3. Key Developments
12.10.4. SWOT Analysis
12.10.5. Key Strategies
12.11. General Mills
12.11.1. Financial Overview
12.11.2. Products Offered
12.11.3. Key Developments
12.11.4. SWOT Analysis
12.11.5. Key Strategies
12.12. Associated British Foods
12.12.1. Financial Overview
12.12.2. Products Offered
12.12.3. Key Developments
12.12.4. SWOT Analysis
12.12.5. Key Strategies
12.13. Kraft Heinz
12.13.1. Financial Overview
12.13.2. Products Offered
12.13.3. Key Developments
12.13.4. SWOT Analysis
12.13.5. Key Strategies
12.14. The Kellogg Company
12.14.1. Financial Overview
12.14.2. Products Offered
12.14.3. Key Developments
12.14.4. SWOT Analysis
12.14.5. Key Strategies
12.15. PepsiCo
12.15.1. Financial Overview
12.15.2. Products Offered
12.15.3. Key Developments
12.15.4. SWOT Analysis
12.15.5. Key Strategies
13. APPENDIX
13.1. References
13.2. Related Reports
LIST OF TABLES
TABLE 1. LIST OF ASSUMPTIONS
TABLE 2. NORTH AMERICA HEARTH INDUSTRY SIZE ESTIMATES & FORECAST, BY TYPE, 2019-2035 (USD BILLIONS)
TABLE 3. NORTH AMERICA HEARTH MARKET SIZE ESTIMATES & FORECAST, BY FUEL SOURCE, 2019-2035 (USD BILLIONS)
TABLE 4. NORTH AMERICA HEARTH INDUSTRYÂ SIZE ESTIMATES & FORECAST, BY APPLICATION, 2019-2035 (USD BILLIONS)
TABLE 5. NORTH AMERICA HEARTH INDUSTRYÂ SIZE ESTIMATES & FORECAST, BY CONTROL TYPE, 2019-2035 (USD BILLIONS)
TABLE 6. NORTH AMERICA HEARTH INDUSTRYÂ SIZE ESTIMATES & FORECAST, BY REGIONAL, 2019-2035 (USD BILLIONS)
TABLE 7. US HEARTH INDUSTRYÂ SIZE ESTIMATES & FORECAST, BY TYPE, 2019-2035 (USD BILLIONS)
TABLE 8. US HEARTH MARKET SIZE ESTIMATES & FORECAST, BY FUEL SOURCE, 2019-2035 (USD BILLIONS)
TABLE 9. US HEARTH INDUSTRYÂ SIZE ESTIMATES & FORECAST, BY APPLICATION, 2019-2035 (USD BILLIONS)
TABLE 10. US HEARTH INDUSTRYÂ SIZE ESTIMATES & FORECAST, BY CONTROL TYPE, 2019-2035 (USD BILLIONS)
TABLE 11. US HEARTH INDUSTRYÂ SIZE ESTIMATES & FORECAST, BY REGIONAL, 2019-2035 (USD BILLIONS)
TABLE 12. CANADA HEARTH MARKET SIZE ESTIMATES & FORECAST, BY TYPE, 2019-2035 (USD BILLIONS)
TABLE 13. CANADA HEARTH MARKET SIZE ESTIMATES & FORECAST, BY FUEL SOURCE, 2019-2035 (USD BILLIONS)
TABLE 14. CANADA HEARTH INDUSTRYÂ SIZE ESTIMATES & FORECAST, BY APPLICATION, 2019-2035 (USD BILLIONS)
TABLE 15. CANADA HEARTH MARKET SIZE ESTIMATES & FORECAST, BY CONTROL TYPE, 2019-2035 (USD BILLIONS)
TABLE 16. CANADA HEARTH MARKET SIZE ESTIMATES & FORECAST, BY REGIONAL, 2019-2035 (USD BILLIONS)
TABLE 17. EUROPE HEARTH INDUSTRYÂ SIZE ESTIMATES & FORECAST, BY TYPE, 2019-2035 (USD BILLIONS)
TABLE 18. EUROPE HEARTH MARKET SIZE ESTIMATES & FORECAST, BY FUEL SOURCE, 2019-2035 (USD BILLIONS)
TABLE 19. EUROPE HEARTH INDUSTRYÂ SIZE ESTIMATES & FORECAST, BY APPLICATION, 2019-2035 (USD BILLIONS)
TABLE 20. EUROPE HEARTH MARKET SIZE ESTIMATES & FORECAST, BY CONTROL TYPE, 2019-2035 (USD BILLIONS)
TABLE 21. EUROPE HEARTH INDUSTRYÂ SIZE ESTIMATES & FORECAST, BY REGIONAL, 2019-2035 (USD BILLIONS)
TABLE 22. GERMANY HEARTH INDUSTRYÂ SIZE ESTIMATES & FORECAST, BY TYPE, 2019-2035 (USD BILLIONS)
TABLE 23. GERMANY HEARTH MARKET SIZE ESTIMATES & FORECAST, BY FUEL SOURCE, 2019-2035 (USD BILLIONS)
TABLE 24. GERMANY HEARTH INDUSTRYÂ SIZE ESTIMATES & FORECAST, BY APPLICATION, 2019-2035 (USD BILLIONS)
TABLE 25. GERMANY HEARTH INDUSTRYÂ SIZE ESTIMATES & FORECAST, BY CONTROL TYPE, 2019-2035 (USD BILLIONS)
TABLE 26. GERMANY HEARTH INDUSTRYÂ SIZE ESTIMATES & FORECAST, BY REGIONAL, 2019-2035 (USD BILLIONS)
TABLE 27. UK HEARTH INDUSTRYÂ SIZE ESTIMATES & FORECAST, BY TYPE, 2019-2035 (USD BILLIONS)
TABLE 28. UK HEARTH INDUSTRYÂ SIZE ESTIMATES & FORECAST, BY FUEL SOURCE, 2019-2035 (USD BILLIONS)
TABLE 29. UK HEARTH INDUSTRYÂ SIZE ESTIMATES & FORECAST, BY APPLICATION, 2019-2035 (USD BILLIONS)
TABLE 30. UK HEARTH INDUSTRYÂ SIZE ESTIMATES & FORECAST, BY CONTROL TYPE, 2019-2035 (USD BILLIONS)
TABLE 31. UK HEARTH INDUSTRYÂ SIZE ESTIMATES & FORECAST, BY REGIONAL, 2019-2035 (USD BILLIONS)
TABLE 32. FRANCE HEARTH INDUSTRYÂ SIZE ESTIMATES & FORECAST, BY TYPE, 2019-2035 (USD BILLIONS)
TABLE 33. FRANCE HEARTH INDUSTRYÂ SIZE ESTIMATES & FORECAST, BY FUEL SOURCE, 2019-2035 (USD BILLIONS)
TABLE 34. FRANCE HEARTH INDUSTRYÂ SIZE ESTIMATES & FORECAST, BY APPLICATION, 2019-2035 (USD BILLIONS)
TABLE 35. FRANCE HEARTH INDUSTRYÂ SIZE ESTIMATES & FORECAST, BY CONTROL TYPE, 2019-2035 (USD BILLIONS)
TABLE 36. FRANCE HEARTH INDUSTRYÂ SIZE ESTIMATES & FORECAST, BY REGIONAL, 2019-2035 (USD BILLIONS)
TABLE 37. RUSSIA HEARTH INDUSTRYÂ SIZE ESTIMATES & FORECAST, BY TYPE, 2019-2035 (USD BILLIONS)
TABLE 38. RUSSIA HEARTH INDUSTRYÂ SIZE ESTIMATES & FORECAST, BY FUEL SOURCE, 2019-2035 (USD BILLIONS)
TABLE 39. RUSSIA HEARTH INDUSTRYÂ SIZE ESTIMATES & FORECAST, BY APPLICATION, 2019-2035 (USD BILLIONS)
TABLE 40. RUSSIA HEARTH INDUSTRYÂ SIZE ESTIMATES & FORECAST, BY CONTROL TYPE, 2019-2035 (USD BILLIONS)
TABLE 41. RUSSIA HEARTH INDUSTRYÂ SIZE ESTIMATES & FORECAST, BY REGIONAL, 2019-2035 (USD BILLIONS)
TABLE 42. ITALY HEARTH MARKET SIZE ESTIMATES & FORECAST, BY TYPE, 2019-2035 (USD BILLIONS)
TABLE 43. ITALY HEARTH MARKET SIZE ESTIMATES & FORECAST, BY FUEL SOURCE, 2019-2035 (USD BILLIONS)
TABLE 44. ITALY HEARTH MARKET SIZE ESTIMATES & FORECAST, BY APPLICATION, 2019-2035 (USD BILLIONS)
TABLE 45. ITALY HEARTH MARKET SIZE ESTIMATES & FORECAST, BY CONTROL TYPE, 2019-2035 (USD BILLIONS)
TABLE 46. ITALY HEARTH MARKET SIZE ESTIMATES & FORECAST, BY REGIONAL, 2019-2035 (USD BILLIONS)
TABLE 47. SPAIN HEARTH INDUSTRYÂ SIZE ESTIMATES & FORECAST, BY TYPE, 2019-2035 (USD BILLIONS)
TABLE 48. SPAIN HEARTH INDUSTRYÂ SIZE ESTIMATES & FORECAST, BY FUEL SOURCE, 2019-2035 (USD BILLIONS)
TABLE 49. SPAIN HEARTH INDUSTRYÂ SIZE ESTIMATES & FORECAST, BY APPLICATION, 2019-2035 (USD BILLIONS)
TABLE 50. SPAIN HEARTH INDUSTRYÂ SIZE ESTIMATES & FORECAST, BY CONTROL TYPE, 2019-2035 (USD BILLIONS)
TABLE 51. SPAIN HEARTH INDUSTRYÂ SIZE ESTIMATES & FORECAST, BY REGIONAL, 2019-2035 (USD BILLIONS)
TABLE 52. REST OF EUROPE HEARTH INDUSTRYÂ SIZE ESTIMATES & FORECAST, BY TYPE, 2019-2035 (USD BILLIONS)
TABLE 53. REST OF EUROPE HEARTH INDUSTRYÂ SIZE ESTIMATES & FORECAST, BY FUEL SOURCE, 2019-2035 (USD BILLIONS)
TABLE 54. REST OF EUROPE HEARTH MARKET SIZE ESTIMATES & FORECAST, BY APPLICATION, 2019-2035 (USD BILLIONS)
TABLE 55. REST OF EUROPE HEARTH MARKET SIZE ESTIMATES & FORECAST, BY CONTROL TYPE, 2019-2035 (USD BILLIONS)
TABLE 56. REST OF EUROPE HEARTH MARKET SIZE ESTIMATES & FORECAST, BY REGIONAL, 2019-2035 (USD BILLIONS)
TABLE 57. APAC HEARTH INDUSTRYÂ SIZE ESTIMATES & FORECAST, BY TYPE, 2019-2035 (USD BILLIONS)
TABLE 58. APAC HEARTH INDUSTRYÂ SIZE ESTIMATES & FORECAST, BY FUEL SOURCE, 2019-2035 (USD BILLIONS)
TABLE 59. APAC HEARTH INDUSTRYÂ SIZE ESTIMATES & FORECAST, BY APPLICATION, 2019-2035 (USD BILLIONS)
TABLE 60. APAC HEARTH INDUSTRYÂ SIZE ESTIMATES & FORECAST, BY CONTROL TYPE, 2019-2035 (USD BILLIONS)
TABLE 61. APAC HEARTH INDUSTRYÂ SIZE ESTIMATES & FORECAST, BY REGIONAL, 2019-2035 (USD BILLIONS)
TABLE 62. CHINA HEARTH INDUSTRYÂ SIZE ESTIMATES & FORECAST, BY TYPE, 2019-2035 (USD BILLIONS)
TABLE 63. CHINA HEARTH INDUSTRYÂ SIZE ESTIMATES & FORECAST, BY FUEL SOURCE, 2019-2035 (USD BILLIONS)
TABLE 64. CHINA HEARTH INDUSTRYÂ SIZE ESTIMATES & FORECAST, BY APPLICATION, 2019-2035 (USD BILLIONS)
TABLE 65. CHINA HEARTH INDUSTRYÂ SIZE ESTIMATES & FORECAST, BY CONTROL TYPE, 2019-2035 (USD BILLIONS)
TABLE 66. CHINA HEARTH INDUSTRYÂ SIZE ESTIMATES & FORECAST, BY REGIONAL, 2019-2035 (USD BILLIONS)
TABLE 67. INDIA HEARTH INDUSTRYÂ SIZE ESTIMATES & FORECAST, BY TYPE, 2019-2035 (USD BILLIONS)
TABLE 68. INDIA HEARTH INDUSTRYÂ SIZE ESTIMATES & FORECAST, BY FUEL SOURCE, 2019-2035 (USD BILLIONS)
TABLE 69. INDIA HEARTH INDUSTRYÂ SIZE ESTIMATES & FORECAST, BY APPLICATION, 2019-2035 (USD BILLIONS)
TABLE 70. INDIA HEARTH INDUSTRYÂ SIZE ESTIMATES & FORECAST, BY CONTROL TYPE, 2019-2035 (USD BILLIONS)
TABLE 71. INDIA HEARTH INDUSTRYÂ SIZE ESTIMATES & FORECAST, BY REGIONAL, 2019-2035 (USD BILLIONS)
TABLE 72. JAPAN HEARTH INDUSTRYÂ SIZE ESTIMATES & FORECAST, BY TYPE, 2019-2035 (USD BILLIONS)
TABLE 73. JAPAN HEARTH INDUSTRYÂ SIZE ESTIMATES & FORECAST, BY FUEL SOURCE, 2019-2035 (USD BILLIONS)
TABLE 74. JAPAN HEARTH INDUSTRYÂ SIZE ESTIMATES & FORECAST, BY APPLICATION, 2019-2035 (USD BILLIONS)
TABLE 75. JAPAN HEARTH INDUSTRYÂ SIZE ESTIMATES & FORECAST, BY CONTROL TYPE, 2019-2035 (USD BILLIONS)
TABLE 76. JAPAN HEARTH INDUSTRYÂ SIZE ESTIMATES & FORECAST, BY REGIONAL, 2019-2035 (USD BILLIONS)
TABLE 77. SOUTH KOREA HEARTH INDUSTRYÂ SIZE ESTIMATES & FORECAST, BY TYPE, 2019-2035 (USD BILLIONS)
TABLE 78. SOUTH KOREA HEARTH INDUSTRYÂ SIZE ESTIMATES & FORECAST, BY FUEL SOURCE, 2019-2035 (USD BILLIONS)
TABLE 79. SOUTH KOREA HEARTH MARKET SIZE ESTIMATES & FORECAST, BY APPLICATION, 2019-2035 (USD BILLIONS)
TABLE 80. SOUTH KOREA HEARTH MARKET SIZE ESTIMATES & FORECAST, BY CONTROL TYPE, 2019-2035 (USD BILLIONS)
TABLE 81. SOUTH KOREA HEARTH MARKET SIZE ESTIMATES & FORECAST, BY REGIONAL, 2019-2035 (USD BILLIONS)
TABLE 82. MALAYSIA MARKET SIZE ESTIMATES & FORECAST, BY TYPE, 2019-2035 (USD BILLIONS)
TABLE 83. MALAYSIA MARKET SIZE ESTIMATES & FORECAST, BY FUEL SOURCE, 2019-2035 (USD BILLIONS)
TABLE 84. MALAYSIA MARKET SIZE ESTIMATES & FORECAST, BY APPLICATION, 2019-2035 (USD BILLIONS)
TABLE 85. MALAYSIA MARKET SIZE ESTIMATES & FORECAST, BY CONTROL TYPE, 2019-2035 (USD BILLIONS)
TABLE 86. MALAYSIA MARKET SIZE ESTIMATES & FORECAST, BY REGIONAL, 2019-2035 (USD BILLIONS)
TABLE 87. THAILAND MARKET SIZE ESTIMATES & FORECAST, BY TYPE, 2019-2035 (USD BILLIONS)
TABLE 88. THAILAND MARKET SIZE ESTIMATES & FORECAST, BY FUEL SOURCE, 2019-2035 (USD BILLIONS)
TABLE 89. THAILAND MARKET SIZE ESTIMATES & FORECAST, BY APPLICATION, 2019-2035 (USD BILLIONS)
TABLE 90. THAILAND MARKET SIZE ESTIMATES & FORECAST, BY CONTROL TYPE, 2019-2035 (USD BILLIONS)
TABLE 91. THAILAND MARKET SIZE ESTIMATES & FORECAST, BY REGIONAL, 2019-2035 (USD BILLIONS)
TABLE 92. INDONESIA MARKET SIZE ESTIMATES & FORECAST, BY TYPE, 2019-2035 (USD BILLIONS)
TABLE 93. INDONESIA MARKET SIZE ESTIMATES & FORECAST, BY FUEL SOURCE, 2019-2035 (USD BILLIONS)
TABLE 94. INDONESIA MARKET SIZE ESTIMATES & FORECAST, BY APPLICATION, 2019-2035 (USD BILLIONS)
TABLE 95. INDONESIA MARKET SIZE ESTIMATES & FORECAST, BY CONTROL TYPE, 2019-2035 (USD BILLIONS)
TABLE 96. INDONESIA MARKET SIZE ESTIMATES & FORECAST, BY REGIONAL, 2019-2035 (USD BILLIONS)
TABLE 97. REST OF APAC MARKET SIZE ESTIMATES & FORECAST, BY TYPE, 2019-2035 (USD BILLIONS)
TABLE 98. REST OF APAC MARKET SIZE ESTIMATES & FORECAST, BY FUEL SOURCE, 2019-2035 (USD BILLIONS)
TABLE 99. REST OF APAC MARKET SIZE ESTIMATES & FORECAST, BY APPLICATION, 2019-2035 (USD BILLIONS)
TABLE 100. REST OF APAC MARKET SIZE ESTIMATES & FORECAST, BY CONTROL TYPE, 2019-2035 (USD BILLIONS)
TABLE 101. REST OF APAC MARKET SIZE ESTIMATES & FORECAST, BY REGIONAL, 2019-2035 (USD BILLIONS)
TABLE 102. SOUTH AMERICA HEARTH MARKET SIZE ESTIMATES & FORECAST, BY TYPE, 2019-2035 (USD BILLIONS)
TABLE 103. SOUTH AMERICA HEARTH MARKET SIZE ESTIMATES & FORECAST, BY FUEL SOURCE, 2019-2035 (USD BILLIONS)
TABLE 104. SOUTH AMERICA HEARTH MARKET SIZE ESTIMATES & FORECAST, BY APPLICATION, 2019-2035 (USD BILLIONS)
TABLE 105. SOUTH AMERICA HEARTH MARKET SIZE ESTIMATES & FORECAST, BY CONTROL TYPE, 2019-2035 (USD BILLIONS)
TABLE 106. SOUTH AMERICA HEARTH MARKET SIZE ESTIMATES & FORECAST, BY REGIONAL, 2019-2035 (USD BILLIONS)
TABLE 107. BRAZIL HEARTH INDUSTRYÂ SIZE ESTIMATES & FORECAST, BY TYPE, 2019-2035 (USD BILLIONS)
TABLE 108. BRAZIL HEARTH INDUSTRYÂ SIZE ESTIMATES & FORECAST, BY FUEL SOURCE, 2019-2035 (USD BILLIONS)
TABLE 109. BRAZIL HEARTH INDUSTRYÂ SIZE ESTIMATES & FORECAST, BY APPLICATION, 2019-2035 (USD BILLIONS)
TABLE 110. BRAZIL HEARTH INDUSTRYÂ SIZE ESTIMATES & FORECAST, BY CONTROL TYPE, 2019-2035 (USD BILLIONS)
TABLE 111. BRAZIL HEARTH INDUSTRYÂ SIZE ESTIMATES & FORECAST, BY REGIONAL, 2019-2035 (USD BILLIONS)
TABLE 112. MEXICO HEARTH INDUSTRYÂ SIZE ESTIMATES & FORECAST, BY TYPE, 2019-2035 (USD BILLIONS)
TABLE 113. MEXICO HEARTH INDUSTRYÂ SIZE ESTIMATES & FORECAST, BY FUEL SOURCE, 2019-2035 (USD BILLIONS)
TABLE 114. MEXICO HEARTH INDUSTRYÂ SIZE ESTIMATES & FORECAST, BY APPLICATION, 2019-2035 (USD BILLIONS)
TABLE 115. MEXICO HEARTH INDUSTRYÂ SIZE ESTIMATES & FORECAST, BY CONTROL TYPE, 2019-2035 (USD BILLIONS)
TABLE 116. MEXICO HEARTH INDUSTRYÂ SIZE ESTIMATES & FORECAST, BY REGIONAL, 2019-2035 (USD BILLIONS)
TABLE 117. ARGENTINA HEARTH INDUSTRYÂ SIZE ESTIMATES & FORECAST, BY TYPE, 2019-2035 (USD BILLIONS)
TABLE 118. ARGENTINA HEARTH INDUSTRYÂ SIZE ESTIMATES & FORECAST, BY FUEL SOURCE, 2019-2035 (USD BILLIONS)
TABLE 119. ARGENTINA HEARTH INDUSTRYÂ SIZE ESTIMATES & FORECAST, BY APPLICATION, 2019-2035 (USD BILLIONS)
TABLE 120. ARGENTINA HEARTH INDUSTRYÂ SIZE ESTIMATES & FORECAST, BY CONTROL TYPE, 2019-2035 (USD BILLIONS)
TABLE 121. ARGENTINA HEARTH INDUSTRYÂ SIZE ESTIMATES & FORECAST, BY REGIONAL, 2019-2035 (USD BILLIONS)
TABLE 122. REST OF SOUTH AMERICA HEARTH INDUSTRYÂ SIZE ESTIMATES & FORECAST, BY TYPE, 2019-2035 (USD BILLIONS)
TABLE 123. REST OF SOUTH AMERICA HEARTH INDUSTRYÂ SIZE ESTIMATES & FORECAST, BY FUEL SOURCE, 2019-2035 (USD BILLIONS)
TABLE 124. REST OF SOUTH AMERICA HEARTH INDUSTRYÂ SIZE ESTIMATES & FORECAST, BY APPLICATION, 2019-2035 (USD BILLIONS)
TABLE 125. REST OF SOUTH AMERICA HEARTH INDUSTRYÂ SIZE ESTIMATES & FORECAST, BY CONTROL TYPE, 2019-2035 (USD BILLIONS)
TABLE 126. REST OF SOUTH AMERICA HEARTH INDUSTRYÂ SIZE ESTIMATES & FORECAST, BY REGIONAL, 2019-2035 (USD BILLIONS)
TABLE 127. MEA HEARTH INDUSTRY SIZE ESTIMATES & FORECAST, BY TYPE, 2019-2035 (USD BILLIONS)
TABLE 128. MEA HEARTH INDUSTRYÂ SIZE ESTIMATES & FORECAST, BY FUEL SOURCE, 2019-2035 (USD BILLIONS)
TABLE 129. MEA HEARTH INDUSTRYÂ SIZE ESTIMATES & FORECAST, BY APPLICATION, 2019-2035 (USD BILLIONS)
TABLE 130. MEA HEARTH INDUSTRYÂ SIZE ESTIMATES & FORECAST, BY CONTROL TYPE, 2019-2035 (USD BILLIONS)
TABLE 131. MEA HEARTH INDUSTRYÂ SIZE ESTIMATES & FORECAST, BY REGIONAL, 2019-2035 (USD BILLIONS)
TABLE 132. GCC COUNTRIES HEARTH INDUSTRYÂ SIZE ESTIMATES & FORECAST, BY TYPE, 2019-2035 (USD BILLIONS)
TABLE 133. GCC COUNTRIES HEARTH INDUSTRYÂ SIZE ESTIMATES & FORECAST, BY FUEL SOURCE, 2019-2035 (USD BILLIONS)
TABLE 134. GCC COUNTRIES HEARTH INDUSTRYÂ SIZE ESTIMATES & FORECAST, BY APPLICATION, 2019-2035 (USD BILLIONS)
TABLE 135. GCC COUNTRIES HEARTH INDUSTRYÂ SIZE ESTIMATES & FORECAST, BY CONTROL TYPE, 2019-2035 (USD BILLIONS)
TABLE 136. GCC COUNTRIES HEARTH INDUSTRYÂ SIZE ESTIMATES & FORECAST, BY REGIONAL, 2019-2035 (USD BILLIONS)
TABLE 137. SOUTH AFRICA HEARTH INDUSTRYÂ SIZE ESTIMATES & FORECAST, BY TYPE, 2019-2035 (USD BILLIONS)
TABLE 138. SOUTH AFRICA HEARTH INDUSTRYÂ SIZE ESTIMATES & FORECAST, BY FUEL SOURCE, 2019-2035 (USD BILLIONS)
TABLE 139. SOUTH AFRICA HEARTH INDUSTRYÂ SIZE ESTIMATES & FORECAST, BY APPLICATION, 2019-2035 (USD BILLIONS)
TABLE 140. SOUTH AFRICA HEARTH INDUSTRYÂ SIZE ESTIMATES & FORECAST, BY CONTROL TYPE, 2019-2035 (USD BILLIONS)
TABLE 141. SOUTH AFRICA HEARTH INDUSTRYÂ SIZE ESTIMATES & FORECAST, BY REGIONAL, 2019-2035 (USD BILLIONS)
TABLE 142. REST OF MEA HEARTH INDUSTRYÂ SIZE ESTIMATES & FORECAST, BY TYPE, 2019-2035 (USD BILLIONS)
TABLE 143. REST OF MEA HEARTH INDUSTRYÂ SIZE ESTIMATES & FORECAST, BY FUEL SOURCE, 2019-2035 (USD BILLIONS)
TABLE 144. REST OF MEA HEARTH INDUSTRYÂ SIZE ESTIMATES & FORECAST, BY APPLICATION, 2019-2035 (USD BILLIONS)
TABLE 145. REST OF MEA HEARTH INDUSTRYÂ SIZE ESTIMATES & FORECAST, BY CONTROL TYPE, 2019-2035 (USD BILLIONS)
TABLE 146. REST OF MEA HEARTH INDUSTRYÂ SIZE ESTIMATES & FORECAST, BY REGIONAL, 2019-2035 (USD BILLIONS)
TABLE 147. PRODUCT LAUNCH/PRODUCT DEVELOPMENT/APPROVAL
TABLE 148. ACQUISITION/PARTNERSHIP
Â
Â
Â
Â
Â
Â
Â
Â
Â
Â
Â
Â
Â
Â
LIST OF FIGURES
FIGURE 1. MARKET SYNOPSIS
FIGURE 2. NORTH AMERICA MARKET ANALYSIS
FIGURE 3. US MARKET ANALYSIS BY TYPE
FIGURE 4. US MARKET ANALYSIS BY FUEL SOURCE
FIGURE 5. US MARKET ANALYSIS BY APPLICATION
FIGURE 6. US MARKET ANALYSIS BY CONTROL TYPE
FIGURE 7. US MARKET ANALYSIS BY REGIONAL
FIGURE 8. CANADA MARKET ANALYSIS BY TYPE
FIGURE 9. CANADA MARKET ANALYSIS BY FUEL SOURCE
FIGURE 10. CANADA MARKET ANALYSIS BY APPLICATION
FIGURE 11. CANADA MARKET ANALYSIS BY CONTROL TYPE
FIGURE 12. CANADA MARKET ANALYSIS BY REGIONAL
FIGURE 13. EUROPE MARKET ANALYSIS
FIGURE 14. GERMANY MARKET ANALYSIS BY TYPE
FIGURE 15. GERMANY MARKET ANALYSIS BY FUEL SOURCE
FIGURE 16. GERMANY MARKET ANALYSIS BY APPLICATION
FIGURE 17. GERMANY MARKET ANALYSIS BY CONTROL TYPE
FIGURE 18. GERMANY MARKET ANALYSIS BY REGIONAL
FIGURE 19. UK MARKET ANALYSIS BY TYPE
FIGURE 20. UK MARKET ANALYSIS BY FUEL SOURCE
FIGURE 21. UK MARKET ANALYSIS BY APPLICATION
FIGURE 22. UK MARKET ANALYSIS BY CONTROL TYPE
FIGURE 23. UK MARKET ANALYSIS BY REGIONAL
FIGURE 24. FRANCE MARKET ANALYSIS BY TYPE
FIGURE 25. FRANCE MARKET ANALYSIS BY FUEL SOURCE
FIGURE 26. FRANCE MARKET ANALYSIS BY APPLICATION
FIGURE 27. FRANCE MARKET ANALYSIS BY CONTROL TYPE
FIGURE 28. FRANCE MARKET ANALYSIS BY REGIONAL
FIGURE 29. RUSSIA MARKET ANALYSIS BY TYPE
FIGURE 30. RUSSIA MARKET ANALYSIS BY FUEL SOURCE
FIGURE 31. RUSSIA MARKET ANALYSIS BY APPLICATION
FIGURE 32. RUSSIA MARKET ANALYSIS BY CONTROL TYPE
FIGURE 33. RUSSIA MARKET ANALYSIS BY REGIONAL
FIGURE 34. ITALY MARKET ANALYSIS BY TYPE
FIGURE 35. ITALY MARKET ANALYSIS BY FUEL SOURCE
FIGURE 36. ITALY MARKET ANALYSIS BY APPLICATION
FIGURE 37. ITALY MARKET ANALYSIS BY CONTROL TYPE
FIGURE 38. ITALY MARKET ANALYSIS BY REGIONAL
FIGURE 39. SPAIN MARKET ANALYSIS BY TYPE
FIGURE 40. SPAIN MARKET ANALYSIS BY FUEL SOURCE
FIGURE 41. SPAIN MARKET ANALYSIS BY APPLICATION
FIGURE 42. SPAIN MARKET ANALYSIS BY CONTROL TYPE
FIGURE 43. SPAIN MARKET ANALYSIS BY REGIONAL
FIGURE 44. REST OF EUROPE MARKET ANALYSIS BY TYPE
FIGURE 45. REST OF EUROPE MARKET ANALYSIS BY FUEL SOURCE
FIGURE 46. REST OF EUROPE MARKET ANALYSIS BY APPLICATION
FIGURE 47. REST OF EUROPE MARKET ANALYSIS BY CONTROL TYPE
FIGURE 48. REST OF EUROPE MARKET ANALYSIS BY REGIONAL
FIGURE 49. APAC MARKET ANALYSIS
FIGURE 50. CHINA MARKET ANALYSIS BY TYPE
FIGURE 51. CHINA MARKET ANALYSIS BY FUEL SOURCE
FIGURE 52. CHINA MARKET ANALYSIS BY APPLICATION
FIGURE 53. CHINA MARKET ANALYSIS BY CONTROL TYPE
FIGURE 54. CHINA MARKET ANALYSIS BY REGIONAL
FIGURE 55. INDIA MARKET ANALYSIS BY TYPE
FIGURE 56. INDIA MARKET ANALYSIS BY FUEL SOURCE
FIGURE 57. INDIA MARKET ANALYSIS BY APPLICATION
FIGURE 58. INDIA MARKET ANALYSIS BY CONTROL TYPE
FIGURE 59. INDIA MARKET ANALYSIS BY REGIONAL
FIGURE 60. JAPAN MARKET ANALYSIS BY TYPE
FIGURE 61. JAPAN MARKET ANALYSIS BY FUEL SOURCE
FIGURE 62. JAPAN MARKET ANALYSIS BY APPLICATION
FIGURE 63. JAPAN MARKET ANALYSIS BY CONTROL TYPE
FIGURE 64. JAPAN MARKET ANALYSIS BY REGIONAL
FIGURE 65. SOUTH KOREA MARKET ANALYSIS BY TYPE
FIGURE 66. SOUTH KOREA MARKET ANALYSIS BY FUEL SOURCE
FIGURE 67. SOUTH KOREA MARKET ANALYSIS BY APPLICATION
FIGURE 68. SOUTH KOREA MARKET ANALYSIS BY CONTROL TYPE
FIGURE 69. SOUTH KOREA MARKET ANALYSIS BY REGIONAL
FIGURE 70. MALAYSIA MARKET ANALYSIS BY TYPE
FIGURE 71. MALAYSIA MARKET ANALYSIS BY FUEL SOURCE
FIGURE 72. MALAYSIA MARKET ANALYSIS BY APPLICATION
FIGURE 73. MALAYSIA MARKET ANALYSIS BY CONTROL TYPE
FIGURE 74. MALAYSIA MARKET ANALYSIS BY REGIONAL
FIGURE 75. THAILAND MARKET ANALYSIS BY TYPE
FIGURE 76. THAILAND MARKET ANALYSIS BY FUEL SOURCE
FIGURE 77. THAILAND MARKET ANALYSIS BY APPLICATION
FIGURE 78. THAILAND MARKET ANALYSIS BY CONTROL TYPE
FIGURE 79. THAILAND MARKET ANALYSIS BY REGIONAL
FIGURE 80. INDONESIA MARKET ANALYSIS BY TYPE
FIGURE 81. INDONESIA MARKET ANALYSIS BY FUEL SOURCE
FIGURE 82. INDONESIA MARKET ANALYSIS BY APPLICATION
FIGURE 83. INDONESIA MARKET ANALYSIS BY CONTROL TYPE
FIGURE 84. INDONESIA MARKET ANALYSIS BY REGIONAL
FIGURE 85. REST OF APAC MARKET ANALYSIS BY TYPE
FIGURE 86. REST OF APAC MARKET ANALYSIS BY FUEL SOURCE
FIGURE 87. REST OF APAC MARKET ANALYSIS BY APPLICATION
FIGURE 88. REST OF APAC MARKET ANALYSIS BY CONTROL TYPE
FIGURE 89. REST OF APAC MARKET ANALYSIS BY REGIONAL
FIGURE 90. SOUTH AMERICA MARKET ANALYSIS
FIGURE 91. BRAZIL MARKET ANALYSIS BY TYPE
FIGURE 92. BRAZIL MARKET ANALYSIS BY FUEL SOURCE
FIGURE 93. BRAZIL MARKET ANALYSIS BY APPLICATION
FIGURE 94. BRAZIL MARKET ANALYSIS BY CONTROL TYPE
FIGURE 95. BRAZIL MARKET ANALYSIS BY REGIONAL
FIGURE 96. MEXICO MARKET ANALYSIS BY TYPE
FIGURE 97. MEXICO MARKET ANALYSIS BY FUEL SOURCE
FIGURE 98. MEXICO MARKET ANALYSIS BY APPLICATION
FIGURE 99. MEXICO MARKET ANALYSIS BY CONTROL TYPE
FIGURE 100. MEXICO MARKET ANALYSIS BY REGIONAL
FIGURE 101. ARGENTINA MARKET ANALYSIS BY TYPE
FIGURE 102. ARGENTINA MARKET ANALYSIS BY FUEL SOURCE
FIGURE 103. ARGENTINA MARKET ANALYSIS BY APPLICATION
FIGURE 104. ARGENTINA MARKET ANALYSIS BY CONTROL TYPE
FIGURE 105. ARGENTINA MARKET ANALYSIS BY REGIONAL
FIGURE 106. REST OF SOUTH AMERICA MARKET ANALYSIS BY TYPE
FIGURE 107. REST OF SOUTH AMERICA MARKET ANALYSIS BY FUEL SOURCE
FIGURE 108. REST OF SOUTH AMERICA MARKET ANALYSIS BY APPLICATION
FIGURE 109. REST OF SOUTH AMERICA MARKET ANALYSIS BY CONTROL TYPE
FIGURE 110. REST OF SOUTH AMERICA MARKET ANALYSIS BY REGIONAL
FIGURE 111. MEA MARKET ANALYSIS
FIGURE 112. GCC COUNTRIES MARKET ANALYSIS BY TYPE
FIGURE 113. GCC COUNTRIES MARKET ANALYSIS BY FUEL SOURCE
FIGURE 114. GCC COUNTRIES MARKET ANALYSIS BY APPLICATION
FIGURE 115. GCC COUNTRIES MARKET ANALYSIS BY CONTROL TYPE
FIGURE 116. GCC COUNTRIES MARKET ANALYSIS BY REGIONAL
FIGURE 117. SOUTH AFRICA MARKET ANALYSIS BY TYPE
FIGURE 118. SOUTH AFRICA MARKET ANALYSIS BY FUEL SOURCE
FIGURE 119. SOUTH AFRICA MARKET ANALYSIS BY APPLICATION
FIGURE 120. SOUTH AFRICA MARKET ANALYSIS BY CONTROL TYPE
FIGURE 121. SOUTH AFRICA MARKET ANALYSIS BY REGIONAL
FIGURE 122. REST OF MEA MARKET ANALYSIS BY TYPE
FIGURE 123. REST OF MEA MARKET ANALYSIS BY FUEL SOURCE
FIGURE 124. REST OF MEA MARKET ANALYSIS BY APPLICATION
FIGURE 125. REST OF MEA MARKET ANALYSIS BY CONTROL TYPE
FIGURE 126. REST OF MEA MARKET ANALYSIS BY REGIONAL
FIGURE 127. KEY BUYING CRITERIA OF HEARTHÂ MARKET
FIGURE 128. RESEARCH PROCESS OF MRFR
FIGURE 129. DRO ANALYSIS OF HEARTHÂ MARKET
FIGURE 130. DRIVERS IMPACT ANALYSIS: HEARTHÂ MARKET
FIGURE 131. RESTRAINTS IMPACT ANALYSIS: HEARTHÂ MARKET
FIGURE 132. SUPPLY / VALUE CHAIN: HEARTHÂ MARKET
FIGURE 133. HEARTH MARKET, BY TYPE, 2025 (% SHARE)
FIGURE 134. HEARTHÂ MARKET, BY TYPE, 2019 TO 2035 (USD Billions)
FIGURE 135.HEARTH MARKET, BY FUEL SOURCE, 2025 (% SHARE)
FIGURE 136. HEARTHÂ MARKET, BY FUEL SOURCE, 2019 TO 2035 (USD Billions)
FIGURE 137. HEARTHÂ MARKET, BY APPLICATION, 2025 (% SHARE)
FIGURE 138. HEARTHÂ MARKET, BY APPLICATION, 2019 TO 2035 (USD Billions)
FIGURE 139. HEARTHÂ MARKET, BY CONTROL TYPE, 2025 (% SHARE)
FIGURE 140. HEARTHÂ MARKET, BY CONTROL TYPE, 2019 TO 2035 (USD Billions)
FIGURE 141. HEARTHÂ MARKET, BY REGIONAL, 2025 (% SHARE)
FIGURE 142. HEARTHÂ MARKET, BY REGIONAL, 2019 TO 2035 (USD Billions)
FIGURE 143. BENCHMARKING OF MAJOR COMPETITORS
Leading companies partner with us for data-driven Insights.
Kindly complete the form below to receive a free sample of this Report