Healthcare IT Market (2026 - 2035)

ID: MRFR/HS/4494-HCR 200 Pages Rahul Gotadki Last Updated: September 10, 2026
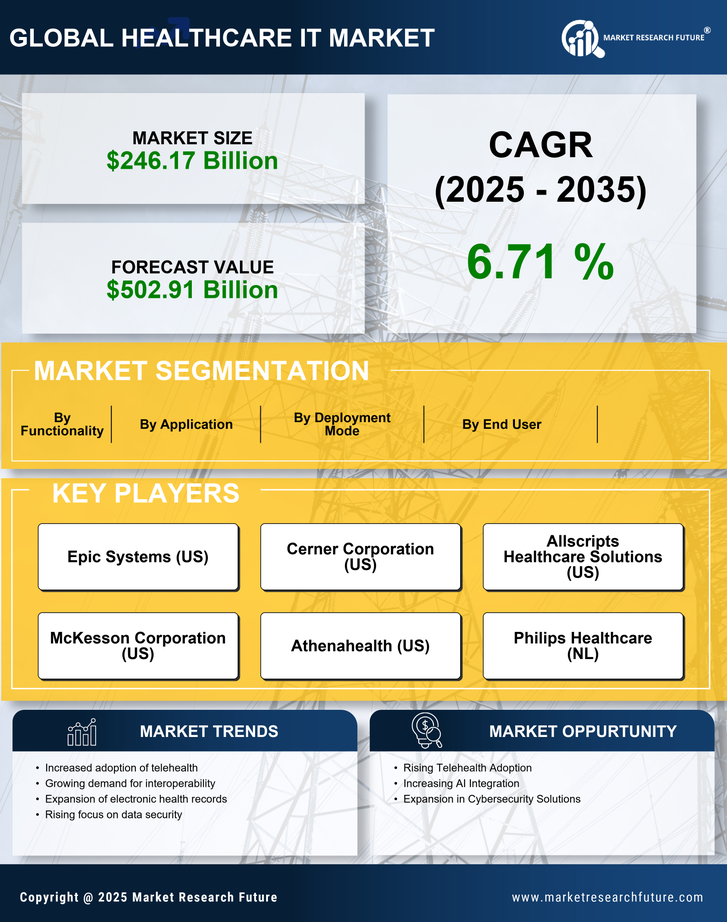
Healthcare IT Market Research Report: Size, Share, Trend Analysis By Applications (Electronic Health Records, Telemedicine, Healthcare Analytics, Patient Engagement Solutions, Healthcare Information Exchange), By End Users (Hospitals, Ambulatory Surgical Centers, Clinics, Pharmaceutical Companies, Research Organizations), By Deployment Mode (On-Premise, Cloud-Based, Hybrid), By Functionality (Administrative Solutions, Clinical Solutions, Financial Solutions) and By Regional (North America, Europe, South America, Asia Pacific, Middle East and Africa) - Growth Outlook & Industry Forecast 2025 To 2035
Healthcare IT Market
Market Size
Forecast Period2026-2035
CAGR (2026-2035)15.3%
2025 Market SizeUSD 437.2 Billion
2035 Market SizeUSD 1,841.7 Billion
Key Players
Epic Systems
Oracle Health
Optum
Philips Healthcare
GE HealthCare
Veradigm
Opportunities
  • Ambient Clinical Intelligence as a Platform Layer
  • Emerging-Market Sovereign Platforms
  • Real-World Evidence and Data Monetisation
  1. 1 Market Summary |
    1. 1.1 Study Assumptions & Market Definition |
    2. 1.2 Scope of the Study |
    3. 1.3 Research Methodology
  2. 2 Key Report Takeaways |
    1. 2.1 By Technology |
    2. 2.2 By Sector |
    3. 2.3 By Geography
  3. 3 Market Size & Forecast (2021–2035) |
    1. 3.1 Historical Market Size (2021–2024) |
    2. 3.2 Base Year Estimate (2025) |
    3. 3.3 Forecast Market Size (2026–2035) |
    4. 3.4 Year-over-Year Growth Analysis
  4. 4 Driver Impact Analysis |
    1. 4.1 Regulatory Interoperability Mandates |
    2. 4.2 Cloud and AI Convergence |
    3. 4.3 National Digital-Health Programmes |
    4. 4.4 Security Spending After Ransomware
  5. 5 Restraints Impact Analysis |
    1. 5.1 Capital Discipline at Provider Level |
    2. 5.2 Privacy Fragmentation |
    3. 5.3 Adoption Friction Inside Clinical Workflow
  6. 6 Opportunities |
    1. 6.1 Ambient Clinical Intelligence as a Platform Layer |
    2. 6.2 Emerging-Market Sovereign Platforms |
    3. 6.3 Real-World Evidence and Data Monetisation |
    4. 6.4 Payer-Provider Convergence Tooling |
    5. 6.5 Federated Analytics for Cross-Border Research
  7. 7 Regional Market Share & Country-Level Analysis |
    1. 7.1 North America | |
      1. 7.1.1 US | |
      2. 7.1.2 Canada | |
      3. 7.1.3 Mexico |
    2. 7.2 Europe | |
      1. 7.2.1 Germany | |
      2. 7.2.2 UK | |
      3. 7.2.3 France | |
      4. 7.2.4 Italy | |
      5. 7.2.5 Spain | |
      6. 7.2.6 Nordic Countries | |
      7. 7.2.7 Russia | |
      8. 7.2.8 Rest of Europe |
    3. 7.3 Asia-Pacific | |
      1. 7.3.1 China | |
      2. 7.3.2 India | |
      3. 7.3.3 Japan | |
      4. 7.3.4 South Korea | |
      5. 7.3.5 ASEAN | |
      6. 7.3.6 Rest of Asia-Pacific |
    4. 7.4 South America | |
      1. 7.4.1 Brazil | |
      2. 7.4.2 Argentina | |
      3. 7.4.3 Rest of South America |
    5. 7.5 Middle East & Africa | |
      1. 7.5.1 Saudi Arabia | |
      2. 7.5.2 UAE | |
      3. 7.5.3 South Africa | |
      4. 7.5.4 Egypt | |
      5. 7.5.5 Rest of Middle East & Africa
  8. 8 Future Outlook (2026–2035) |
    1. 8.1 Autonomous Clinical Operations |
    2. 8.2 Platform Economics and Ecosystem Rents |
    3. 8.3 Data Infrastructure Supercycle |
    4. 8.4 Sustainability and Total Cost Disclosure
  9. 9 Market Segmentation Analysis |
    1. 9.1 By Solution & Service | |
      1. 9.1.1 Clinical HCIT (EHR/EMR and More) | |
      2. 9.1.2 Nonclinical HCIT (Revenue Cycle Management and More) | |
      3. 9.1.3 Payer Solutions (Member Engagement and More) | |
      4. 9.1.4 HCIT Outsourcing Services |
    2. 9.2 By Component | |
      1. 9.2.1 Software | |
      2. 9.2.2 Services | |
      3. 9.2.3 Hardware |
    3. 9.3 By Deployment / Delivery Mode | |
      1. 9.3.1 On-Premises | |
      2. 9.3.2 Cloud | |
      3. 9.3.3 Hybrid |
    4. 9.4 By End User | |
      1. 9.4.1 Healthcare Providers | |
      2. 9.4.2 Payers | |
      3. 9.4.3 Life Sciences & Pharma | |
      4. 9.4.4 Other End Users
  10. 10 Competitive Landscape |
    1. 10.1 Market Concentration Analysis (2026) |
    2. 10.2 Competitive Benchmarking Matrix |
    3. 10.3 Company Profiles | |
      1. 10.3.1 Epic Systems | |
      2. 10.3.2 Oracle Health | |
      3. 10.3.3 Optum (UnitedHealth Group) | |
      4. 10.3.4 Philips Healthcare | |
      5. 10.3.5 GE HealthCare | |
      6. 10.3.6 Veradigm | |
      7. 10.3.7 Siemens Healthineers | |
      8. 10.3.8 MEDITECH | |
      9. 10.3.9 InterSystems | |
      10. 10.3.10 athenahealth | |
      11. 10.3.11 Dedalus | |
      12. 10.3.12 Cognizant
  11. 11 Recent News & Developments
  12. 12 Report Scope & Methodology
  13. 13 Detailed Sources & Citations
  14. 14 Frequently Asked Questions
  15. 15 LIST OF TABLES |
  16. TABLE 1 Global Healthcare IT Market Size & Forecast, by Revenue (USD Billion), 2021–2035 |
  17. TABLE 2 Global Healthcare IT Market – Year-over-Year Growth Analysis, 2021–2035 |
  18. TABLE 3 Driver Impact Analysis Matrix, 2026–2035 |
  19. TABLE 4 Restraint Impact Analysis Matrix, 2026–2035 |
  20. TABLE 5 Global Healthcare IT Market Size, by Region, 2021–2035 (USD Billion) |
  21. TABLE 6 North America Healthcare IT Market Size, by Country, 2021–2035 (USD Billion) |
  22. TABLE 7 Europe Healthcare IT Market Size, by Country, 2021–2035 (USD Billion) |
  23. TABLE 8 Asia-Pacific Healthcare IT Market Size, by Country, 2021–2035 (USD Billion) |
  24. TABLE 9 South America Healthcare IT Market Size, by Country, 2021–2035 (USD Billion) |
  25. TABLE 10 Middle East & Africa Healthcare IT Market Size, by Country, 2021–2035 (USD Billion) |
  26. TABLE 11 Global Healthcare IT Market Size, by Solution & Service, 2021–2035 (USD Billion) |
  27. TABLE 12 Global Healthcare IT Market Size, by Component, 2021–2035 (USD Billion) |
  28. TABLE 13 Global Healthcare IT Market Size, by Deployment / Delivery Mode, 2021–2035 (USD Billion) |
  29. TABLE 14 Global Healthcare IT Market Size, by End User, 2021–2035 (USD Billion) |
  30. TABLE 15 North America Healthcare IT Market Size, by Solution & Service, 2021–2035 (USD Billion) |
  31. TABLE 16 North America Healthcare IT Market Size, by Component, 2021–2035 (USD Billion) |
  32. TABLE 17 North America Healthcare IT Market Size, by Deployment Mode, 2021–2035 (USD Billion) |
  33. TABLE 18 North America Healthcare IT Market Size, by End User, 2021–2035 (USD Billion) |
  34. TABLE 19 Europe Healthcare IT Market Size, by Solution & Service, 2021–2035 (USD Billion) |
  35. TABLE 20 Europe Healthcare IT Market Size, by Component, 2021–2035 (USD Billion) |
  36. TABLE 21 Europe Healthcare IT Market Size, by Deployment Mode, 2021–2035 (USD Billion) |
  37. TABLE 22 Europe Healthcare IT Market Size, by End User, 2021–2035 (USD Billion) |
  38. TABLE 23 Asia-Pacific Healthcare IT Market Size, by Solution & Service, 2021–2035 (USD Billion) |
  39. TABLE 24 Asia-Pacific Healthcare IT Market Size, by Component, 2021–2035 (USD Billion) |
  40. TABLE 25 Asia-Pacific Healthcare IT Market Size, by Deployment Mode, 2021–2035 (USD Billion) |
  41. TABLE 26 Asia-Pacific Healthcare IT Market Size, by End User, 2021–2035 (USD Billion) |
  42. TABLE 27 South America Healthcare IT Market Size, by Solution & Service, 2021–2035 (USD Billion) |
  43. TABLE 28 South America Healthcare IT Market Size, by Component, 2021–2035 (USD Billion) |
  44. TABLE 29 South America Healthcare IT Market Size, by End User, 2021–2035 (USD Billion) |
  45. TABLE 30 Middle East & Africa Healthcare IT Market Size, by Solution & Service, 2021–2035 (USD Billion) |
  46. TABLE 31 Middle East & Africa Healthcare IT Market Size, by Component, 2021–2035 (USD Billion) |
  47. TABLE 32 Middle East & Africa Healthcare IT Market Size, by End User, 2021–2035 (USD Billion) |
  48. TABLE 33 US Healthcare IT Market Size, by Solution & Service, 2021–2035 (USD Billion) |
  49. TABLE 34 Germany Healthcare IT Market Size, by Solution & Service, 2021–2035 (USD Billion) |
  50. TABLE 35 China Healthcare IT Market Size, by Solution & Service, 2021–2035 (USD Billion) |
  51. TABLE 36 India Healthcare IT Market Size, by Solution & Service, 2021–2035 (USD Billion) |
  52. TABLE 37 Competitive Benchmarking Matrix – Global Healthcare IT Market, 2026 |
  53. TABLE 38 Company Profiles – Key Players, Global Healthcare IT Market |
  54. TABLE 39 Recent Developments & Strategic Announcements, 2023–2025 |
  55. TABLE 40 Report Scope & Methodology Summary |
  56. TABLE 41 Detailed Sources & Citations Index
  57. 16 LIST OF FIGURES |
  58. FIGURE 1 Global Healthcare IT Market Dynamics – Drivers, Restraints, Opportunities |
  59. FIGURE 2 Industry Value Chain Analysis – Healthcare IT |
  60. FIGURE 3 Porter's Five Forces Analysis – Healthcare IT |
  61. FIGURE 4 Global Market Size Trend & Forecast, 2021–2035 (USD Billion) |
  62. FIGURE 5 Year-over-Year Growth Curve, 2022–2035 (%) |
  63. FIGURE 6 Market Share by Solution & Service, 2025 vs 2035 (%) |
  64. FIGURE 7 Market Share by Component, 2025 vs 2035 (%) |
  65. FIGURE 8 Market Share by Deployment / Delivery Mode, 2025 vs 2035 (%) |
  66. FIGURE 9 Market Share by End User, 2025 vs 2035 (%) |
  67. FIGURE 10 Regional Share Distribution, 2025 (%) |
  68. FIGURE 11 Regional Share Distribution, 2035 (%) |
  69. FIGURE 12 Regional CAGR Comparison, 2026–2035 (%) |
  70. FIGURE 13 North America Country-Level Share, 2025 (%) |
  71. FIGURE 14 Europe Country-Level Share, 2025 (%) |
  72. FIGURE 15 Asia-Pacific Country-Level Share, 2025 (%) |
  73. FIGURE 16 Competitive Landscape – Estimated Revenue Share Ranges, 2026 |
  74. FIGURE 17 Competitive Positioning Quadrant – Capability vs Global Reach |
  75. FIGURE 18 Driver Impact Contribution to CAGR (Directional), 2026–2035 |
  76. FIGURE 19 Cloud vs On-Premises Deployment Migration Curve, 2021–2035 |
  77. FIGURE 20 Investment Theme Heatmap by Region, 2026–2035

Segmentation Quick Reference

DimensionSub-SegmentsDominant SegmentFastest Growing Segment
By Solution & ServiceClinical HCIT (EHR/EMR and More); Nonclinical HCIT (Revenue Cycle Management and More); Payer Solutions (Member Engagement and More); HCIT Outsourcing ServicesClinical HCIT (EHR/EMR and More)Clinical HCIT (EHR/EMR and More)
By ComponentSoftware; Services; HardwareServicesSoftware
By Deployment / Delivery ModeOn-Premises; Cloud; HybridOn-PremisesCloud
By End UserHealthcare Providers; Payers; Life Sciences & Pharma; Other End UsersHealthcare ProvidersLife Sciences & Pharma
By GeographyNorth America; Europe; Asia-Pacific; South America; Middle East & AfricaNorth AmericaAsia-Pacific


Market Segmentation Overview

By Solution & Service

Sub-SegmentKey Trend
Clinical HCIT (EHR/EMR and More)Platform replacement cycles bundle population-health analytics and ambient documentation into the core contract
Nonclinical HCIT (Revenue Cycle Management and More)Denial-prediction and autonomous coding deliver two-quarter payback, shortening approval cycles
Payer Solutions (Member Engagement and More)Prior-authorisation APIs and payment-integrity analytics absorb the majority of payer technology budgets
HCIT Outsourcing ServicesProvider IT staffing gaps push infrastructure operations and service-desk functions to managed partners


Clinical platforms remain the anchor purchase because they define the data model every other application must respect. Nonclinical categories grow faster in percentage terms, but they depend on clinical platform APIs for the transaction data that makes automation possible.

By Component

Sub-SegmentKey Trend
SoftwareSubscription conversion plus AI module attach lifts contract value 20–35% above base licence
ServicesImplementation and integration bill at multiples of first-year software spend; managed operations extend the annuity
HardwareImaging archives and edge compute refresh sustain demand despite cloud migration


Software captures the fastest growth as vendors shift pricing from seats to consumption and usage-based tiers. Services retain the largest share because health systems consistently underestimate integration and change-management effort, and hardware persists wherever latency or imaging volume defeats the cloud case.

By Deployment / Delivery Mode

Sub-SegmentKey Trend
On-PremisesData-residency policy and depreciated capital sustain large installed estates through 2030
CloudEvery net-new platform decision now defaults to cloud-native architecture
HybridPhased migration keeps latency-sensitive and regulated workloads local while analytics moves off-site


Cloud wins the decision but not yet the installed base. Hybrid architectures function as a multi-year transition state rather than a permanent design choice, and most large systems expect to complete migration in the early 2030s.

By End User

Sub-SegmentKey Trend
Healthcare ProvidersCompliance obligations and clinical platform ownership concentrate the largest budgets here
PayersAdministrative-cost pressure directs spending toward automation with measurable loss-ratio impact
Life Sciences & PharmaReal-world evidence pipelines and decentralised trial infrastructure drive the fastest buyer-side growth
Other End UsersPublic health agencies, diagnostic chains, and pharmacy networks digitise surveillance and supply-chain workflows


Providers dominate spending because regulation lands on them first. Life sciences grows fastest as sponsors source evidence directly from provider systems, converting what was once a research expense into recurring infrastructure investment.

By Geography

Sub-SegmentKey Trend
North AmericaEnforcement-driven compliance spending and rapid ambient AI adoption
EuropeEuropean Health Data Space transposition reshapes national procurement specifications
Asia-PacificSovereign digital-health missions create registry, consent, and exchange demand at population scale
South AmericaPublic-system digitisation led by Brazil's national exchange architecture
Middle East & AfricaGreenfield hospital programmes allow cloud-native specification without migration debt


Mature regions spend against deadlines; emerging regions spend against national programmes. That distinction explains why North America front-loads outlay in 2026–2028 while Asia-Pacific sustains double-digit growth well into the 2030s.


Download PDF ×

We do not share your information with anyone. However, we may send you emails based on your report interest from time to time. You may contact us at any time to opt-out.