Healthcare Claims Management Market (2026 - 2035)

ID: MRFR/HS/4915-HCR 90 Pages Rahul Gotadki Last Updated: September 10, 2026
Healthcare Claims Management Market Research Report: Size, Share, Trend Analysis By Types of Claim (Medical Claims, Dental Claims, Vision Claims, Pharmacy Claims), By End Users (Insurance Companies, Healthcare Providers, Third-Party Administrators), By Deployment Model (On-Premises, Cloud-Based), By Functionality (Claims Processing, Fraud Detection, Reporting and Analytics) and By Regional (North America, Europe, South America, Asia Pacific, Middle East and Africa) - Growth Outlook & Industry Forecast 2025 To 2035
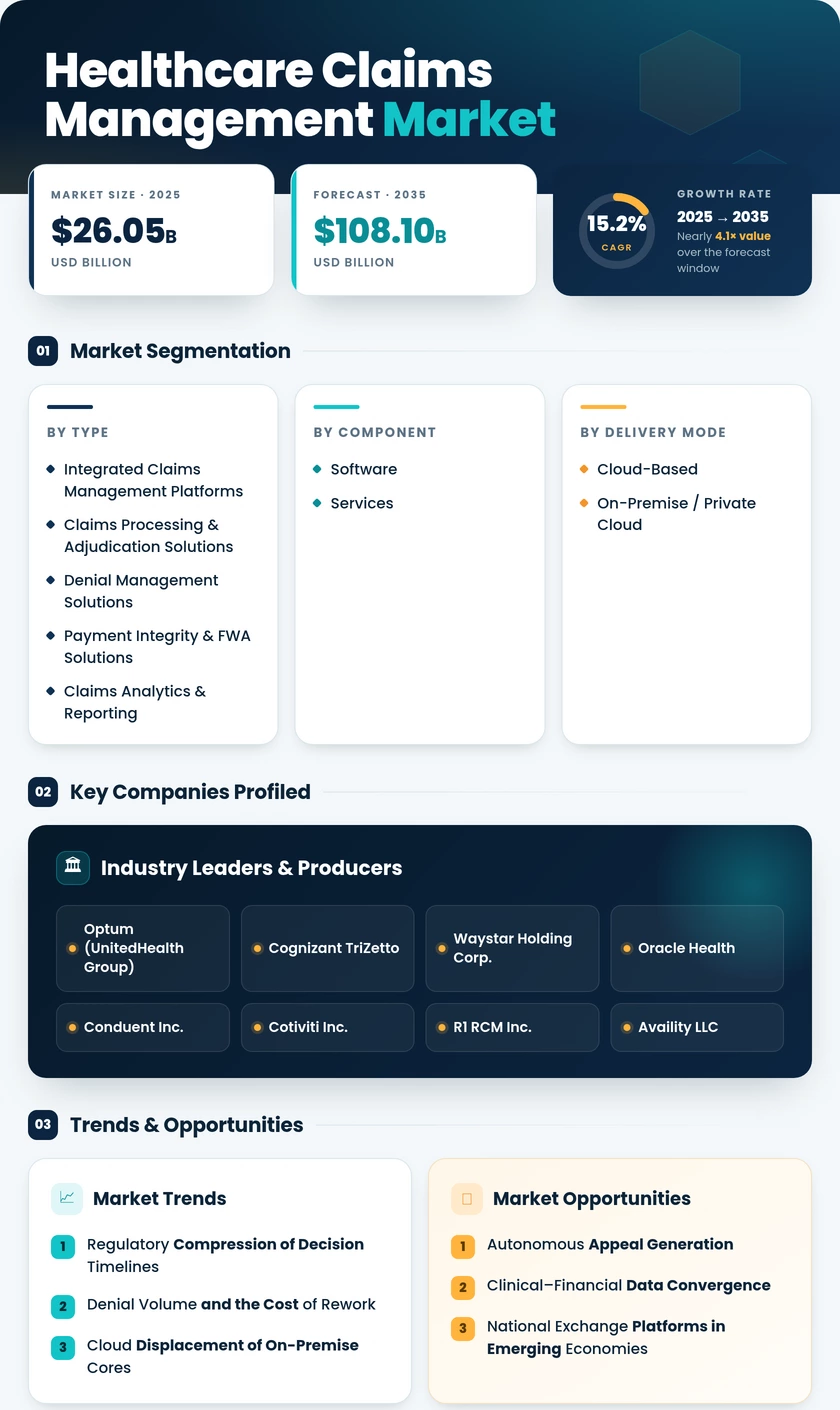
Healthcare Claims Management Market
Market Size
Forecast Period2026-2035
CAGR (2026-2035)15.2%
2025 Market SizeUSD 26.05 Billion
2035 Market SizeUSD 108.10 Billion
Key Players
Optum
Cognizant TriZetto
Waystar Holding Corp.
Oracle Health
Conduent Inc.
Cotiviti Inc.
Opportunities
  • Autonomous Appeal Generation
  • Clinical–Financial Data Convergence
  • National Exchange Platforms in Emerging Economies
  1. 1 Market Summary |
    1. 1.1 Study Assumptions & Market Definition |
    2. 1.2 Scope of the Study |
    3. 1.3 Research Methodology
  2. 2 Key Report Takeaways |
    1. 2.1 By Technology |
    2. 2.2 By Sector |
    3. 2.3 By Geography
  3. 3 Market Size & Forecast (2021–2035) |
    1. 3.1 Historical Market Size (2021–2024) |
    2. 3.2 Base Year Assessment (2025) |
    3. 3.3 Forecast Market Size (2026–2035) |
    4. 3.4 Year-over-Year Growth Analysis
  4. 4 Driver Impact Analysis |
    1. 4.1 Regulatory Compression of Decision Timelines |
    2. 4.2 Denial Volume and the Cost of Rework |
    3. 4.3 Cloud Displacement of On-Premise Cores |
    4. 4.4 Cyber-Resilience as a Purchase Criterion
  5. 5 Restraints Impact Analysis |
    1. 5.1 Migration Risk at the Core |
    2. 5.2 Divergent Data Governance |
    3. 5.3 Rule Fragmentation Across Payers
  6. 6 Opportunities |
    1. 6.1 Autonomous Appeal Generation |
    2. 6.2 Clinical–Financial Data Convergence |
    3. 6.3 National Exchange Platforms in Emerging Economies |
    4. 6.4 Data Monetization and Benchmarking Services |
    5. 6.5 Third-Party Administrator Outsourcing
  7. 7 Regional Market Share & Country-Level Analysis |
    1. 7.1 North America | |
      1. 7.1.1 US | |
      2. 7.1.2 Canada | |
      3. 7.1.3 Mexico |
    2. 7.2 Europe | |
      1. 7.2.1 Germany | |
      2. 7.2.2 UK | |
      3. 7.2.3 France | |
      4. 7.2.4 Italy | |
      5. 7.2.5 Spain | |
      6. 7.2.6 Nordic Countries | |
      7. 7.2.7 Russia | |
      8. 7.2.8 Rest of Europe |
    3. 7.3 Asia-Pacific | |
      1. 7.3.1 China | |
      2. 7.3.2 India | |
      3. 7.3.3 Japan | |
      4. 7.3.4 South Korea | |
      5. 7.3.5 ASEAN | |
      6. 7.3.6 Rest of Asia-Pacific |
    4. 7.4 South America | |
      1. 7.4.1 Brazil | |
      2. 7.4.2 Argentina | |
      3. 7.4.3 Rest of South America |
    5. 7.5 Middle East & Africa | |
      1. 7.5.1 Saudi Arabia | |
      2. 7.5.2 UAE | |
      3. 7.5.3 South Africa | |
      4. 7.5.4 Egypt | |
      5. 7.5.5 Rest of Middle East & Africa
  8. 8 Future Outlook (2026–2035) |
    1. 8.1 Autonomous Adjudication |
    2. 8.2 Platform Economics and Bundling |
    3. 8.3 Administrative Workforce Substitution |
    4. 8.4 Interoperability as Table Stakes
  9. 9 Market Segmentation Analysis |
    1. 9.1 By Solution Type | |
      1. 9.1.1 Integrated Claims Management Platforms | |
      2. 9.1.2 Claims Processing & Adjudication Solutions | |
      3. 9.1.3 Denial Management Solutions | |
      4. 9.1.4 Payment Integrity & FWA Solutions | |
      5. 9.1.5 Claims Analytics & Reporting |
    2. 9.2 By Component | |
      1. 9.2.1 Software | |
      2. 9.2.2 Services |
    3. 9.3 By Delivery Mode | |
      1. 9.3.1 Cloud-Based | |
      2. 9.3.2 On-Premise / Private Cloud |
    4. 9.4 By End-User | |
      1. 9.4.1 Healthcare Payers | |
      2. 9.4.2 Healthcare Providers | |
      3. 9.4.3 Third-Party Administrators | |
      4. 9.4.4 Other End-Users
  10. 10 Competitive Landscape |
    1. 10.1 Market Concentration Analysis (2026) |
    2. 10.2 Competitive Benchmarking Matrix |
    3. 10.3 Company Profiles
  11. 11 Recent News & Developments
  12. 12 Report Scope & Methodology
  13. 13 Detailed Sources & Citations
  14. 14 Frequently Asked Questions
  15. 15 LIST OF TABLES |
  16. TABLE 1 Global Healthcare Claims Management Market Size & Forecast, by Revenue (USD Billion), 2021–2035 |
  17. TABLE 2 Year-over-Year Growth Analysis, 2021–2035 |
  18. TABLE 3 Driver Impact Analysis Matrix, 2026–2035 |
  19. TABLE 4 Restraint Impact Analysis Matrix, 2026–2035 |
  20. TABLE 5 Market Size, by Region, 2021–2035 (USD Billion) |
  21. TABLE 6 North America Market Size, by Country, 2021–2035 (USD Billion) |
  22. TABLE 7 Europe Market Size, by Country, 2021–2035 (USD Billion) |
  23. TABLE 8 Asia-Pacific Market Size, by Country, 2021–2035 (USD Billion) |
  24. TABLE 9 South America Market Size, by Country, 2021–2035 (USD Billion) |
  25. TABLE 10 Middle East & Africa Market Size, by Country, 2021–2035 (USD Billion) |
  26. TABLE 11 Market Size, by Solution Type, 2021–2035 (USD Billion) |
  27. TABLE 12 Market Size, by Component, 2021–2035 (USD Billion) |
  28. TABLE 13 Market Size, by Delivery Mode, 2021–2035 (USD Billion) |
  29. TABLE 14 Market Size, by End-User, 2021–2035 (USD Billion) |
  30. TABLE 15 North America Market Size, by Solution Type, 2021–2035 (USD Billion) |
  31. TABLE 16 North America Market Size, by End-User, 2021–2035 (USD Billion) |
  32. TABLE 17 Europe Market Size, by Solution Type, 2021–2035 (USD Billion) |
  33. TABLE 18 Europe Market Size, by Delivery Mode, 2021–2035 (USD Billion) |
  34. TABLE 19 Asia-Pacific Market Size, by Solution Type, 2021–2035 (USD Billion) |
  35. TABLE 20 Asia-Pacific Market Size, by End-User, 2021–2035 (USD Billion) |
  36. TABLE 21 South America Market Size, by Component, 2021–2035 (USD Billion) |
  37. TABLE 22 Middle East & Africa Market Size, by Component, 2021–2035 (USD Billion) |
  38. TABLE 23 Competitive Benchmarking Matrix, 2026 |
  39. TABLE 24 Company Profiles — Key Players |
  40. TABLE 25 Recent Developments & Strategic Announcements, 2023–2026 |
  41. TABLE 26 Report Scope & Methodology Summary |
  42. TABLE 27 Detailed Sources & Citations
  43. 16 LIST OF FIGURES |
  44. FIGURE 1 Market Dynamics — Drivers, Restraints, Opportunities and Challenges |
  45. FIGURE 2 Industry Value Chain Analysis |
  46. FIGURE 3 Porter's Five Forces Analysis |
  47. FIGURE 4 Global Market Size Trend, 2021–2035 (USD Billion) |
  48. FIGURE 5 Year-over-Year Growth Curve, 2022–2035 |
  49. FIGURE 6 Market Share by Solution Type, 2025 vs 2035 |
  50. FIGURE 7 Market Share by Component, 2025 vs 2035 |
  51. FIGURE 8 Market Share by Delivery Mode, 2025 vs 2035 |
  52. FIGURE 9 Market Share by End-User, 2025 vs 2035 |
  53. FIGURE 10 Regional Revenue Share, 2025 |
  54. FIGURE 11 Regional CAGR Comparison, 2026–2035 |
  55. FIGURE 12 North America Country-Level Share, 2025 |
  56. FIGURE 13 Asia-Pacific Country-Level Growth Comparison, 2026–2035 |
  57. FIGURE 14 Competitive Positioning Quadrant, 2026 |
  58. FIGURE 15 Vendor Revenue Share Distribution, 2026 |
  59. FIGURE 16 M&A and Investment Activity Timeline, 2023–2026

Segmentation Quick Reference

DimensionSub-SegmentsDominant SegmentFastest Growing Segment
By Solution TypeIntegrated Claims Management Platforms; Claims Processing & Adjudication Solutions; Denial Management Solutions; Payment Integrity & FWA Solutions; Claims Analytics & ReportingIntegrated Claims Management PlatformsDenial Management Solutions
By ComponentSoftware; ServicesSoftwareServices
By Delivery ModeCloud-Based; On-Premise / Private CloudCloud-BasedCloud-Based
By End-UserHealthcare Payers; Healthcare Providers; Third-Party Administrators; Other End-UsersHealthcare PayersThird-Party Administrators
By GeographyNorth America; Europe; Asia-Pacific; South America; Middle East & AfricaNorth AmericaAsia-Pacific


Market Segmentation Overview

By Solution Type

Sub-SegmentKey Trend
Integrated Claims Management PlatformsVendor consolidation driving single-contract procurement
Claims Processing & Adjudication SolutionsMigration from batch to real-time transaction handling
Denial Management SolutionsPredictive scoring moving upstream into clinical documentation.
Payment Integrity & FWA SolutionsPre-payment review displacing pay-and-chase recovery
Claims Analytics & ReportingPublic metric disclosure creating benchmarking demand


Solution architecture is converging. Buyers who once assembled best-of-breed stacks now favour platforms that carry a claim from eligibility check through appeal, because integration overhead consumed the savings that point solutions promised.

By Component

Sub-SegmentKey Trend
SoftwarePerpetual licences giving way to subscription and outcome-based pricing
ServicesManaged-service demand rising as internal billing staff become harder to hire


Software captures the majority of spend, yet services determine whether that spend produces value. Vendors increasingly bundle multi-year managed delivery to protect renewal rates.

By Delivery Mode

Sub-SegmentKey Trend
Cloud-BasedContinuous payer-rule updates and elastic peak-season capacity
On-Premise / Private CloudRetained where data-residency law or core-system customization prevents migration


Cloud adoption is now the default posture for new deployments. On-premise persists mainly among large sovereign-regulated payers and legacy core estates with deeply customized adjudication logic.

By End-User

Sub-SegmentKey Trend
Healthcare PayersCompliance obligations concentrating investment in authorization workflow
Healthcare ProvidersCash-acceleration and appeal-recovery driving purchase decisions
Third-Party AdministratorsSelf-funded employer outsourcing expanding addressable volume.
Other End-UsersGovernment schemes and brokers digitizing settlement rails


Payers and providers buy for different reasons — one for compliance, one for cash — and vendors that serve both sides increasingly monetize the network effect between them.




Download PDF ×

We do not share your information with anyone. However, we may send you emails based on your report interest from time to time. You may contact us at any time to opt-out.