ID: MRFR/HCIT/4874-HCR | February 2021 | Region: Global | 85 pages
Market Scenario
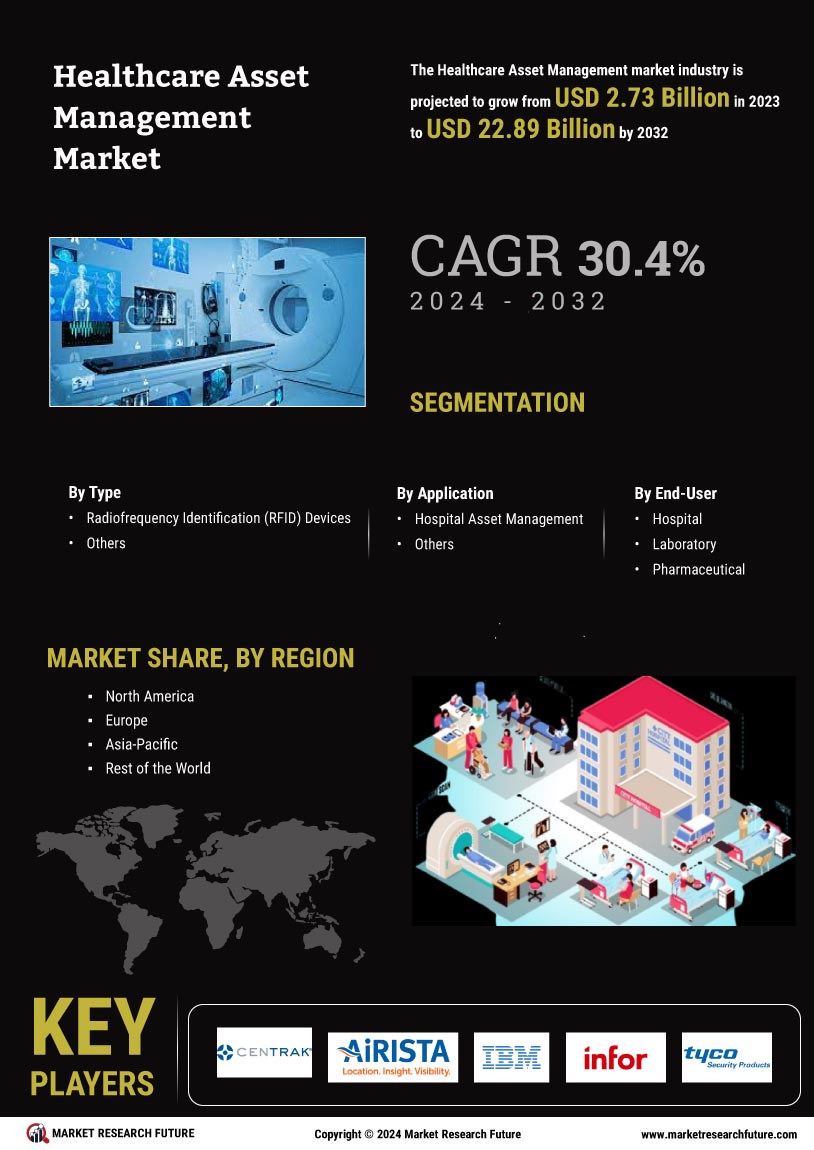
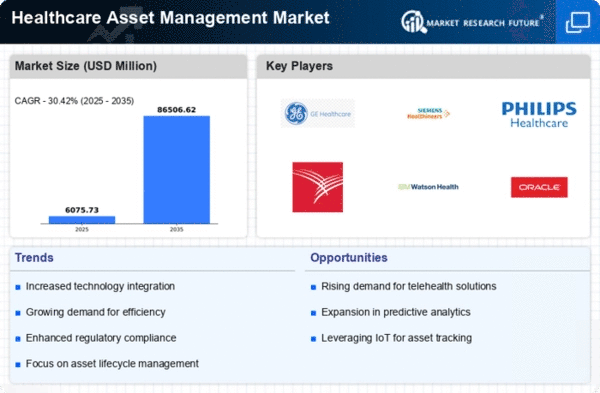
The healthcare asset management market is expected to grow during the forecast period (2018–2023) at a CAGR ~18.2%.
Healthcare asset management uses applications such as Radiofrequency Identification (RFID) and plays an important role in optimization and effective use of medical devices, managing inventory and reducing human error. The growing concern for patient safety, need to increase the efficiency of available resources, and acceptance of advanced technology in the healthcare sector are expected to drive the growth of the market. Moreover, rising R&D spending and strategies applied by major players such as new product development are contributing to the growth of the market. For instance, in August 2018, Infor Inc. which is a major player in the healthcare asset management sector announced the latest version of Enterprise Asset Management (EAM) software.
The rising concerns about patient safety, accuracy issues with the devices, the high installation cost of healthcare asset management tools, and poor implementation due to organizational and infrastructure issues may hamper the growth of the market during the assessment period.
Segmentation
The healthcare asset management market has been segmented on the basis of product, application, and end-user.
On the basis of product, the market has been classified as real-time location systems (RTLS), radiofrequency identification (RFID) devices and ultrasound & infrared tags. The real-time location systems (RTLS) segment has been further divided into hardware, software and services. The hardware segment has been further divided into tags/badges and readers/interrogators.
The radiofrequency identification (RFID) devices have been classified as hardware, and software and services. the hardware segment has been divided tags, readers/interrogators, and accessories. The tags sub-segment has been segmented into passive tags and active tags. The passive tags segment has been divided into high-frequency (HF) tags, ultra-high-frequency (UHF) tags and low-frequency (LF) tags. Furthermore, the application segment has been sub-segmented into hospital asset management and pharmaceutical asset management. The hospital asset management segment includes equipment tracking and management, patient management, temperature and humidity monitoring, staff management and infection control and hand hygiene compliance. The pharmaceutical asset management segment includes drug anti-counterfeiting and supply chain management.
The market, by end-user, has been segmented into Hospital/Clinic, Laboratories, Pharmaceutical companies, Biotechnology.
The market has been segmented, by region, into the Americas, Europe, Asia-Pacific, and the Middle East & Africa. The healthcare asset management market in the Americas has further been segmented into North America and South America, with the North American market divided into the US and Canada.
The European healthcare asset management market has been segmented into Western Europe and Eastern Europe. Western Europe has further been classified as Germany, France, the UK, Italy, Spain, and the rest of Western Europe.
The healthcare asset management market in Asia-Pacific has been segmented into Japan, China, India, South Korea, Australia, and the rest of Asia-Pacific. The healthcare asset management market in the Middle East & Africa has been segmented into the Middle East and Africa.
Regional Market Summary
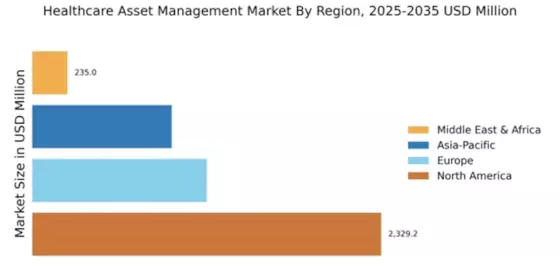
Healthcare Asset Management Market Share, by Region, 2017 (%)
Source: MRFR Analysis
The Americas are likely to dominate the healthcare asset management market owing to the adoption of highly advanced technology, increasing demand for new technology to stop fake drugs(Drug counterfeiting) and the presence of a well-established healthcare system as well as the presence of a huge network of healthcare service providers. According to the American hospital association, in the year 2016, a number of registered hospitals in the US was 5,534, roughly 2000 hospitals were present in the rural area and 3000+ hospitals were operating in the urban area.
The European market is expected to be the second-largest healthcare asset management market. The market growth in this region can be attributed to government funding and support of the healthcare sector coupled with increasing research and development. Moreover, increasing cases of drug counterfeiting is responsible for rising demand for healthcare asset management services and it is also contributing to the growth of the market in this region. According to the European intellectual property office drug, the counterfeit is a major problem in the healthcare sector. Revenue of USD 11.5 billion is lost per year because of drug counterfeiting and 10% of all medicines supplied globally are falsified.
Asia-Pacific is expected to be the fastest-growing healthcare asset management market during the forecast period owing to the increasing demand for easy to use asset management software’s, increasing digitalization in the region, and investments in healthcare and expansions by market players in the region.
The market in the Middle East & Africa is expected to account for the smallest share of the healthcare asset management market due to an underdeveloped healthcare sector, poor medical facilities and lack of technical knowledge
Key Players
Some of the key players in the healthcare asset management market are cenTrak, Airista Flow, GE Healthcare, IBM Corporation, Infor Inc., Tyco Security Products., Intelligent InSites, Motorola Solutions, Inc., Radianse, JADAK (a Novanta Company), Siemens Healthineers, Sonitor Technologies, Stanley Black & Decker, Inc., Ekahau, Inc.
Healthcare Asset Management Market, by Product
Healthcare Asset Management Market, by Application
Healthcare Asset Management Market, by End-User
Healthcare Asset Management Market, by Region
Intended Audience
Table of Contents:
Chapter 1. Report Prologue
Chapter 2. Market Introduction
2.1 Definition
2.2 Scope of the Study
2.2.1 Research Objective
2.2.2 Assumptions
2.2.3 Limitations
Chapter 3. Research Methodology
3.1 Introduction
3.2 Primary Research
3.3 Secondary Research
3.4 Market Size Estimation
Chapter 4. Market Dynamics
4.1 Drivers
4.2 Restraints
4.3 Opportunities
4.4 Challenges
4.5 Macroeconomic Indicators
4.6 Technology Trends & Assessment
Chapter 5. Market Factor Analysis
5.1 Porter’s Five Forces Analysis
5.1.1 Bargaining Power of Suppliers
5.1.2 Bargaining Power of Buyers
5.1.3 Threat of New Entrants
5.1.4 Threat of Substitutes
5.1.5 Intensity of Rivalry
5.2 Value Chain Analysis
5.3 Investment Feasibility Analysis
5.4 Pricing Analysis
Chapter 6. Healthcare Asset Management, by Product
6.1 Introduction
6.2 Real-Time Location Systems (RTLS)
6.2.1 Hardware
6.2.1.1 Tags/Badges
Market Estimates & Forecast, by Region, 2018–2023
Market Estimates & Forecast, by Country, 2018–2023
6.2.1.1 Readers/Interrogators
Market Estimates & Forecast, by Region, 2018–2023
Market Estimates & Forecast, by Country, 2018–2023
6.2.2 Software
Market Estimates & Forecast, by Region, 2018–2023
Market Estimates & Forecast, by Country, 2018–2023
6.2.3 Services
Market Estimates & Forecast, by Region, 2018–2023
Market Estimates & Forecast, by Country, 2018–2023
6.3 Radiofrequency Identification (RFID) Devices
6.3.1 Hardware
6.3.1.1 Tags
6.3.1.1.1 Passive Tags
6.3.1.1.1.1 High-Frequency (HF) Tags
Market Estimates & Forecast, by Region, 2018–2023
Market Estimates & Forecast, by Country, 2018–2023
6.3.1.1.1.2 Ultra-High-Frequency(UHF) Tags
Market Estimates & Forecast, by Region, 2018–2023
Market Estimates & Forecast, by Country, 2018–2023
6.3.1.1.1.3 Low-Frequency (LF) Tags
Market Estimates & Forecast, by Region, 2018–2023
Market Estimates & Forecast, by Country, 2018–2023
6.3.1.1.2 Passive Tags
Market Estimates & Forecast, by Region, 2018–2023
Market Estimates & Forecast, by Country, 2018–2023
6.3.1.2 Readers/Interrogators
Market Estimates & Forecast, by Region, 2018–2023
Market Estimates & Forecast, by Country, 2018–2023
6.3.1.2 Antennas
Market Estimates & Forecast, by Region, 2018–2023
Market Estimates & Forecast, by Country, 2018–2023
6.3.1.2 Accessories
Market Estimates & Forecast, by Region, 2018–2023
Market Estimates & Forecast, by Country, 2018–2023
6.3.3 Software
Market Estimates & Forecast, by Region, 2018–2023
Market Estimates & Forecast, by Country, 2018–2023
6.3.4 Services
Market Estimates & Forecast, by Region, 2018–2023
Market Estimates & Forecast, by Country, 2018–2023
6.4 Ultrasound & Infrared Tags
Market Estimates & Forecast, by Region, 2018–2023
Market Estimates & Forecast, by Country, 2018–2023
Chapter 7. Healthcare Asset Management Market, by Application
7.1 Introduction
7.2 Hospital Asset Management
7.2.1 Equipment Tracking and Management
Market Estimates & Forecast, by Region, 2018–2023
Market Estimates & Forecast, by Country, 2018–2023
7.2.2 Patient Management
Market Estimates & Forecast, by Region, 2018–2023
Market Estimates & Forecast, by Country, 2018–2023
7.2.3 Temperature and Humidity Monitoring
Market Estimates & Forecast, by Region, 2018–2023
Market Estimates & Forecast, by Country, 2018–2023
7.2.3 Staff Management
Market Estimates & Forecast, by Region, 2018–2023
Market Estimates & Forecast, by Country, 2018–2023
7.2.4 Infection Control and Hand Hygiene Compliance
Market Estimates & Forecast, by Region, 2018–2023
Market Estimates & Forecast, by Country, 2018–2023
7.3 Pharmaceutical Asset Management
7.3.1 Drug Anti-Counterfeiting
Market Estimates & Forecast, by Region, 2018–2023
Market Estimates & Forecast, by Country, 2018–2023
7.3.2 Supply Chain Management
Market Estimates & Forecast, by Region, 2018–2023
Market Estimates & Forecast, by Country, 2018–2023
Chapter 8. Healthcare Asset Management Market, by End-User
8.1 Introduction
8.2 Hospital/Clinic
Market Estimates & Forecast, by Region, 2018–2023
Market Estimates & Forecast, by Country, 2018–2023
8.3 Laboratories
Market Estimates & Forecast, by Region, 2018–2023
Market Estimates & Forecast, by Country, 2018–2023
8.4 Pharmaceutical companies
Market Estimates & Forecast, by Region, 2018–2023
Market Estimates & Forecast, by Country, 2018–2023
8.5 Biotechnology firms
Market Estimates & Forecast, by Region, 2018–2023
Market Estimates & Forecast, by Country, 2018–2023
Chapter 9. Healthcare Asset Management Market, by Region
9.1 Introduction
9.2 Americas
9.2.1 North America
9.2.1.1 US
9.2.1.2 Canada
9.2.2 South America
9.3 Europe
9.3.1 Western Europe
9.3.1.1 Germany
9.3.1.2 France
9.3.1.3 Italy
9.3.1.4 Spain
9.3.1.5 UK
9.3.1.6 Rest of Western Europe
9.3.2 Eastern Europe
9.4 Asia-Pacific
9.4.1 Japan
9.4.2 China
9.4.3 India
9.4.4 Australia
9.4.5 South Korea
9.4.6 Rest of Asia-Pacific
9.5 Middle East & Africa
9.5.1 Middle East
9.5.2 Africa
Chapter 10. Company Landscape
10.1 Introduction
10.2 Market Share Analysis
10.3 Key Development & Strategies
Chapter 11. Company Profiles
11.1 CenTrak
11.1.1 Company Overview
11.1.2 Product Overview
11.1.3 Financials Overview
11.1.4 Key Developments
11.1.5 SWOT Analysis
11.2 Airista Flow
11.2.1 Company Overview
11.2.2 Product Overview
11.2.3 Financial Overview
11.2.4 Key Developments
11.2.5 SWOT Analysis
11.3 GE Healthcare
11.3.1 Company Overview
11.3.2 Product Overview
11.3.3 Financial Overview
11.3.4 Key Development
11.3.5 SWOT Analysis
11.4 IBM Corporation
11.4.1 Company Overview
11.4.2 Technology/Business Segment Overview
11.4.3 Financial Overview
11.4.4 Key Development
11.4.5 SWOT Analysis
11.5 Infor Inc.
11.5.1 Company Overview
11.5.2 Product Overview
11.5.3 Financial overview
11.5.4 Key Developments
11.5.5 SWOT Analysis
11.6 Tyco Security Products.
11.6.1 Company Overview
11.6.2 Product Overview
11.6.3 Financial Overview
11.6.4 Key Developments
11.6.5 SWOT Analysis
11.7 Intelligent InSites
11.7.1 Overview
11.7.2 Product Overview
11.7.3 Financial Overview
11.7.4 Key Developments
11.7.5 SWOT Analysis
11.8 Intelligent InSites
11.8.1 Overview
11.8.2 Product/ Technology Overview
11.8.3 Financials
11.8.4 Key Developments
11.8.5 SWOT Analysis
11.9 Motorola Solutions, Inc.
11.9.1 Overview
11.9.2 Product Overview
11.9.3 Financials
11.9.4 Key Developments
11.9.5 SWOT Analysis
11.10 Radianse
11.10.1 Overview
11.10.2 Product Overview
11.10.3 Financials
11.10.4 Key Developments
11.10.5 SWOT Analysis
11.11 JADAK(a Novanta Company)
11.11.1 Overview
11.11.2 Product Overview
11.11.3 Financials
11.11.4 Key Developments
11.11.5 SWOT Analysis
11.12 Siemens Healthineers
11.12.1 Overview
11.12.2 Product Overview
11.12.3 Financials
11.12.4 Key Developments
11.12.5 SWOT Analysis
11.13 Sonitor Technologies
11.13.1 Overview
11.13.2 Product Overview
11.13.3 Financials
11.13.4 Key Developments
11.13.5 SWOT Analysis
11.14 Stanley Black & Decke
11.14.1 Overview
11.14.2 Product Overview
11.14.3 Financials
11.14.4 Key Developments
11.14.5 SWOT Analysis
11.15 Ekahau, Inc.
11.15.1 Overview
11.15.2 Product Overview
11.15.3 Financials
11.15.4 Key Developments
11.15.5 SWOT Analysis
Chapter 12 MRFR Conclusion
12.1 Key Findings
12.1.1 From CEO’s Viewpoint
12.1.2 Unmet Needs of the Market
12.2 Key Companies to Watch
12.3 Predictions for the Healthcare Asset Management Industry
Chapter 13. Appendix
LIST OF TABLES
Table 1 Healthcare Asset Management Market Synopsis, 2018–2023
Table 2 Healthcare Asset Management Market Estimates and Forecast, 2018–2023 (USD Million)
Table 3 Healthcare Asset Management Market, by Region, 2018–2023 (USD Million)
Table 4 Healthcare Asset Management Market, by Product, 2018–2023 (USD Million)
Table 5 Healthcare Asset Management Market, by Application, 2018–2023 (USD Million)
Table 6 Healthcare Asset Management Market, by, End-User 2018–2023 (USD Million)
Table 7 North America: Healthcare Asset Management Market, by Product, 2018–2023 (USD
Million)
Table 8 North America: Healthcare Asset Management Market, by Application, 2018–2023 (USD
Million)
Table 9 North America: Healthcare Asset Management Market, by, End-User 2018–2023 (USD
Million)
Table 10 US: Healthcare Asset Management Market, by Product, 2018–2023 (USD Million)
Table 11 US: Healthcare Asset Management Market, by Application, 2018–2023 (USD Million)
Table 12 US: Healthcare Asset Management Market, by, End-User 2018–2023 (USD Million)
Table 13 Canada: Healthcare Asset Management Market, by Product, 2018–2023 (USD Million)
Table 14 Canada: Healthcare Asset Management Market, by Application, 2018–2023 (USD Million)
Table 15 Canada: Healthcare Asset Management Market, by, End-User 2018–2023 (USD
Million)
Table 16 South America: Healthcare Asset Management Market, by Product, 2018–2023 (USD
Million)
Table 17 South America: Healthcare Asset Management Market, by Application, 2018–2023 (USD
Million)
Table 18 South America: Healthcare Asset Management Market, by, End-User 2018–2023 (USD
Million)
Table 19 Europe: Healthcare Asset Management Market, by Product, 2018–2023 (USD Million)
Table 20 Europe: Healthcare Asset Management Market, by Application, 2018–2023 (USD Million)
Table 21 Europe: Healthcare Asset Management Market, by, End-User 2018–2023 (USD Million)
Table 22 Western Europe: Healthcare Asset Management Market, by Product, 2018–2023 (USD
Million)
Table 23 Western Europe: Healthcare Asset Management Market, by Application, 2018–2023 (USD
Million)
Table 24 Western Europe: Healthcare Asset Management Market, by End-User, 2018–2023
(USD Million)
Table 25 Eastern Europe: Healthcare Asset Management Market, by Product, 2018–2023 (USD
Million)
Table 26 Eastern Europe: Healthcare Asset Management Market, by Application, 2018–2023 (USD
Million)
Table 27 Eastern Europe: Healthcare Asset Management Market, by End-User, 2018–2023
(USD Million)
Table 28 Asia-Pacific: Healthcare Asset Management Market, by Product, 2018–2023 (USD
Million)
Table 29 Asia-Pacific: Healthcare Asset Management Market, by Application, 2018–2023 (USD
Million)
Table 30 Asia-Pacific: Healthcare Asset Management Market, by End-User, 2018–2023 (USD
Million)
Table 31 Middle East & Africa: Healthcare Asset Management Market, by Product, 2018–2023
(USD Million)
Table 32 Middle East & Africa: Healthcare Asset Management Market, by Application, 2018–2023
(USD Million)
Table 33 Middle East & Africa: Healthcare Asset Management Market, by End-User, 2018–2023
(USD Million)
LIST OF FIGURES
Figure 1 Research Process
Figure 2 Segmentation for Healthcare Asset Management Market
Figure 3 Segmentation Market Dynamics for Healthcare Asset Management Market
Figure 4 Healthcare Asset Management Market Share, by Product, 2017
Figure 5 Healthcare Asset Management Market Share, by Application, 2017
Figure 6 Healthcare Asset Management Market Share, by End-User, 2017
Figure 7 Healthcare Asset Management Market Share, by Region, 2017
Figure 8 North America: Healthcare Asset Management Market Share, by Country, 2017
Figure 9 Europe: Healthcare Asset Management Market Share, by Country, 2017
Figure 10 Asia-Pacific: Healthcare Asset Management Market Share, by Country, 2017
Figure 11 Middle East & Africa: Healthcare Asset Management Market Share, by Country, 2017
Figure 12 Healthcare Asset Management Market: Company Share Analysis, 2017 (%)
Figure 13 CenTrak: Key Financials
Figure 14 CenTrak: Segmental Revenue
Figure 15 CenTrak: Geographical Revenue
Figure 16 Airista Flow.: Key Financials
Figure 17 Airista Flow.: Segmental Revenue
Figure 18 Airista Flow.: Geographical Revenue
Figure 19 GE Healthcare: Key Financials
Figure 20 GE Healthcare: Segmental Revenue
Figure 21 GE Healthcare: Geographical Revenue
Figure 22 IBM Corporation: Key Financials
Figure 23 IBM Corporation: Segmental Revenue
Figure 24 IBM Corporation: Geographical Revenue
Figure 25 Infor Inc.: Key Financials
Figure 26 Infor Inc.: Segmental Revenue
Figure 27 Infor Inc. Geographical Revenue
Figure 28 Tyco Security Products: Key Financials
Figure 29 Tyco Security Products: Segmental Revenue
Figure 30 Tyco Security Products: Geographical Revenue
Figure 31 Intelligent InSites: Key Financials
Figure 32 Intelligent InSites: Segmental Revenue
Figure 33 Intelligent InSites: Geographical Revenue
Figure 34 Intelligent InSites: Key Financials
Figure 35 Intelligent InSites: Segmental Revenue
Figure 36 Intelligent InSites: Geographical Revenue
Figure 37 Motorola Solutions, Inc.: Key Financials
Figure 38 Motorola Solutions, Inc.: Segmental Revenue
Figure 39 Motorola Solutions, Inc.: Geographical Revenue
Figure 40 Radianse: Key Financials
Figure 41 Radianse: Segmental Revenue
Figure 42 Radianse: Geographical Revenue
Figure 43 JADAK(a Novanta Company): Key Financials
Figure 44 JADAK(a Novanta Company): Segmental Revenue
Figure 45 JADAK(a Novanta Company): Geographical Revenue
Figure 46 Siemens Healthineers: Key Financials
Figure 47 Siemens Healthineers: Segmental Revenue
Figure 48 Siemens Healthineers: Geographical Revenue
Figure 49 Sonitor Technologies.: Key Financials
Figure 50 Sonitor Technologies.: Segmental Revenue
Figure 51 Sonitor Technologies.: Geographical Revenue
Figure 52 Stanley Black & Decke: Key Financials
Figure 53 Stanley Black & Decke: Segmental Revenue
Figure 54 Stanley Black & Decke: Geographical Revenue
Figure 55 Ekahau, Inc.: Key Financials
Figure 56 Ekahau, Inc.: Segmental Revenue
Figure 57 Ekahau, Inc.: Geographical Revenue