ID: MRFR/F-B & N/2128-HCR | February 2021 | Region: Global | 90 pages
Market Scenario
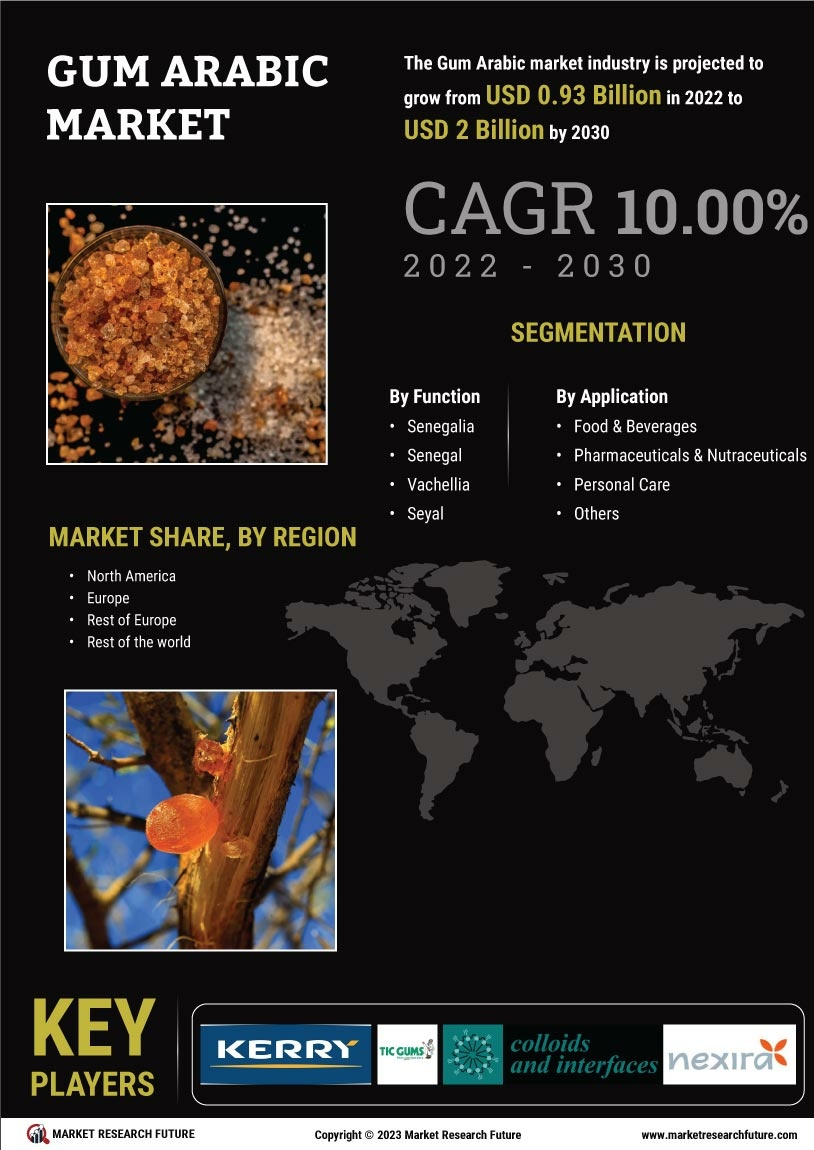
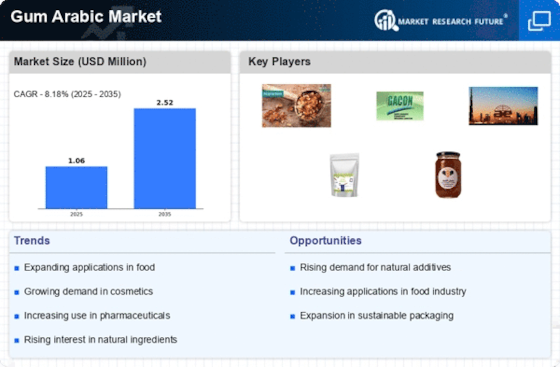
Gum arabic is collected from Acacia species, predominantly Senegalia (Acacia) Senegal and Vachellia (Acacia) Seyal. These trees are grown in abundance in central Sudan, central Africa and in West Africa. Gum arabic is commonly used in the food & beverages, pharmaceuticals, personal care industries as emulsifier and stabilizer and as suspending agent for insoluble drugs. Additionally, the use of gum arabic as a thickening agent in the production of chewing gums, as an additive in ceramic glazes, as a binder for manufacturing watercolor paints, and as an adhesive for rolling papers used in cigarettes makes it among the most popular natural emulsifier in the world. Therefore, due to the increasing applications of gum arabic in various industries, it is expected to drive the growth of gum arabic market. The global gum arabic market is expected to register a growth rate of 4.4% during the forecast period of 2019 to 2024 to reach USD 1.2 billion by 2024.
The global gum arabic market is expected to grow with an impressive growth rate during the forecast period owing to the high preference for natural products in food & beverage industry. Additionally, a rise in consumption of gum arabic is witnessed owing to its high dietary fiber content, which aids in healthy digestion and bowel movement. With this, manufacturers are also focusing on promoting the nutritional benefits of gum arabic as organic or high fiber products.
Segmentation
The global gum arabic market has been segmented based on type, function, application, and region.
By type, the global market has been divided into Senegalia (Acacia) Senegal and Vachellia (Acacia) Seyal. The Senegalia (Acacia) Senegal segment is expected to garner the largest revenue share and also is expected to be the fastest-growing segment in the global gum arabic industry.
On the basis of function, the global market is segmented into thickeners, stabilizers, gelling agent, and others. The use of gum arabic as thickeners or thickening agents hold the major market share and is also expected to be the fastest-growing segment during the review period.
Based application, the global market has also been segregated into food & beverages pharmaceuticals & nutraceuticals, personal care, and others. The food & beverages segment is further segregated into bakery & confectionery, dairy & frozen products, beverages, sauces, dips & dressings, and others.
The food & beverages segment is expected to gain the highest revenue share of the global gum arabic market. Gum arabic are mostly used in aerated drinks as a stabilizer and helps to prevent the sugar from settling to the bottom in the beverages. Additionally, in the food industry, it is primarily used in confectionery, bakery, dairy, beverage, and as a microencapsulating agent. Therefore, the same segment is expected to garner the fastest growth during the forecast period.
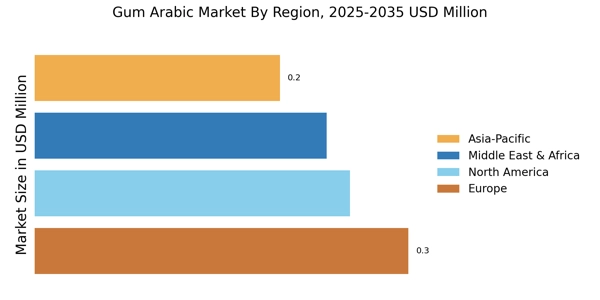
The global gum arabic market has been studied with regard to four key regions—North America, Europe, Asia-Pacific, and the rest of the world.
The North American gum arabic market has further been segmented into the US, Canada, and Mexico. The European gum arabic industry has been classified as the UK, Germany, France, Italy, Spain, and the rest of Europe. The gum arabic industry in Asia-Pacific has been segmented into China, India, Japan, Australia & New Zealand, and the rest of Asia-Pacific. The gum arabic market in the rest of the world has been segmented into South America, the Middle East, and Africa.
Key Players
Regional Market Summary
Global Gum Arabic Market Share (%), by Region, 2018
Source: Secondary Sources and MRFR Analysis
North America is projected to gain the largest share in the gum arabic market. The US and Canada are among the major markets contributing to the regional market growth. Moreover, Asia-Pacific is expected to showcase highest growth rate in the market during the forecast period, owing to the increasing applications of gum arabic in the pharmaceutical and personal care industries. Increasing use of gum arabic in ceramics, printmaking, and painting is expected to play key role in the growth of the gum arabic industry in Asia-Pacific.
Furthermore, in lower-calorie confectionary products, gum arabic is used to compensate for the loss of texture, mouthfeel, and body, which usually occurs due to replacement of sugars by artificial sweeteners. Furthermore, it is also used in chewing gum as a coating agent and as a pigment stabilizer. Thus, due to established food & beverages industry in North America and growing industry in developing countries of Asia-Pacific, the consumption of gum arabic is expected to grow at high rate.
Global Gum Arabic Market, by Type
Global Market, by Function
Global Market, by Application
Global Market, by Region
Intended Audience
Frequently Asked Questions (FAQ) :
The projected Gum Arabic Market valuation would be USD 1.2 billion.
The projected CAGR for Gum Arabic Market would be 4.4% during the forecast period.
The thickeners or thickening segment would drive Gum Arabic Market.
The food & beverage segment would lead Gum Arabic Market.
The Senegalia segment would lead gum Arabic market.
Table of Contents
1. 1 EXECUTIVE SUMMARY
1.1. Market Attractiveness Analysis
1.1.1. Global Gum Arabic Market, by Type
1.1.2. Global Gum Arabic Market, by Function
1.1.3. Global Gum Arabic Market, by Application
1.1.4. Global Gum Arabic Market, by Region
2. MARKET INTRODUCTION
2.1. Definition
2.2. Scope of the Study
2.3. Market Structure
2.4. Key Buying Criteria
2.5. Macro Factor Indicator Analysis
3. RESEARCH METHODOLOGY
3.1. Research Process
3.2. Primary Research
3.3. Secondary Research
3.4. Market Size Estimation
3.5. Forecast Model
3.6. List of Assumptions
4. MARKET DYNAMICS
4.1. Introduction
4.2. Drivers
4.2.1. Driver 1
4.2.2. Driver 2
4.3. Restraints
4.3.1. Restraint 1
4.3.2. Restraint 2
4.4. Opportunities
4.4.1. Opportunity 1
4.4.2. Opportunity 2
4.5. Challenges
4.5.1. Challenge 1
4.5.2. Challenge 2
5. MARKET FACTOR ANALYSIS
5.1. Value Chain Analysis
5.2. Supply Chain Analysis
5.3. Porter’s Five Forces Model
5.3.1. Bargaining Power of Suppliers
5.3.2. Bargaining Power of Buyers
5.3.3. Threat of New Entrants
5.3.4. Threat of Substitutes
5.3.5. Intensity of Rivalry
6. GLOBAL GUM ARABIC MARKET, BY TYPE
6.1. Introduction
6.2. Senegalia (Acacia) Senegal
6.2.1. Senegalia (Acacia) Senegal: Market Estimates & Forecast, by Region/Country, 2019–2024
6.3. Vachellia (Acacia) Seyal
6.3.1. Vachellia (Acacia) Seyal: Market Estimates & Forecast, by Region/Country, 2019–2024
7. GLOBAL GUM ARABIC MARKET, BY FUNCTION
7.1. Introduction
7.2. Thickeners
7.2.1. Thickeners: Market Estimates & Forecast, by Region/Country, 2019–2024
7.3. Stabilizers
7.3.1. Stabilizers: Market Estimates & Forecast, by Region/Country, 2019–2024
7.4. Gelling Agent
7.4.1. Gelling Agent: Market Estimates & Forecast, by Region/Country, 2019–2024
7.5. Others
7.5.1. Others: Market Estimates & Forecast, by Region/Country, 2019–2024
8. GLOBAL GUM ARABIC MARKET, BY APPLICATION
8.1. Introduction
8.2. Food & Beverages
8.2.1. Food & Beverages: Market Estimates & Forecast, by Region/Country, 2019–2024
8.2.2. Bakery & Confectionery
8.2.2.1. Bakery & Confectionery: Market Estimates & Forecast, by Region/Country, 2019–2024
8.2.3. Dairy & Frozen Products
8.2.3.1. Dairy & Frozen Products: Market Estimates & Forecast, by Region/Country, 2019–2024
8.2.4. Beverages
8.2.4.1. Beverages: Market Estimates & Forecast, by Region/Country, 2019–2024
8.2.5. Sauces, Dips & Dressings
8.2.5.1. Sauces, Dips & Dressings: Market Estimates & Forecast, by Region/Country, 2019–2024
8.2.6. Others
8.2.6.1. Others: Market Estimates & Forecast, by Region/Country, 2019–2024
8.3. Pharmaceuticals & Nutraceuticals
8.3.1. Pharmaceuticals & Nutraceuticals: Market Estimates & Forecast, by Region/Country, 2019–2024
8.4. Personal Care
8.4.1. Personal care: Market Estimates & Forecast, by Region/Country, 2019–2024
8.5. Others
8.5.1. Others: Market Estimates & Forecast, by Region/Country, 2019–2024
9. GLOBAL GUM ARABIC MARKET, BY REGION
9.1. Introduction
9.2. North America
9.2.1. Market Estimates & Forecast, by Type, 2019–2024
9.2.2. Market Estimates & Forecast, by Function, 2019–2024
9.2.3. Market Estimates & Forecast, by Application, 2019–2024
9.2.4. Market Estimates & Forecast, by Country, 2019–2024
9.2.5. US
9.2.5.1. Market Estimates & Forecast, by Type, 2019–2024
9.2.5.2. Market Estimates & Forecast, by Function, 2019–2024
9.2.5.3. Market Estimates & Forecast, by Application, 2019–2024
9.2.6. Canada
9.2.6.1. Market Estimates & Forecast, by Type, 2019–2024
9.2.6.2. Market Estimates & Forecast, by Function, 2019–2024
9.2.6.3. Market Estimates & Forecast, by Application, 2019–2024
9.2.7. Mexico
9.2.7.1. Market Estimates & Forecast, by Type, 2019–2024
9.2.7.2. Market Estimates & Forecast, by Function, 2019–2024
9.2.7.3. Market Estimates & Forecast, by Application, 2019–2024
9.3. Europe
9.3.1. Market Estimates & Forecast, by Type, 2019–2024
9.3.2. Market Estimates & Forecast, by Function, 2019–2024
9.3.3. Market Estimates & Forecast, by Application, 2019–2024
9.3.4. Market Estimates & Forecast, by Country, 2019–2024
9.3.5. Germany
9.3.5.1. Market Estimates & Forecast, by Type, 2019–2024
9.3.5.2. Market Estimates & Forecast, by Function, 2019–2024
9.3.5.3. Market Estimates & Forecast, by Application, 2019–2024
9.3.6. UK
9.3.6.1. Market Estimates & Forecast, by Type, 2019–2024
9.3.6.2. Market Estimates & Forecast, by Function, 2019–2024
9.3.6.3. Market Estimates & Forecast, by Application, 2019–2024
9.3.7. France
9.3.7.1. Market Estimates & Forecast, by Type, 2019–2024
9.3.7.2. Market Estimates & Forecast, by Function, 2019–2024
9.3.7.3. Market Estimates & Forecast, by Application, 2019–2024
9.3.8. Spain
9.3.8.1. Market Estimates & Forecast, by Type, 2019–2024
9.3.8.2. Market Estimates & Forecast, by Function, 2019–2024
9.3.8.3. Market Estimates & Forecast, by Application, 2019–2024
9.3.9. Italy
9.3.9.1. Market Estimates & Forecast, by Type, 2019–2024
9.3.9.2. Market Estimates & Forecast, by Function, 2019–2024
9.3.9.3. Market Estimates & Forecast, by Application, 2019–2024
9.3.10. Rest of Europe
9.3.10.1. Market Estimates & Forecast, by Type, 2019–2024
9.3.10.2. Market Estimates & Forecast, by Function, 2019–2024
9.3.10.3. Market Estimates & Forecast, by Application, 2019–2024
9.4. Asia-Pacific
9.4.1. Market Estimates & Forecast, by Type, 2019–2024
9.4.2. Market Estimates & Forecast, by Function, 2019–2024
9.4.3. Market Estimates & Forecast, by Application, 2019–2024
9.4.4. Market Estimates & Forecast, by Country, 2019–2024
9.4.5. China
9.4.5.1. Market Estimates & Forecast, by Type, 2019–2024
9.4.5.2. Market Estimates & Forecast, by Function, 2019–2024
9.4.5.3. Market Estimates & Forecast, by Application, 2019–2024
9.4.6. Japan
9.4.6.1. Market Estimates & Forecast, by Type, 2019–2024
9.4.6.2. Market Estimates & Forecast, by Function, 2019–2024
9.4.6.3. Market Estimates & Forecast, by Application, 2019–2024
9.4.7. India
9.4.7.1. Market Estimates & Forecast, by Type, 2019–2024
9.4.7.2. Market Estimates & Forecast, by Function, 2019–2024
9.4.7.3. Market Estimates & Forecast, by Application, 2019–2024
9.4.8. Australia & New Zealand
9.4.8.1. Market Estimates & Forecast, by Type, 2019–2024
9.4.8.2. Market Estimates & Forecast, by Function, 2019–2024
9.4.8.3. Market Estimates & Forecast, by Application, 2019–2024
9.4.9. Rest of Asia-Pacific
9.4.9.1. Market Estimates & Forecast, by Type, 2019–2024
9.4.9.2. Market Estimates & Forecast, by Function, 2019–2024
9.4.9.3. Market Estimates & Forecast, by Application, 2019–2024
9.5. Rest of the World
9.5.1. Market Estimates & Forecast, by Type, 2019–2024
9.5.2. Market Estimates & Forecast, by Function, 2019–2024
9.5.3. Market Estimates & Forecast, by Application, 2019–2024
9.5.4. Market Estimates & Forecast, by Region, 2019–2024
9.5.5. South America
9.5.5.1. Market Estimates & Forecast, by Type, 2019–2024
9.5.5.2. Market Estimates & Forecast, by Function, 2019–2024
9.5.5.3. Market Estimates & Forecast, by Application, 2019–2024
9.5.6. Middle East
9.5.6.1. Market Estimates & Forecast, by Type, 2019–2024
9.5.6.2. Market Estimates & Forecast, by Function, 2019–2024
9.5.6.3. Market Estimates & Forecast, by Application, 2019–2024
9.5.7. Africa
9.5.7.1. Market Estimates & Forecast, by Type, 2019–2024
9.5.7.2. Market Estimates & Forecast, by Function, 2019–2024
9.5.7.3. Market Estimates & Forecast, by Application, 2019–2024
10. COMPETITIVE LANDSCAPE
10.1. Introduction
10.2. Competitive Benchmarking
10.3. Development Share Analysis
10.4. Key Developments & Growth Strategies
11. COMPANY PROFILES
11.1. The Gums and Colloids Group
11.1.1. Company Overview
11.1.2. Financial Overview
11.1.3. Products Offered
11.1.4. Key Developments
11.1.5. SWOT Analysis
11.1.6. Key Strategies
11.2. Nexira
11.2.1. Company Overview
11.2.2. Financial Overview
11.2.3. Products Offered
11.2.4. Key Developments
11.2.5. SWOT Analysis
11.2.6. Key Strategies
11.3. Kerry Group plc
11.3.1. Company Overview
11.3.2. Financial Overview
11.3.3. Products Offered
11.3.4. Key Developments
11.3.5. SWOT Analysis
11.3.6. Key Strategies
11.4. Tic Gums Inc
11.4.1. Company Overview
11.4.2. Financial Overview
11.4.3. Products Offered
11.4.4. Key Developments
11.4.5. SWOT Analysis
11.4.6. Key Strategies
11.5. Agrigum International Limited
11.5.1. Company Overview
11.5.2. Financial Overview
11.5.3. Products Offered
11.5.4. Key Developments
11.5.5. SWOT Analysis
11.5.6. Key Strategies
11.6. Farbest Brands
11.6.1. Company Overview
11.6.2. Financial Overview
11.6.3. Products Offered
11.6.4. Key Developments
11.6.5. SWOT Analysis
11.6.6. Key Strategies
11.7. Archer Daniels Midland Company
11.7.1. Company Overview
11.7.2. Financial Overview
11.7.3. Products Offered
11.7.4. Key Developments
11.7.5. SWOT Analysis
11.7.6. Key Strategies
11.8. Ashland Global Specialty Chemicals Inc.
11.8.1. Company Overview
11.8.2. Financial Overview
11.8.3. Products Offered
11.8.4. Key Developments
11.8.5. SWOT Analysis
11.8.6. Key Strategies
11.9. Alland & Robert S.A
11.9.1. Company Overview
11.9.2. Financial Overview
11.9.3. Products Offered
11.9.4. Key Developments
11.9.5. SWOT Analysis
11.9.6. Key Strategies
11.10. Hawkins Watts Limited
11.10.1. Company Overview
11.10.2. Financial Overview
11.10.3. Products Offered
11.10.4. Key Developments
11.10.5. SWOT Analysis
11.10.6. Key Strategies
11.11. CE Roeper GmbH
11.11.1. Company Overview
11.11.2. Financial Overview
11.11.3. Products Offered
11.11.4. Key Developments
11.11.5. SWOT Analysis
11.11.6. Key Strategies
11.12. Alpha Agricultural Processing Co. LTD
11.12.1. Company Overview
11.12.2. Financial Overview
11.12.3. Products Offered
11.12.4. Key Developments
11.12.5. SWOT Analysis
11.12.6. Key Strategies
11.13. SOMAR Corporation
11.13.1. Company Overview
11.13.2. Financial Overview
11.13.3. Products Offered
11.13.4. Key Developments
11.13.5. SWOT Analysis
11.13.6. Key Strategies
11.14. Dar Savanna Ltd
11.14.1. Company Overview
11.14.2. Financial Overview
11.14.3. Products Offered
11.14.4. Key Developments
11.14.5. SWOT Analysis
11.14.6. Key Strategies
11.15. UPL
11.15.1. Company Overview
11.15.2. Financial Overview
11.15.3. Products Offered
11.15.4. Key Developments
11.15.5. SWOT Analysis
11.15.6. Key Strategies
12. APPENDIX
12.1. General Sources & References
12.2. List of Abbreviation
LIST OF TABLES
Table 1 Global Gum Arabic Market, by Region, 2018–2023 (USD Million)
Table 2 Global Gum Arabic Market, by Type, 2018–2023 (USD Million)
Table 3 Global Gum Arabic Market, by Function, 2018–2023 (USD Million)
Table 4 Global Gum Arabic Market, by Application, 2018–2023 (USD Million)
Table 5 North America: Gum Arabic Market, by Country, 2018–2023 (USD Million)
Table 6 North America: Gum Arabic Market, by Type, 2018–2023 (USD Million)
Table 7 North America: Gum Arabic Market, by Function, 2018–2023 (USD Million)
Table 8 North America: Gum Arabic Market, by Application, 2018–2023 (USD Million)
Table 9 US: Gum Arabic Market, by Type, 2018–2023 (USD Million)
Table 10 US: Gum Arabic Market, by Function, 2018–2023 (USD Million)
Table 11 US: Gum Arabic Market, by Application, 2018–2023 (USD Million)
Table 12 Canada: Gum Arabic Market, by Type, 2018–2023 (USD Million)
Table 13 Canada: Gum Arabic Market, by Function, 2018–2023 (USD Million)
Table 14 Canada: Gum Arabic Market, by Application, 2018–2023 (USD Million)
Table 15 Mexico: Gum Arabic Market, by Type, 2018–2023 (USD Million)
Table 16 Mexico: Gum Arabic Market, by Function, 2018–2023 (USD Million)
Table 17 Mexico: Gum Arabic Market, by Application, 2018–2023 (USD Million)
Table 18 Europe: Gum Arabic Market, by Country, 2018–2023 (USD Million)
Table 19 Europe: Gum Arabic Market, by Type, 2018–2023 (USD Million)
Table 20 Europe: Gum Arabic Market, by Function, 2018–2023 (USD Million)
Table 21 Europe: Gum Arabic Market, by Application, 2018–2023 (USD Million)
Table 22 Germany: Gum Arabic Market, by Type, 2018–2023 (USD Million)
Table 23 Germany: Gum Arabic Market, by Function, 2018–2023 (USD Million)
Table 24 Germany: Gum Arabic Market, by Application, 2018–2023 (USD Million)
Table 25 France: Gum Arabic Market, by Type, 2018–2023 (USD Million)
Table 26 France: Gum Arabic Market, by Function, 2018–2023 (USD Million)
Table 27 France: Gum Arabic Market, by Application, 2018–2023 (USD Million)
Table 28 Italy: Gum Arabic Market, by Type, 2018–2023 (USD Million)
Table 29 Italy: Gum Arabic Market, by Function, 2018–2023 (USD Million)
Table 30 Italy: Gum Arabic Market, by Application, 2018–2023 (USD Million)
Table 31 Spain: Gum Arabic Market, by Type, 2018–2023 (USD Million)
Table 32 Spain: Gum Arabic Market, by Function, 2018–2023 (USD Million)
Table 33 Spain: Gum Arabic Market, by Application, 2018–2023 (USD Million)
Table 34 UK: Gum Arabic Market, by Type, 2018–2023 (USD Million)
Table 35 UK: Gum Arabic Market, by Function, 2018–2023 (USD Million)
Table 36 UK: Gum Arabic Market, by Application, 2018–2023 (USD Million)
Table 37 Rest of Europe: Gum Arabic Market, by Type, 2018–2023 (USD Million)
Table 38 Rest of Europe: Gum Arabic Market, by Function, 2018–2023 (USD Million)
Table 39 Rest of Europe: Gum Arabic Market, by Application, 2018–2023 (USD Million)
Table 40 Asia-Pacific: Gum Arabic Market, by Country, 2018–2023 (USD Million)
Table 41 Asia-Pacific: Gum Arabic Market, by Type, 2018–2023 (USD Million)
Table 42 Asia-Pacific: Gum Arabic Market, by Function, 2018–2023 (USD Million)
Table 43 Asia-Pacific: Gum Arabic Market, by Application, 2018–2023 (USD Million)
Table 44 China: Gum Arabic Market, by Type, 2018–2023 (USD Million)
Table 45 China: Gum Arabic Market, by Function, 2018–2023 (USD Million)
Table 46 China: Gum Arabic Market, by Application, 2018–2023 (USD Million)
Table 47 India: Gum Arabic Market, by Type, 2018–2023 (USD Million)
Table 48 India: Gum Arabic Market, by Function, 2018–2023 (USD Million)
Table 49 India: Gum Arabic Market, by Application, 2018–2023 (USD Million)
Table 50 Japan: Gum Arabic Market, by Type, 2018–2023 (USD Million)
Table 51 Japan: Gum Arabic Market, by Function, 2018–2023 (USD Million)
Table 52 Japan: Gum Arabic Market, by Application, 2018–2023 (USD Million)
Table 53 Australia & New Zealand: Gum Arabic Market, by Type, 2019–2024 (USD Million)
Table 54 Australia & New Zealand: Gum Arabic Market, by Function ,2019–2024 (USD Million)
Table 55 Australia & New Zealand: Gum Arabic Market, by Application, 2019–2024 (USD Million)
Table 56 Rest of Asia-Pacific: Gum Arabic Market, by Type, 2018–2023 (USD Million)
Table 57 Rest of Asia-Pacific: Gum Arabic Market, by Function, 2018–2023 (USD Million)
Table 58 Rest of Asia-Pacific: Gum Arabic Market, by Application, 2018–2023 (USD Million)
Table 59 Rest of the World (RoW): Gum Arabic Market, by Country, 2018–2023 (USD Million)
Table 60 Rest of the World (RoW): Gum Arabic Market, by Type, 2018–2023 (USD Million)
Table 61 Rest of the World (RoW): Gum Arabic Market, by Function, 2018–2023 (USD Million)
Table 62 Rest of the World (RoW): Gum Arabic Market, by Application, 2018–2023 (USD Million)
Table 63 South America: Gum Arabic Market, by Type, 2018–2023 (USD Million)
Table 64 South America: Gum Arabic Market, by Function, 2018–2023 (USD Million)
Table 65 South America: Gum Arabic Market, by Application, 2018–2023 (USD Million)
Table 66 Middle East: Gum Arabic Market, by Type, 2018–2023 (USD Million)
Table 67 Middle East: Gum Arabic Market, by Function, 2018–2023 (USD Million)
Table 68 Middle East: Gum Arabic Market, by Application, 2018–2023 (USD Million)
Table 69 Africa: Gum Arabic Market, by Type, 2018–2023 (USD Million)
Table 70 Africa: Gum Arabic Market, by Function, 2018–2023 (USD Million)
Table 71 Africa: Gum Arabic Market, by Application, 2018–2023 (USD Million)
LIST OF FIGURES
FIGURE 1 Global Gum Arabic Market Segmentation
FIGURE 2 Forecast Research Methodology
FIGURE 3 Five Forces Analysis of the Global Gum Arabic Market
FIGURE 4 Value Chain of the Global Gum Arabic Market
FIGURE 5 Share of the Global Gum Arabic Market in 2018, by Country (%)
FIGURE 6 Global Gum Arabic Market, by Region, 2019–2024,
FIGURE 7 Global Gum Arabic Market Size, by Type, 2018
FIGURE 8 Share of the Global Gum Arabic Market, by Type, 2019–2024 (%)
FIGURE 9 Global Gum Arabic Market Size, by Function, 2018
FIGURE 10 Share of the Global Gum Arabic Market, by Function, 2019–2024 (%)
FIGURE 9 Global Gum Arabic Market Size, by Application, 2018
FIGURE 10 Share of the Global Gum Arabic Market, by Application, 2019–2024 (%)