Green Hydrogen Market (2025 - 2035)

Green Hydrogen Market Size, Share & Growth Analysis Report By Technology (Alkaline Electrolysis, PEM Electrolysis, Solid Oxide Electrolysis, AEM Electrolysis), By End-User Industry (Refining, Chemicals, Iron and Steel, Transportation, Other End Users) and By Regional (North America, Europe, South America, Asia Pacific, Middle East and Africa) – Industry Growth & Forecast to 2035.
ID: MRFR/EnP/8605-CR
188 Pages
Chitranshi Jaiswal
Last Updated: June 26, 2026
Green Hydrogen Market

Market Size

Forecast Period2025-2035
CAGR (2025-2035)80.8%
2025 Market SizeUSD 680 Million
2035 Market SizeUSD 260,170 Million

Key Players

Nel ASA
ITM Power
Plug Power
Siemens Energy
thyssenkrupp nucera
Bloom Energy
Opportunities
  • Green Ammonia for Maritime Decarbonization
  • Hydrogen-Ready Steel via Direct Reduced Iron
  • Emerging-Market Hydrogen Export Corridors

Green Hydrogen Market Summary

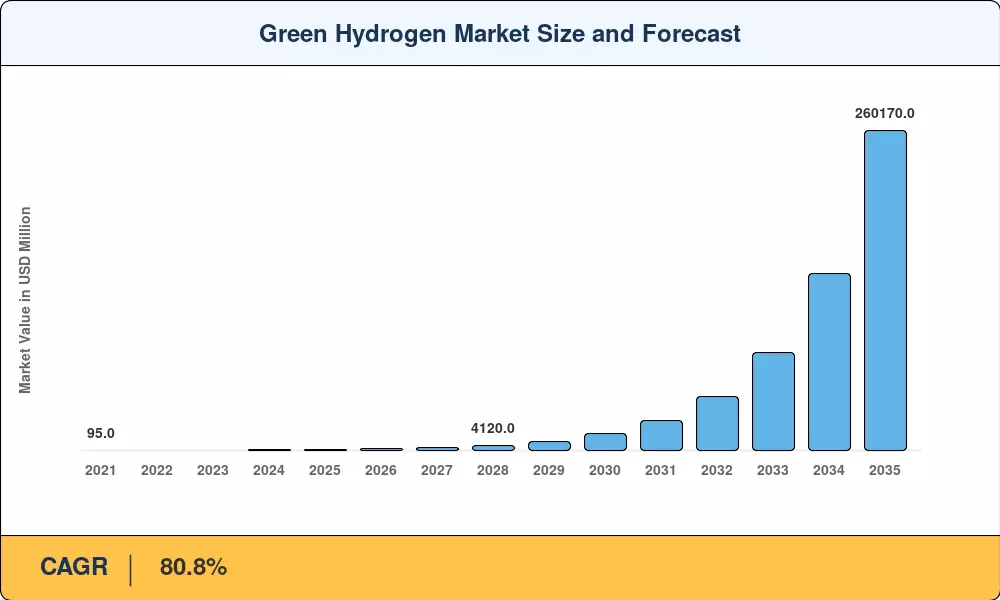
The Green Hydrogen Market stood at USD 680 Million in 2025 and is projected to reach USD 1,260 Million in 2026 before climbing to USD 260,170 Million by 2035, reflecting a CAGR of 80.8% over the 2026–2035 forecast period. Two forces are pulling this trajectory upward: the EU's EUR 3 billion Hydrogen Bank auction rounds, which have triggered binding offtake contracts across refineries and steelmakers, and the U.S. Inflation Reduction Act's Section 45V production tax credit, which now delivers up to USD 3.00 per kilogram of qualifying clean hydrogen [1][2]. Together, these policy anchors have converted what was a pilot-stage curiosity into a bankable asset class.

On the technology front, the shift away from fossil-derived gray hydrogen is accelerating faster than most 2022-era projections anticipated. Electrolyzer gigafactories announced between 2023 and 2025 — representing over 35 GW of combined annual manufacturing capacity — are pushing stack costs below USD 400/kW for atmospheric alkaline units and below USD 650/kW for polymer-electrolyte-membrane systems [3]. Renewable electricity purchase agreements struck at sub-USD 25/MWh in the Middle East and parts of South America are compressing the levelized cost of hydrogen toward USD 2.50/kg, a threshold widely regarded as the competitiveness crossover against unabated gray hydrogen [4].

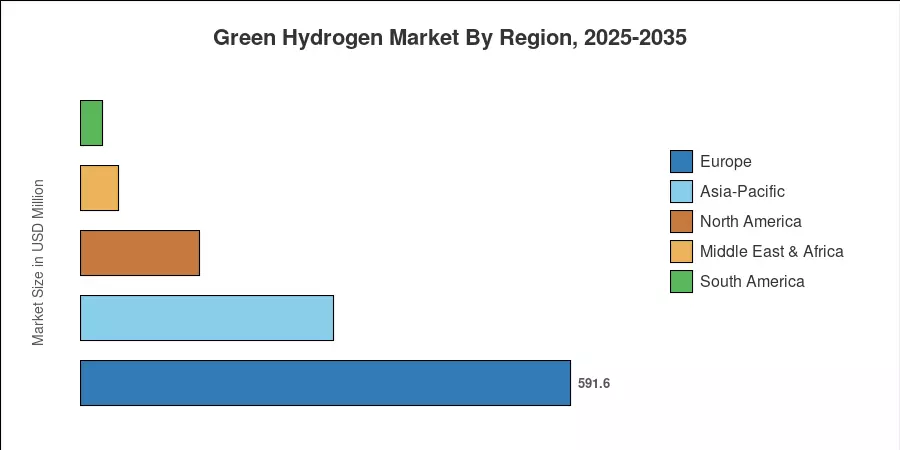
Asia-Pacific controlled approximately 45% of the Green Hydrogen Market in 2025, driven by China's National Hydrogen Roadmap targets and India's National Green Hydrogen Mission, which earmarked USD 2.3 billion in incentives [5]. Europe is the fastest-growing region, forecast to register an 87% CAGR through 2035 as carbon border adjustment obligations and REPowerEU mandates compel industrial buyers to lock in green supply. North America accounted for the second-largest share, underpinned by project announcements across the U.S. Gulf Coast hydrogen hub corridors. The next decade will separate early-mover economies that build pipeline and port infrastructure from those forced to import molecules at a premium.


Key Report Takeaways

• By Technology

  • Alkaline electrolysis commanded roughly 51% of global installed capacity in 2025, anchored by mature stack designs and lower upfront capital intensity.
  • PEM electrolysis is forecast to register the highest segment CAGR at approximately 99% through 2035, driven by superior dynamic-response characteristics that pair well with variable renewable generation.

• By End-User Industry

  • Refining held an estimated 38% share of the Green Hydrogen Market in 2025, as petroleum processors began substituting gray feedstock to meet scope-1 decarbonization targets.
  • The chemicals segment is projected to expand at roughly 90% CAGR to 2035, reflecting green ammonia commitments from fertilizer producers across Europe and South Asia.

• By Region

  • Asia-Pacific captured about 45% of the Green Hydrogen Market in 2025, led by state-backed electrolyzer deployment in China and India.
  • Europe is expected to advance at approximately 87% CAGR through 2035, propelled by binding renewable-hydrogen mandates under the revised Renewable Energy Directive.


Green Hydrogen Market Size and Forecast (2021–2035)

Market sizing combines bottom-up electrolyzer capacity tracking with top-down demand modeling across end-user verticals. Historical figures (2021–2024) draw on operational project databases, while forecasts incorporate announced FID-stage projects, committed policy subsidies, and proprietary cost-learning curves for electrolyzer stacks and renewable power procurement.

Green Hydrogen Market Size and Forecast
Our Impact
Enabled $4.3B Revenue Impact for Fortune 500 and Leading Multinationals
Partnering with 2000+ Global Organizations Each Year
30K+ Citations by Top-Tier Firms in the Industry

Driver Impact Analysis

Driver ~% Impact on CAGR Geographic Relevance Impact Timeline
Renewable power cost deflation ~22% Global Long-term (≥4 yr)
Government production subsidies & tax credits ~20% North America, Europe Short-term (≤2 yr)
Carbon pricing & border adjustment mechanisms ~16% Europe, Asia-Pacific Medium-term (2–4 yr)
Electrolyzer manufacturing scale-up ~15% China, Europe Medium-term (2–4 yr)
Industrial decarbonization mandates ~12% Europe, Japan, South Korea Long-term (≥4 yr)
Green ammonia & e-fuel offtake contracts ~9% Middle East, South America Medium-term (2–4 yr)
Hydrogen pipeline & storage infrastructure investment ~6% Europe, U.S. Gulf Coast Long-term (≥4 yr)


Renewable Power Cost Deflation

Solar PV auction prices in the Middle East have fallen below USD 15/MWh, while onshore wind in Brazil and Chile regularly clears at USD 22–28/MWh [4]. Since electricity accounts for 60–70% of the levelized cost of green hydrogen, every ten-percent drop in power costs translates into roughly a seven-percent reduction in the final molecule price. IRENA's 2024 outlook projects utility-scale solar LCOE declining a further 35% by 2030, meaning electrolyzer operators signing 15-year PPAs today can undercut gray hydrogen on a delivered-cost basis across most geographies by 2029 [12].

Government Production Subsidies and Tax Credits

The U.S. 45V clean hydrogen production tax credit can deliver up to USD 3.00/kg over ten years, effectively halving the production cost of electrolytic hydrogen in regions with favorable renewable resources [2]. In Europe, the Hydrogen Bank's second auction round in 2025 awarded EUR 2.2 billion in fixed-premium support contracts, covering the cost gap between green and gray hydrogen for winning bidders across Germany, Spain, and Portugal [1]. These public-finance mechanisms reduce project risk to a level where commercial banks will lend at investment-grade spreads.

Carbon Pricing and Border Adjustment Mechanisms

The EU Carbon Border Adjustment Mechanism (CBAM) began its transitional phase in 2023 and will require full certificate purchases from 2026, covering hydrogen, steel, aluminum, cement, and fertilizer imports [8]. For refiners importing gray-hydrogen-intensive products into Europe, the effective carbon penalty at EUR 70–90/tonne CO₂ adds USD 1.80–2.30/kg to the hydrogen-equivalent cost, eliminating most of gray hydrogen's price advantage. The CBAM signal is already redirecting project-development capital toward North African green hydrogen export corridors targeting European demand.

Electrolyzer Manufacturing Scale-Up

Announced electrolyzer gigafactory capacity exceeded 45 GW per annum by mid-2025, with LONGi Hydrogen, Nel ASA, and thyssenkrupp nucera each targeting multi-GW output lines [3]. This manufacturing expansion is replicating the cost-learning dynamics that solar PV experienced between 2010 and 2020 — a doubling of cumulative production correlates with a 16–18% reduction in stack costs. BloombergNEF projects electrolyzer system prices declining to USD 230–350/kW by 2030, compared to USD 500–800/kW in 2024 [13].


Restraints Impact Analysis

Restraint ~% Negative Impact on CAGR Geographic Relevance Impact Timeline
High initial capital expenditure for electrolyzers ~25% Global Short-term (≤2 yr)
Limited hydrogen transport & storage infrastructure ~22% Europe, North America Medium-term (2–4 yr)
Water scarcity in high-irradiance regions ~18% Middle East, North Africa, Australia Long-term (≥4 yr)
Additionality and temporal-matching regulatory uncertainty ~20% EU, U.S. Short-term (≤2 yr)
Electrolyzer supply-chain bottlenecks (iridium, nickel) ~15% Global Medium-term (2–4 yr)


High Initial Capital Expenditure

Despite rapid cost-learning, a 100 MW electrolyzer installation still requires USD 60–80 million in upfront capital, excluding balance-of-plant and grid-connection costs [3]. For project developers operating outside subsidy-rich jurisdictions, the capital burden translates into internal rates of return below 8% — a threshold that many infrastructure funds consider unattractive without sovereign guarantees or concessional-debt wrappers. Until stack prices fall to below USD 300/kW on a turnkey basis, bankability will remain the primary gate for projects in emerging economies.

Infrastructure Gaps in Transport and Storage

Moving hydrogen from production hubs to demand centers remains the Green Hydrogen Market's most stubborn logistical challenge. Dedicated hydrogen pipelines total fewer than 5,000 km globally, compared to over 3 million km of natural-gas transmission lines [11]. Repurposing existing gas pipelines requires metallurgical assessments for hydrogen embrittlement, and the permitting timeline in the EU alone averages 4–5 years. Salt-cavern storage — the lowest-cost bulk option — is geographically concentrated in the U.S. Gulf Coast, Northern Germany, and the UK's East Yorkshire, leaving much of Asia-Pacific dependent on above-ground compressed or liquefied storage at two to four times the unit cost [17].

Additionality and Temporal-Matching Uncertainty

The EU Delegated Act on renewable-hydrogen definitions and the U.S. Treasury's 45V final guidance both impose additionality and temporal-correlation requirements on the renewable electricity used for electrolysis [15]. Strict hourly matching, as mandated in the EU from 2030, can raise the effective cost of electricity procurement by 10–25% compared to annual matching, because electrolyzers must either curtail output during low-renewable-generation hours or procure premium-priced certificates. Regulatory ambiguity around these rules between 2024 and 2026 has already delayed final investment decisions on several European projects totaling over 2 GW of planned capacity.


Green Hydrogen Market Opportunities

Green Ammonia for Maritime Decarbonization

The International Maritime Organization’s 2023 updated GHG strategy calls for a 30% decrease in shipping emissions by 2030 compared with 2008 levels, which translates to an addressable demand pool of 80–100 million tonnes of green ammonia per year by 2040 [10]. Electrolyzer projects next to ports in the Middle East, Chile and Australia are preparing to feed ammonia bunkering terminals, turning stranded renewable resources into export-grade fuel molecules.


Hydrogen-Ready Steel via Direct Reduced Iron

European steel producers have committed more than EUR 15 billion to hydrogen-based DRI facilities, with SSAB’s HYBRIT plant in Sweden and ArcelorMittal’s Hamburg project already producing trial batches [9]. This would take around 60,000 tonnes of green hydrogen yearly to produce a million tonnes of DRI grade steel, providing guaranteed industrial baseload demand to de-risk electrolyzer investments. India’s National Green Hydrogen Mission expressly targets a 5 MTPA steel-sector hydrogen demand corridor by 2035.


Emerging-Market Hydrogen Export Corridors

Countries with fantastic solar or wind resources – Namibia, Morocco, Oman and Chile – are in the process of setting themselves up as hydrogen export economies. The Hyphen project in Namibia alone aims for 350,000 tons per year of green hydrogen to be converted to ammonia and exported directly to Europe [18]. These corridors offer first-mover investment possibilities for developers willing to overcome earlier-stage regulatory regimes, frequently with concessional financial backing from multilateral development banks.


Hydrogen-as-a-Service Business Models

Many developers now offer hydrogen-as-a-service contracts where the developer owns and manages the electrolyzer on the customer's site on a fixed-price, take-or-pay contract, rather than taking on the entire project risk. This concept emulates the power purchase agreement model that enabled distributed solar, reducing the barrier to the buyer from a capital expenditure decision to an operating expenditure line item. Both Linde and Air Liquide have launched on-site electrolyser leasing programmes aimed at medium-scale industrial users between 5-20MW.


Digital Twins and Predictive Optimization

Integrating digital-twin platforms with electrolyzer control systems enables real-time optimization of stack degradation, electricity procurement, and water chemistry. Siemens Energy's Omnivise Digital platform has demonstrated 3–5% improvements in hydrogen yield per MWh consumed across pilot sites [19]. As margins tighten in competitive subsidy auctions, these incremental efficiency gains will determine which projects clear the profitability threshold and which fall short.


Green Hydrogen Market Future Outlook

AI-Optimized Electrolyzer Operations

Machine-learning-driven control systems will reshape electrolyzer plant economics over the next decade. By dynamically adjusting stack current density, water flow rates, and electricity procurement timing in response to real-time grid price signals, AI-based dispatching can improve hydrogen output by 8–12% at constant electricity input [19]. As the Green Hydrogen Market scales into tens of GW of installed capacity, even marginal efficiency gains compound into billions of dollars of additional value creation annually.

Hydrogen Pipeline and Blending Networks

The European Hydrogen Backbone initiative envisions 53,000 km of dedicated hydrogen pipelines by 2040, approximately 60% of which would involve repurposing existing natural gas infrastructure [11]. In the United States, the DOE has committed USD 1.2 billion to hydrogen pipeline and storage demonstration projects through the IIJA. Blending hydrogen into existing natural-gas networks at 5–20% concentration is also gaining regulatory approval as a transitional measure, with several utilities in Australia and Germany already conducting blending trials.

Electrification Supercycle and Grid-Balancing Services

Green hydrogen electrolyzers function as large-scale flexible loads that can absorb surplus renewable generation during curtailment events. IEA analysis indicates that global renewable curtailment exceeded 700 TWh in 2024, representing molecule-conversion potential worth over 14 million tonnes of hydrogen per year [12]. As variable renewable penetration surpasses 50% of installed generation capacity in leading markets, electrolyzers will increasingly participate in ancillary-services markets, earning revenue from both the hydrogen molecule and grid-balancing functions.

ESG Reporting and Scope-3 Hydrogen Certification

The International Sustainability Standards Board (ISSB) S2 climate standard and the EU's Corporate Sustainability Reporting Directive (CSRD) are compelling downstream manufacturers to quantify and decarbonize scope-3 emissions — including the carbon intensity of purchased hydrogen [21]. Certification schemes such as CertifHy in Europe and the Clean Hydrogen Standard under the U.S. DOE are establishing verified carbon-intensity thresholds that green hydrogen producers can monetize through premium pricing. This reporting-driven demand layer creates structural pull for the Green Hydrogen Market independent of commodity-price competitiveness.


Green Hydrogen Market Segmentation

By Technology

Segment Key Metric Primary Demand Driver
Alkaline Electrolysis ~51% share (2025) Mature technology, lowest capex per kW
PEM Electrolysis ~99% CAGR (2026–2035) Dynamic response, compact footprint for variable RE
Solid Oxide Electrolysis ~USD 12 Million (2025) High-temperature industrial heat integration
AEM Electrolysis ~108% CAGR (2026–2035) Non-PGM catalysts, emerging cost potential


Alkaline electrolysis remains the workhorse of the Green Hydrogen Market, underpinned by decades of industrial deployment and a supply chain dominated by Chinese manufacturers who have driven stack prices below USD 350/kW. Chinese firms such as LONGi Hydrogen and Sungrow shipped over 3 GW of alkaline stacks in 2024 alone, leveraging scale advantages that Western manufacturers are still building toward. PEM electrolysis is rapidly closing the cost gap while offering superior load-following capabilities — a critical advantage when paired with intermittent solar or wind without battery buffering. ITM Power and Siemens Energy are scaling PEM stack production lines targeting sub-USD 500/kW pricing by 2028.

Solid oxide electrolysis cells (SOEC) occupy a niche but high-value position, converting steam to hydrogen at electrical efficiencies exceeding 85% when waste heat from industrial processes is available. Bloom Energy and Sunfire are the leading SOEC developers, targeting steel-mill and refinery applications where waste-heat streams are abundant. AEM electrolysis is the earliest-stage technology in the portfolio but offers the tantalizing prospect of PEM-like performance without platinum-group-metal catalysts, potentially unlocking cost structures competitive with alkaline at scale.

By End-User Industry

Segment Key Metric Primary Demand Driver
Refining ~38% share (2025) Gray-to-green hydrogen substitution mandates
Chemicals ~90% CAGR (2026–2035) Green ammonia & methanol production commitments
Iron and Steel ~USD 28 Million (2025) Hydrogen-based DRI furnace deployments
Transportation ~94% CAGR (2026–2035) Heavy-duty trucking, maritime, and rail fuel cells
Other End Users ~6% share (2025) Power generation, data centers, blending


Refining currently absorbs the largest share of green hydrogen because petroleum processors already consume massive gray-hydrogen volumes for hydrocracking and desulfurization. Switching to electrolytic supply requires no process redesign — only a different feedstock source — making refineries the lowest-friction conversion opportunity in the Green Hydrogen Market. The chemicals segment is the fastest-growing vertical, propelled by binding commitments from fertilizer producers — including Yara, OCI, and IFFCO — to convert ammonia synthesis loops to green hydrogen feed, alongside e-methanol projects targeting the maritime-fuel and chemical-feedstock markets [10][9].


Regional Market Share Analysis

Region Key Metric Primary Investment Themes
Asia-Pacific ~45% share (2025) Government hydrogen roadmaps, electrolyzer manufacturing scale
Europe ~87% CAGR (2026–2035) CBAM, REPowerEU mandates, pipeline repurposing
North America USD 144 Million (2025) IRA 45V credits, Gulf Coast hub development
South America ~26 MTPA wind-resource capacity potential Export-oriented green ammonia projects
Middle East & Africa ~USD 46 Million (2025) Ultra-low-cost solar, export corridor development
Total USD 680 Million (2025)

The Green Hydrogen Market's regional landscape reflects the uneven global distribution of cheap renewable electricity, industrial hydrogen demand, and policy support. Five distinct regional dynamics are shaping trade flows, infrastructure investment, and competitive positioning through 2035.


North America

Country Key Metric Key Driver
US ~78% of regional share IRA Section 45V tax credit, DOE Hydrogen Hubs program
Canada ~USD 22 Million (2025) Alberta CCS-hydrogen integration, export terminals
Mexico 62% CAGR (2026–2035) Baja California solar-hydrogen corridor potential


The United States dominates North American activity through the Department of Energy's USD 7 billion Regional Clean Hydrogen Hubs program, which selected seven hub proposals in late 2023 spanning the Gulf Coast, Appalachian, Pacific Northwest, and Midwest corridors [2]. Canada is leveraging its existing natural-gas pipeline network and Alberta's geological storage assets to position itself as a blue-to-green transition economy, while Mexico's Sonoran Desert and Baja California coastline offer solar irradiance exceeding 2,400 kWh/m² — among the highest values in the Western Hemisphere.

Europe

Country Key Metric Key Driver
Germany ~31% of regional share H2Global auctions, industrial cluster demand
UK 92% CAGR (2026–2035) Hydrogen Allocation Round, offshore-wind pairing
France ~USD 8.2 Million (2025) Nuclear-electrolysis hybrid strategy
Italy ~12% of regional share Southern Italy solar-hydrogen, SNAM pipeline conversion
Spain 88% CAGR (2026–2035) Iberdrola, Cepsa green hydrogen investments
Nordic Countries ~USD 14 Million (2025) Green-steel DRI demand, offshore wind abundance
Russia <1% of regional share Limited policy support, sanctions constraints
Rest of Europe ~8% of regional share Netherlands, Portugal, Poland emerging projects


Europe's Green Hydrogen Market trajectory is underpinned by the revised Renewable Energy Directive (RED III), which sets a binding 42% renewable-hydrogen target for industrial hydrogen consumption by 2030 [8]. Germany's H2Global mechanism — a double-auction system that bridges the cost gap between production and consumption — has already awarded contracts covering 400,000 tonnes per year of hydrogen-equivalent imports. The UK's Hydrogen Allocation Round offers 15-year contracts-for-difference to electrolytic projects, while Spain's strategic location and solar resources position it as a low-cost production hub supplying Northern European demand via pipeline.

Asia-Pacific

Country Key Metric Key Driver
China ~52% of regional share Provincial hydrogen subsidies, domestic electrolyzer manufacturing
India 105% CAGR (2026–2035) National Green Hydrogen Mission, refinery mandate
Japan ~USD 18 Million (2025) GX Strategy, ammonia co-firing for power generation
South Korea ~8% of regional share Hydrogen Economy Roadmap, fuel-cell vehicle targets
ASEAN 95% CAGR (2026–2035) Early-stage pilot projects, industrial park deployments
Rest of Asia-Pacific ~4% of regional share Australia's export ambitions, emerging SE Asian demand


China's dominance within Asia-Pacific reflects both its massive electrolyzer manufacturing base — accounting for over 60% of global alkaline electrolyzer shipments in 2024 — and aggressive provincial subsidy programs in Inner Mongolia, Xinjiang, and Hebei [5]. India's National Green Hydrogen Mission targets 5 MTPA of production capacity by 2030, backed by USD 2.3 billion in government incentives and mandatory green hydrogen procurement quotas for fertilizer plants and petroleum refineries. Japan's GX (Green Transformation) strategy, valued at JPY 20 trillion, envisions ammonia co-firing and direct hydrogen use in steel and chemicals [20].

South America

Country Key Metric Key Driver
Brazil ~58% of regional share Offshore wind leasing, Pecém hydrogen hub
Argentina 78% CAGR (2026–2035) Patagonian wind resources, Fortescue project pipeline
Rest of South America ~USD 4 Million (2025) Chile, Colombia, Uruguay early-stage development


South America's proposition rests on world-class renewable resources — Patagonian winds average 45–55% capacity factors, and Chile's Atacama Desert delivers solar irradiance rivaling the Arabian Peninsula [4]. Brazil's Pecém green hydrogen hub in Ceará has attracted over USD 15 billion in announced investment commitments, targeting green ammonia export to European offtakers. Argentina's RIGI investment regime, enacted in 2024, provides fiscal incentives for large-scale hydrogen export projects, though infrastructure bottlenecks and foreign-exchange regulations remain investor concerns.

Middle East & Africa

Country Key Metric Key Driver
Saudi Arabia ~38% of regional share NEOM green hydrogen/ammonia megaproject
UAE 84% CAGR (2026–2035) Masdar-led electrolyzer deployments, export strategy
South Africa ~USD 3.5 Million (2025) Boegoebaai green hydrogen corridor
Egypt 90% CAGR (2026–2035) Suez Canal Economic Zone projects, EU proximity
Rest of MEA ~12% of regional share Namibia, Morocco, Oman emerging corridors


Saudi Arabia's NEOM Green Hydrogen Company — a joint venture between ACWA Power, Air Products, and NEOM — targets 600 tonnes of hydrogen per day by 2026 for conversion to green ammonia and export to global markets [18]. The UAE's Masdar has announced multiple electrolyzer projects targeting a combined capacity exceeding 1 GW. In Africa, Namibia's Hyphen Hydrogen Energy project and South Africa's Boegoebaai Special Economic Zone represent continent-scale ambitions, although permitting timelines, port capacity, and water availability remain critical path variables for the Green Hydrogen Market in this region.


Green Hydrogen Market By Region, 2025-2035

Competitive Benchmarking

The Green Hydrogen Market exhibits moderate concentration, with the top five electrolyzer manufacturers accounting for an estimated 40–48% of global shipments by capacity in 2025. The Herfindahl-Hirschman Index sits in the 800–1,100 range, reflecting a mix of established industrial-gas incumbents and specialized electrolyzer pure-plays. Chinese manufacturers are exerting increasing pricing pressure on Western competitors, particularly in the alkaline segment, where production-cost advantages of 30–40% have begun to reshape procurement decisions in price-sensitive markets.

Company Est. Revenue Share Range Key Offerings Strategic Positioning
Nel ASA ~7–10% Alkaline & PEM stacks, hydrogen fueling stations Vertically integrated, Norwegian R&D heritage
ITM Power ~5–8% PEM electrolyzers, Gigafactory 2 (Sheffield) UK-based, grid-balancing partnerships
Plug Power ~6–9% PEM stacks, liquid hydrogen logistics, GenKey solutions End-to-end ecosystem, North American footprint
Siemens Energy ~8–11% Silyzer PEM series, digital optimization platform Industrial conglomerate integration, global scale
thyssenkrupp nucera ~9–12% Large-scale alkaline water electrolysis GW-scale project references, engineering heritage
Bloom Energy ~3–5% Solid oxide electrolyzer, reversible fuel cells SOEC technology leader, industrial waste-heat focus
Cummins (Accelera) ~5–7% PEM electrolyzers, hydrogen powertrain integration Cross-sector mobility integration, global service
Air Liquide ~6–9% On-site electrolysis, hydrogen supply contracts Industrial gas incumbent, global infrastructure
Linde plc ~5–8% ITM-Linde joint venture, green hydrogen supply Engineering & logistics, large-project execution
LONGi Hydrogen ~8–11% Alkaline electrolyzers, GW-scale manufacturing Chinese cost leadership, rapid capacity expansion


Recent News & Developments

  • U.S. Department of Energy (December 2023): Finalized selection of seven Regional Clean Hydrogen Hubs under the USD 7 billion IIJA allocation, with projects spanning California, Texas, Appalachia, the Upper Midwest, Pacific Northwest, Mid-Atlantic, and the Gulf Coast [2].


Green Hydrogen Market Report Scope

Parameter Detail
Market Scope Global Green Hydrogen Market by technology, end-user industry, and geography
Study Period 2021–2035
Historical Period 2021–2024
Base Year 2025
Forecast Period 2026–2035
CAGR (2026–2035) 80.8%
Market Size (2025) USD 680 Million
Market Size (2035) USD 260,170 Million
Fastest Growing Segment (Technology) PEM Electrolysis
Fastest Growing Segment (End User) Chemicals
Fastest Growing Region Europe
Companies Profiled Nel ASA, ITM Power, Plug Power, Siemens Energy, thyssenkrupp nucera, Bloom Energy, Cummins/Accelera, Air Liquide, Linde plc, LONGi Hydrogen
Valuation Currency USD Million


FAQs

What contract structure minimizes procurement risk when buying green hydrogen?

Fixed-price, take-or-pay agreements with index-linked floor-and-ceiling bands offer the best risk balance. These contracts lock in volume certainty for the producer while capping the buyer's cost exposure over 10–15 year terms.

How does electrolyzer degradation affect long-term project economics?

Alkaline stacks typically lose 1–2% efficiency annually and require refurbishment every 80,000–100,000  
Author
Author
Author Profile
Chitranshi Jaiswal LinkedIn
Team Lead - Research
Chitranshi is a Team Leader in the Chemicals & Materials (CnM) and Energy & Power (EnP) domains, with 6+ years of experience in market research. She leads and mentors teams to deliver cross-domain projects that equip clients with actionable insights and growth strategies. She is skilled in market estimation, forecasting, competitive benchmarking, and both primary & secondary research, enabling her to turn complex data into decision-ready insights. An engineer and MBA professional, she combines technical expertise with strategic acumen to solve dynamic market challenges. Chitranshi has successfully managed projects that support market entry, investment planning, and competitive positioning, while building strong client relationships. Certified in Advanced Excel & Power BI she leverages data-driven approaches to ensure accuracy, clarity, and impactful outcomes.

Research Approach

Research Methodology on Green Hydrogen Market

Abstract

Green hydrogen (GH) is gaining popularity due to its potential to reduce the world's carbon dioxide emissions. Green Hydrogen is produced by electrolyzing water in the presence of renewable energy sources such as solar and wind. This research report presents a comprehensive research methodology to analyze the trends and factors driving the market for green hydrogen. The research methodology includes an extensive literature review, a market forecast model, and a real-time survey of key stakeholders. Through these methods, a detailed understanding of the Green Hydrogen market and its various aspects are derived to update the business plans of various industry stakeholders in the green hydrogen value chain.

Introduction

The use of green hydrogen (GH) is gaining traction globally to reduce carbon dioxide emissions in various industries. GH, which is derived from water electrolysis in the presence of renewable energy sources such as solar and wind, is viewed as a viable solution to meet the world’s energy needs. The market for Green Hydrogen has grown significantly in recent years and hence, a comprehensive research methodology is needed to understand the trends, drivers, and factors impacting the Green Hydrogen market.

Literature Review

A comprehensive literature review is an essential step for understanding the dynamics of the GH market. For this research, an extensive search of published and unpublished materials, such as journal articles, conference papers, reports from research and industry associations, government databases and reports, and online sources are conducted. The literature review collected pertinent information regarding GH technologies, trends, and drivers, as well as GH production cost and economic impact. This provides a fundamental understanding of GH technology, economics, and usage, which are essential to accurately assess the GH market.

Market Forecast Model

To further deepen our understanding of the GH market, a Market Forecast Model is subsequently developed. This model combines existing industry information and market estimates with newly collected and emerging information to construct forecasts and assessments of the GH market. By taking into account various factors such as GH production costs, economic incentives, and regulatory policies, this model projects consumer demand, industry trends, and production capabilities ahead of time.

Key Stakeholder Survey

In addition to the literature review and market forecast model, a real-time survey of key stakeholders in the GH market was conducted. The survey was designed to better understand consumer needs, competitive dynamics, and potential obstacles to the widespread adoption of GH technology. The survey collected feedback from GH producers, government policymakers, industry associations, and other stakeholders in different areas of the green hydrogen value chain.

Conclusion

This paper presents a research methodology for a comprehensive analysis of the green hydrogen market. Through an extensive literature review, a market forecast model, and a real-time survey of key stakeholders, the research methodology provides a detailed understanding of the GH market and its various aspects. This information is essential to update the business plans of various industry stakeholders in the green hydrogen value chain.

Download Free Sample

Kindly complete the form below to receive a free sample of this Report

Download PDF ×

We do not share your information with anyone. However, we may send you emails based on your report interest from time to time. You may contact us at any time to opt-out.