• Cat-intel
  • MedIntelliX
  • Resources
  • About Us
  • Hero Background
    English
    Chinese
    French
    Japanese
    Korean
    German
    Spanish

    Glass Packaging Market Analysis

    ID: MRFR/PNT/0750-CR
    185 Pages
    Snehal Singh
    August 2018

    Glass Packaging Market Research Report Information By Product (Standard Glass Quality, Premium Glass Quality, and Super Premium Glass Quality), By Application (Beverage Packaging, Food Packaging, Personal Care Packaging, Pharmaceuticals Packaging, and Others) And By Region (North America, Europe, Asia-Pacific, And Rest Of The World) –Market Forecast Till 2035

    Share:
    Download PDF ×

    We do not share your information with anyone. However, we may send you emails based on your report interest from time to time. You may contact us at any time to opt-out.

    Glass Packaging Market Infographic
    $ 4,950.0
    $ 5,950.0
    $ 7,250.0

    Market Analysis

    Glass Packaging market (Global, 2024)

    Introduction

    Glass bottles are undergoing great changes, owing to the changes in consumers’ habits, in the demand for the environment and the technological progress. In the sphere of the environment, the glass bottle is becoming more and more popular because of its recyclability and the quality of the products. The glass bottle market is very varied, because of the many different applications: food and beverages, pharmaceuticals, cosmetics, etc. Each of these applications requires a special glass bottle, combining the right appearance with the right functionality. In the field of design and manufacturing, glass is proving to be very versatile, and is a good choice for brands which want to be different from the competition. In addition, the development of e-commerce and the changes in retailing are having an effect on the glass bottle industry, which is obliged to change and to innovate to meet the requirements of the companies and the consumers. And the players in the industry have to be able to cope with the fluctuations in costs and the disruptions to the supply chains, and at the same time to take advantage of the growing interest in the environment.

    PESTLE Analysis

    Political
    In 2024, the glass packaging market is influenced by a number of political factors, such as government regulations aimed at reducing the amount of plastic waste. For example, the European Union has set a goal of reusing and reusing at least 90 per cent of glass packaging by 2030, as part of its circular economy plan. This regulatory framework is expected to stimulate demand for glass packaging as companies strive to comply with these stringent targets. Also, some countries have introduced a tax on disposable plastics, with some regions charging up to 10 cents per item. This also has an incentive effect on the glass packaging market.
    Economic
    The economic environment of the glass-packaging market in 2024 is characterized by rising raw-material prices and inflationary pressures. The price of silica sand, the principal raw material for glass production, has risen by about 15 percent over the past year to $60 per ton. This rise in production costs has led to the search for more efficient production methods and alternative materials. In addition, the world’s post-pandemic economic recovery has led to a recovery in consumer spending, with a projected retail turnover of $5.13 billion in 2024. This turnover is expected to lead to an increase in demand for glass containers.
    Social
    In 2024 social trends showed a growing preference for packaging that was sustainable. A survey taken in the first months of the year showed that 78% of consumers were willing to pay a higher price for products packed in earth-friendly materials, such as glass. This was a change in the buying habits of consumers. Brands rushed to adopt glass packaging to enhance their marketability and show their commitment to the environment. In addition, the growing health consciousness among consumers meant that the beverage industry also demanded glass packaging for juices and health drinks, which were considered more natural in glass.
    Technological
    Towards 2024, technological advancements will play a crucial role in the glass packaging market. The automation of production lines has led to a reduction in energy consumption of up to 20%. The development of lightweight glass packaging is also gaining traction, with new formulations reducing the weight of the glass by approximately 10% without compromising on its strength. These technological improvements not only improve the production efficiency but also reduce the transportation costs and the carbon footprint.
    Legal
    The glass package market in 2024 will be influenced by regulations on the safety of products and the environment. The Food and Drug Administration (FDA) has established new regulations for food contact materials, requiring that all glass packaging used for food must meet certain safety standards. These standards are obligatory, and non-compliance with them can result in a fine of up to $250,000 per infringement. In addition, stricter labeling regulations are being introduced in various countries, which will have a significant impact on the glass package market.
    Environmental
    In 2024, the glass packaging market will be dominated by a growing concern for the environment, with a strong emphasis on sustainability. The glass recovery rate in Europe is already 76% and initiatives are being taken to raise it to 90% by 2030. This high recovery rate reflects the industry’s commitment to reducing waste and promoting the principles of the circular economy. The carbon footprint of glass production is also being addressed. Glassworks are investing in the production of green energy, which in 2024 will account for approximately 30% of the energy used in glassmaking, thereby reducing greenhouse gas emissions.

    Porter's Five Forces

    Threat of New Entrants
    The glass packaging industry has a moderate degree of protection against competition because of the high cost of building factories and acquiring machinery. In addition, the distribution network and brand loyalty of established brands make it difficult for newcomers to enter the market. However, the growing demand for sustainable packaging solutions may attract new players to the industry.
    Bargaining Power of Suppliers
    The relative strength of the suppliers in the glass container industry is low, as there are numerous suppliers of raw materials such as sand, limestone and soda ash. This abundance of suppliers allows the glassworks to change suppliers at will, which reduces the power of the suppliers. Suppliers of specialised materials or technical know-how can be more powerful.
    Bargaining Power of Buyers
    The buyers in the glass container market, especially the large retailers and beverage companies, have considerable negotiating power, due to their size and the quantity of their purchases. They can bargain over prices and demand higher quality and bespoke products, which puts pressure on manufacturers to meet these demands and to maintain their profits.
    Threat of Substitutes
    The threat of substitutes for glass containers is moderate, as plastic and metal containers are widely available and often cheaper. However, the growing demand for sustainable and recyclable packaging gives glass an advantage, although price-sensitive consumers could still opt for substitutes.
    Competitive Rivalry
    The market for glass containers is highly competitive, with several established players competing for market share. The companies are constantly trying to improve and diversify their products to stand out from the crowd. In addition, the market is characterised by price competition, which further intensifies the rivalry between the established companies.

    SWOT Analysis

    Strengths

    • Sustainability and recyclability of glass packaging appeal to environmentally conscious consumers.
    • Glass packaging offers superior protection for products, maintaining quality and freshness.
    • Strong brand perception and premium image associated with glass packaging enhance product value.

    Weaknesses

    • Higher production and transportation costs compared to alternative packaging materials.
    • Fragility of glass can lead to increased breakage during handling and shipping.
    • Limited flexibility in design compared to plastic packaging options.

    Opportunities

    • Growing demand for sustainable packaging solutions presents new market opportunities.
    • Expansion into emerging markets where glass packaging is gaining popularity.
    • Innovation in glass manufacturing processes to reduce costs and improve efficiency.

    Threats

    • Intense competition from alternative packaging materials, particularly plastics and metals.
    • Economic fluctuations affecting consumer spending on premium packaging.
    • Regulatory changes regarding packaging materials and recycling requirements.

    Summary

    In 2024, the glass packaging market will be characterized by its strengths in terms of sustainability and product protection, which will resonate with consumers. But the higher cost and fragility will remain weaknesses. Opportunities to grow will be driven by the increasing demand for eco-friendly solutions and market expansion. Threats to growth will come from the competition from alternative materials and from economic factors. In order to exploit the strengths and mitigate the risks, strategic focus on innovation and cost reduction will be necessary.

    Market Summary

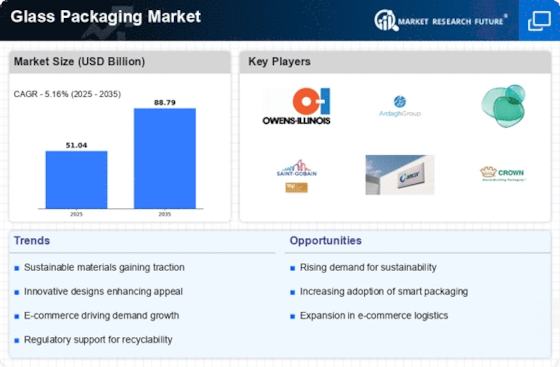
    As per MRFR analysis, the Glass Packaging Market Size was estimated at 51.04 USD Billion in 2024. The Glass Packaging industry is projected to grow from 53.67 USD Billion in 2025 to 88.79 USD Billion by 2035, exhibiting a compound annual growth rate (CAGR) of 5.16 during the forecast period 2025 - 2035.

    Key Market Trends & Highlights

    The Glass Packaging Market is experiencing a robust shift towards sustainability and innovation, driven by evolving consumer preferences and regulatory support.

    • The market is increasingly prioritizing sustainability, with manufacturers adopting eco-friendly practices and materials.
    • Technological innovations are enhancing the production processes, leading to improved efficiency and product quality.
    • Aesthetic appeal remains a crucial factor, as consumers gravitate towards visually appealing packaging designs.
    • Sustainability initiatives and health and safety standards are major drivers, particularly in the North American beverage packaging segment and the rapidly growing pharmaceutical packaging sector in Asia-Pacific.

    Market Size & Forecast

    2024 Market Size 51.04 (USD Billion)
    2035 Market Size 88.79 (USD Billion)
    CAGR (2025 - 2035) 5.16%
    Largest Regional Market Share in 2024 North America

    Major Players

    <p>Owens-Illinois (US), Ardagh Group (IE), Verallia (FR), Saint-Gobain (FR), Amcor (AU), Crown Holdings (US), Schott AG (DE), Nippon Glass (JP), Vitro (MX)</p>

    Market Trends

    The Glass Packaging Market is currently experiencing a notable transformation driven by evolving consumer preferences and increasing environmental awareness. As sustainability becomes a focal point for both manufacturers and consumers, glass packaging is gaining traction due to its recyclability and minimal environmental impact. This shift is further supported by stringent regulations aimed at reducing plastic waste, prompting companies to explore glass as a viable alternative. Additionally, the aesthetic appeal and premium perception of glass packaging are influencing brand strategies, particularly in sectors such as food and beverages, cosmetics, and pharmaceuticals. Moreover, technological advancements in glass production and design are enhancing the functionality and versatility of glass packaging. Innovations such as lightweight glass and enhanced durability are making it more attractive for various applications. The Glass Packaging Market appears poised for growth as stakeholders adapt to these trends, focusing on sustainable practices and innovative solutions. As consumer demand for eco-friendly products continues to rise, the market is likely to expand, presenting opportunities for both established players and new entrants.

    Sustainability Focus

    The emphasis on sustainability is reshaping the Glass Packaging Market. Consumers increasingly prefer eco-friendly options, leading to a surge in demand for recyclable materials. This trend is prompting manufacturers to adopt greener practices and invest in sustainable production methods.

    Technological Innovations

    Advancements in technology are enhancing the capabilities of glass packaging. Innovations such as lightweight designs and improved durability are making glass more appealing for various applications. These developments are likely to attract new market entrants and expand existing product lines.

    Aesthetic Appeal

    The aesthetic qualities of glass packaging are becoming a key differentiator in the market. Brands are leveraging the premium look and feel of glass to enhance product visibility and consumer engagement. This trend is particularly evident in the food and beverage sector, where presentation plays a crucial role.

    The ongoing shift towards sustainable packaging solutions appears to be driving a resurgence in the glass packaging market, as consumers increasingly favor recyclable materials over single-use plastics.

    U.S. Environmental Protection Agency

    Glass Packaging Market Market Drivers

    Regulatory Support

    Regulatory support for sustainable packaging solutions is emerging as a vital driver for the Glass Packaging Market. Governments worldwide are implementing policies aimed at reducing plastic waste and promoting recyclable materials. These regulations often favor glass packaging due to its recyclability and lower environmental impact. For example, several countries have introduced incentives for companies that adopt sustainable packaging practices, which could lead to increased investments in glass packaging solutions. The anticipated growth in regulations supporting eco-friendly packaging is expected to create a favorable environment for the glass packaging sector. As businesses adapt to these regulations, the demand for glass packaging is likely to rise, further solidifying its position in the market.

    Consumer Preferences

    Shifting consumer preferences are a crucial driver for the Glass Packaging Market. There is a noticeable trend towards premiumization, where consumers are willing to pay more for products that offer superior quality and aesthetics. Glass packaging is often associated with higher quality, leading to increased demand in sectors such as cosmetics, beverages, and gourmet foods. Market data indicates that products packaged in glass are perceived as more luxurious, which can significantly influence purchasing decisions. Additionally, the rise of e-commerce has prompted brands to consider packaging that not only protects the product but also enhances the unboxing experience. This evolving consumer behavior suggests that companies focusing on glass packaging may find themselves at a competitive advantage.

    Sustainability Initiatives

    The increasing emphasis on sustainability appears to be a pivotal driver for the Glass Packaging Market. As consumers become more environmentally conscious, the demand for recyclable and eco-friendly packaging solutions rises. Glass packaging, being 100 percent recyclable without loss of quality, aligns well with these sustainability initiatives. In fact, recent data indicates that the glass recycling rate in certain regions has reached approximately 70 percent, showcasing its potential in reducing waste. Companies are increasingly adopting glass packaging to enhance their brand image and meet regulatory requirements aimed at reducing plastic usage. This shift not only caters to consumer preferences but also positions businesses favorably in a market that is progressively leaning towards sustainable practices.

    Technological Advancements

    Technological advancements in manufacturing processes are likely to propel the Glass Packaging Market forward. Innovations such as lightweight glass and improved production techniques have made glass packaging more cost-effective and efficient. For instance, the introduction of automated production lines has reduced manufacturing costs and increased output, making glass packaging more accessible to a wider range of businesses. Furthermore, advancements in design technology allow for more intricate and appealing packaging solutions, which can enhance product visibility on shelves. The market is witnessing a shift towards smart packaging solutions, integrating technology to provide consumers with additional information about the product. This evolution in technology not only improves the functionality of glass packaging but also attracts a tech-savvy consumer base.

    Health and Safety Standards

    Health and safety regulations are becoming increasingly stringent, which significantly influences the Glass Packaging Market. Glass is perceived as a safer alternative to plastic, particularly in food and beverage sectors, due to its inert nature and lack of chemical leaching. Recent studies suggest that consumers are more likely to choose glass packaging for products that require high safety standards, such as pharmaceuticals and food items. The market for glass packaging in the food and beverage sector is projected to grow at a compound annual growth rate of around 4 percent over the next few years. This trend indicates a robust demand for glass packaging solutions that comply with health regulations, thereby enhancing consumer trust and brand loyalty.

    Market Segment Insights

    By Product: Standard Glass Quality (Largest) vs. Super Premium Glass Quality (Fastest-Growing)

    <p>In the Glass Packaging Market, Standard Glass Quality holds a significant share, appealing predominantly to mass-market brands. This segment is widely adopted due to its affordability and versatile applications, particularly in food and beverage packaging. Meanwhile, Premium and Super Premium Glass Quality products are gaining traction, targeting consumers who prioritize higher durability and aesthetic appeal. These segments are smaller in market share but are expanding rapidly, driven by changing consumer preferences toward sustainable and premium products. Growth trends in the Glass Packaging Market are influenced by several factors. The rising demand for environmentally friendly packaging solutions has led to an increased interest in glass as a preferred material. Additionally, the premiumization trend is evident, with consumers showing willingness to pay more for high-quality packaging that enhances product visibility and perceived value. This shift is particularly pronounced in sectors such as cosmetics and luxury beverages, where packaging quality plays a critical role in consumer choice.</p>

    <p>Glass Quality: Standard (Dominant) vs. Super Premium (Emerging)</p>

    <p>Standard Glass Quality is characterized by its widespread use in everyday packaging applications, delivering reliable quality at economical pricing. Favored by numerous brands, it stands as the dominant force in the Glass Packaging Market. On the other hand, Super Premium Glass Quality caters to niche segments, offering enhanced strength and visual appeal that attracts discerning consumers. As the fastest-growing segment, it reflects a shift towards more luxurious consumer experiences. This segment is leveraged by brands aiming to differentiate their products through exclusive packaging. While Standard Glass continues to serve as the backbone of the market, Super Premium Glass is carving out a significant space among consumers willing to invest in quality.</p>

    By Application: Beverage Packaging (Largest) vs. Pharmaceutical Packaging (Fastest-Growing)

    <p>In the Glass Packaging Market, Beverage Packaging emerges as the largest segment, holding a significant share compared to other applications such as Food Packaging, Personal Care Packaging, and Pharmaceutical Packaging. Beverage Packaging dominates the market due to the high consumption and demand for drinks in glass containers, which are preferred for their ability to preserve taste and quality. Food Packaging also holds a noteworthy portion, as glass jars and bottles remain popular for various food products, but it trails behind Beverage Packaging significantly. Pharmaceutical Packaging is recognized as the fastest-growing segment within the Glass Packaging Market. This growth is driven by the increased focus on safety and regulations concerning the packaging of medicines. As consumers and healthcare providers increasingly prefer glass for its protective qualities and recyclability, Pharmaceutical Packaging is expanding rapidly, potentially changing the market dynamics. Emerging trends also indicate a rise in the use of eco-friendly and sustainable packaging solutions, further bolstering growth in this segment.</p>

    <p>Beverage Packaging (Dominant) vs. Food Packaging (Emerging)</p>

    <p>Beverage Packaging is the dominant application in the Glass Packaging Market, characterized by its extensive usage in soft drinks, alcoholic beverages, and bottled water. The inherent qualities of glass, such as impermeability and ability to maintain product integrity, make it an ideal choice for beverage manufacturers. This segment benefits from a strong consumer preference for glass over plastic, which is often perceived as less environmentally friendly. On the other hand, Food Packaging serves as an emerging market, with glass becoming increasingly popular for packaging sauces, jams, and other food products. The shift towards organic and natural foods is positively influencing this segment, as consumers seek packaging that does not alter the taste or quality of the food. Together, these segments represent the evolving dynamics within the glass packaging landscape.</p>

    Get more detailed insights about Glass Packaging Market Research Report - Forecast to 2032

    Regional Insights

    North America : Sustainable Packaging Leader

    North America is witnessing a robust growth in the glass packaging market, driven by increasing consumer preference for sustainable and recyclable materials. The region holds approximately 35% of the global market share, making it the largest market for glass packaging. Regulatory support for eco-friendly packaging solutions further fuels this growth, as companies adapt to stringent environmental regulations and consumer demands for sustainability. The United States and Canada are the leading countries in this region, with major players like Owens-Illinois and Crown Holdings dominating the market. The competitive landscape is characterized by innovation in design and production processes, as companies strive to meet the rising demand for glass packaging in sectors such as food and beverage, pharmaceuticals, and cosmetics. The presence of established manufacturers and a growing trend towards sustainable packaging solutions are key factors driving market growth.

    Europe : Innovation and Sustainability Hub

    Europe is emerging as a significant player in the glass packaging market, driven by stringent regulations on plastic usage and a strong consumer shift towards sustainable packaging. The region accounts for approximately 30% of the global market share, making it the second-largest market. Regulatory frameworks, such as the EU's Circular Economy Action Plan, are pivotal in promoting the use of recyclable materials and reducing waste, thereby enhancing market growth. Leading countries in Europe include Germany, France, and Italy, with key players like Ardagh Group and Verallia at the forefront. The competitive landscape is marked by innovation in glass production techniques and a focus on reducing carbon footprints. Companies are increasingly investing in research and development to create lightweight and eco-friendly glass packaging solutions, catering to the growing demand from various sectors, including food and beverage, cosmetics, and pharmaceuticals.

    Asia-Pacific : Emerging Market Potential

    The Asia-Pacific region is rapidly becoming a powerhouse in the glass packaging market, driven by urbanization, rising disposable incomes, and changing consumer preferences. This region holds approximately 25% of the global market share, making it a significant player. The demand for glass packaging is further supported by government initiatives aimed at promoting sustainable practices and reducing plastic waste, which are crucial for market expansion in countries like China and India. China and Japan are the leading countries in this region, with major players such as Nippon Glass and Amcor leading the charge. The competitive landscape is characterized by a mix of local and international companies, all vying for market share. The focus on innovation and sustainability is evident, as manufacturers invest in advanced technologies to enhance production efficiency and meet the growing demand for glass packaging across various sectors, including food and beverage, pharmaceuticals, and personal care products.

    Middle East and Africa : Resource-Rich Market Dynamics

    The Middle East and Africa region is witnessing a gradual increase in the glass packaging market, driven by rising consumer awareness regarding sustainability and the benefits of glass over plastic. This region holds approximately 10% of the global market share. The growth is supported by government initiatives aimed at promoting recycling and sustainable packaging solutions, particularly in countries like South Africa and the UAE, where regulations are becoming more stringent. South Africa and the UAE are the leading countries in this region, with key players like Vitro and Schott AG making significant contributions to market growth. The competitive landscape is evolving, with local manufacturers increasingly focusing on innovation and sustainability to meet the demands of various sectors, including food and beverage, cosmetics, and pharmaceuticals. The presence of abundant natural resources also supports the growth of the glass packaging industry in this region.

    Key Players and Competitive Insights

    The Glass Packaging Market is currently characterized by a dynamic competitive landscape, driven by increasing consumer demand for sustainable packaging solutions and the growing emphasis on environmental responsibility. Major players such as Owens-Illinois (US), Ardagh Group (IE), and Verallia (FR) are strategically positioning themselves through innovation and regional expansion. Owens-Illinois (US) focuses on enhancing its product portfolio with eco-friendly glass solutions, while Ardagh Group (IE) emphasizes its commitment to sustainability through investments in advanced manufacturing technologies. Verallia (FR) is also actively pursuing partnerships to bolster its market presence, collectively shaping a competitive environment that prioritizes sustainability and innovation.

    In terms of business tactics, companies are increasingly localizing manufacturing to reduce transportation costs and enhance supply chain efficiency. The Glass Packaging Market appears moderately fragmented, with key players exerting considerable influence over market dynamics. This structure allows for a diverse range of products and services, fostering competition that drives innovation and responsiveness to consumer preferences.

    In August 2025, Ardagh Group (IE) announced a significant investment in a new glass manufacturing facility in Poland, aimed at increasing production capacity and meeting the rising demand for sustainable packaging. This strategic move not only enhances Ardagh's operational capabilities but also aligns with the company's sustainability goals by reducing carbon emissions associated with transportation. The establishment of this facility is likely to strengthen Ardagh's competitive position in the European market.

    In September 2025, Owens-Illinois (US) launched a new line of lightweight glass bottles designed to reduce material usage while maintaining product integrity. This innovation reflects the company's commitment to sustainability and cost efficiency, potentially attracting environmentally conscious consumers. By focusing on lightweight designs, Owens-Illinois may enhance its market share in the beverage sector, where sustainability is increasingly becoming a purchasing criterion.

    In October 2025, Verallia (FR) entered into a strategic partnership with a leading beverage manufacturer to develop customized glass packaging solutions. This collaboration is expected to leverage Verallia's expertise in glass production and the beverage manufacturer's Market Research Future, resulting in innovative packaging that meets specific consumer needs. Such partnerships are indicative of a broader trend towards collaboration in the industry, as companies seek to differentiate themselves through tailored solutions.

    As of October 2025, the Glass Packaging Market is witnessing trends such as digitalization, sustainability, and the integration of artificial intelligence in production processes. Strategic alliances are increasingly shaping the competitive landscape, enabling companies to pool resources and expertise. The shift from price-based competition to a focus on innovation, technology, and supply chain reliability is becoming evident, suggesting that future competitive differentiation will hinge on the ability to adapt to evolving consumer preferences and environmental standards.

    Key Companies in the Glass Packaging Market market include

    Industry Developments

    • Q2 2024: O-I Glass Announces Opening of New Glass Packaging Plant in Brazil O-I Glass inaugurated a new glass packaging manufacturing facility in Rio de Janeiro, Brazil, expanding its production capacity to meet growing demand in the South American beverage sector.
    • Q2 2024: Ardagh Glass Packaging Expands Production with New Furnace at Doncaster Facility Ardagh Glass Packaging announced the commissioning of a new furnace at its Doncaster, UK plant, increasing output to support the beverage and food industries’ demand for sustainable glass containers.
    • Q2 2024: Verallia Completes Acquisition of Vidrala’s Italian Glass Packaging Operations Verallia finalized the acquisition of Vidrala’s glass packaging business in Italy, strengthening its position in the European glass container market.
    • Q3 2024: Owens-Illinois Names New Chief Executive Officer Owens-Illinois, Inc. appointed a new CEO, marking a leadership transition aimed at driving innovation and growth in the global glass packaging sector.
    • Q3 2024: Ardagh Group Secures Long-Term Supply Contract with Major European Brewer Ardagh Group signed a multi-year supply agreement to provide glass bottles to a leading European brewing company, reinforcing its role as a key packaging partner in the beverage industry.
    • Q3 2024: Verallia Launches Lightweight Glass Bottle Range for Wine Sector Verallia introduced a new line of lightweight glass bottles designed for the wine industry, aiming to reduce carbon emissions and enhance sustainability.
    • Q4 2024: O-I Glass Announces $100 Million Investment in U.S. Plant Modernization O-I Glass committed $100 million to upgrade its U.S. manufacturing facilities, focusing on energy efficiency and advanced glass production technologies.
    • Q4 2024: Ardagh Group to Acquire Minority Stake in Indian Glass Packaging Firm Ardagh Group agreed to purchase a minority equity stake in a leading Indian glass packaging manufacturer, expanding its footprint in the fast-growing Asia-Pacific market.
    • Q1 2025: Verallia Signs Strategic Partnership with Global Cosmetics Brand for Sustainable Packaging Verallia entered a strategic partnership with a major international cosmetics company to develop and supply eco-friendly glass packaging solutions.
    • Q1 2025: O-I Glass Launches Recycled Glass Initiative in North America O-I Glass launched a new initiative to increase the use of recycled glass (cullet) in its North American production, supporting circular economy goals.
    • Q2 2025: Ardagh Group Raises €250 Million in Green Bond Offering to Fund Sustainable Packaging Projects Ardagh Group completed a €250 million green bond issuance, with proceeds earmarked for investments in sustainable glass packaging technologies and energy-efficient manufacturing.
    • Q2 2025: Verallia Opens New Glass Packaging Plant in Poland Verallia inaugurated a new state-of-the-art glass packaging facility in Poland, expanding its production capacity to serve Central and Eastern European markets.

    Future Outlook

    Glass Packaging Market Future Outlook

    <p>The Glass Packaging Market is projected to grow at a 5.16% CAGR from 2024 to 2035, driven by sustainability trends, increased demand in food and beverage sectors, and technological advancements.</p>

    New opportunities lie in:

    • <p>Expansion into biodegradable glass alternatives for eco-conscious consumers.</p>
    • <p>Development of smart glass packaging with integrated sensors for quality monitoring.</p>
    • <p>Investment in automated production lines to enhance efficiency and reduce costs.</p>

    <p>By 2035, the Glass Packaging Market is expected to solidify its position as a leader in sustainable packaging solutions.</p>

    Market Segmentation

    Glass Packaging Market Product Outlook

    • Standard Glass Quality
    • Premium Glass Quality
    • Super Premium Glass Quality

    Glass Packaging Market Application Outlook

    • Beverage Packaging
    • Food Packaging
    • Personal Care Packaging
    • Pharmaceutical Packaging
    • Others

    Report Scope

    MARKET SIZE 202451.04(USD Billion)
    MARKET SIZE 202553.67(USD Billion)
    MARKET SIZE 203588.79(USD Billion)
    COMPOUND ANNUAL GROWTH RATE (CAGR)5.16% (2024 - 2035)
    REPORT COVERAGERevenue Forecast, Competitive Landscape, Growth Factors, and Trends
    BASE YEAR2024
    Market Forecast Period2025 - 2035
    Historical Data2019 - 2024
    Market Forecast UnitsUSD Billion
    Key Companies ProfiledMarket analysis in progress
    Segments CoveredMarket segmentation analysis in progress
    Key Market OpportunitiesGrowing demand for sustainable packaging solutions drives innovation in the Glass Packaging Market.
    Key Market DynamicsRising consumer preference for sustainable packaging drives innovation and competition in the glass packaging sector.
    Countries CoveredNorth America, Europe, APAC, South America, MEA

    Market Highlights

    Author

    Snehal Singh
    Assistant Manager - Research

    She holds an experience of about 6+ years in market research and business consulting, working under the spectrum of information communication technology, telecommunications and semiconductor domains. aarti conceptualizes and implements a scalable business strategy and provides strategic leadership to the clients. her expertise lies in market estimation, competitive intelligence, pipeline analysis, customer assessment, etc.

    Leave a Comment

    Latest Comments

    John Doe
    john@example.com

    This is a great article! Really helped me understand the topic better.

    Posted on July 23, 2025, 10:15 AM
    Jane Smith
    jane@domain.com

    Thanks for sharing this. I’ve bookmarked it for later reference.

    Posted on July 22, 2025, 7:45 PM

    FAQs

    What is the current valuation of the Glass Packaging Market as of 2024?

    The Glass Packaging Market was valued at 51.04 USD Billion in 2024.

    What is the projected market valuation for the Glass Packaging Market in 2035?

    The market is projected to reach 88.79 USD Billion by 2035.

    What is the expected CAGR for the Glass Packaging Market during the forecast period 2025 - 2035?

    The expected CAGR for the Glass Packaging Market during 2025 - 2035 is 5.16%.

    Which segments are included in the Glass Packaging Market?

    The market includes segments such as Standard Glass Quality, Premium Glass Quality, and Super Premium Glass Quality.

    What are the projected valuations for the Standard Glass Quality segment by 2035?

    The Standard Glass Quality segment is projected to grow from 20.0 USD Billion to 34.0 USD Billion by 2035.

    How does the Beverage Packaging segment perform in the Glass Packaging Market?

    The Beverage Packaging segment is expected to grow from 20.0 USD Billion to 34.0 USD Billion by 2035.

    1. Executive Summary
    2. Market Introduction
      1. Definition 20
      2. Scope of the Study 20
      3. Market Structure 20
      4. List of Assumptions
      5. 21
    3. Research Methodology
      1. Research Process 23
      2. Primary
      3. Research 23
      4. Secondary Research 24
      5. Market Size Estimation 25
      6. Forecast Model 25
    4. Market Dynamics
      1. Introduction 27
      2. Drivers 27
        1. Increased consumption of beverages 27
        2. Growth
        3. Several environmental benefits 29
        4. Drivers Impact Analysis 29
      3. in the pharmaceutical industry 28
      4. Restraints 29
        1. Availability
        2. Restraints Impact Analysis 30
      5. of other alternatives 29
      6. Opportunity
        1. Scope in developing nations 30
      7. 30
    5. Market Factor Analysis
      1. Porter’s Five Forces Analysis 32
        1. Threat of New Entrants 32
        2. Bargaining Power of Suppliers 32
        3. Threat of Substitutes 32
        4. Bargaining Power of Buyers 33
        5. Segment Rivalry 33
      2. Supply
      3. Chain Analysis 33
      4. Import Analysis of Glass Products (Carboys, Bottles,
      5. Flasks, Jars, Pots, Phials, Ampoules & Other Containers) 34
      6. Export
      7. Analysis of Glass Products (Carboys, Bottles, Flasks, Jars, Pots, Phials, Ampoules
      8. and Other Containers) 35
      9. Pricing Analysis 37
      10. Manufacturing &
      11. Labor Cost Structure Analysis of Glass Packaging 37
    6. Global Glass Packaging
    7. Market, By Product
      1. Overview 40
        1. Standard Glass Quality 40
        2. Premium Glass Quality 40
        3. Super Premium Glass Quality 40
    8. Global Glass Packaging Market, By Application
      1. Overview 43
        1. Food Packaging 43
        2. Personal Care Packaging
        3. Pharmaceuticals Packaging 43
        4. Others 44
      2. 7.1.1
      3. Beverage Packaging 43
      4. 43
    9. Global
    10. Glass Packaging Market, By Region
      1. Overview 47
      2. North America 49
        1. U.S. 53
        2. Canada 56
      3. Europe 59
        1. Germany 63
        2. U.K 66
        3. Italy 68
        4. Spain 71
        5. France 73
      4. 8.3.6
      5. Rest of Europe 76
      6. Asia-Pacific 79
        1. China 83
        2. Japan
        3. India 88
        4. Rest of Asia-Pacific 90
      7. 85
      8. Rest of the World
        1. Middle East & Africa 97
        2. South America 99
      9. (RoW) 93
    11. Competitive Landscape
      1. Market Share Analysis 103
      2. Product Benchmarking
      3. 104
    12. Company Profiles
      1. Owens-Illinois Inc. 106
        1. Financial Overview 106
        2. Products Offerings
        3. SWOT Analysis 107
        4. Key Strategy 108
      2. 10.1.1
      3. Company Overview 106
      4. 107
      5. Ardagh
        1. Company Overview 109
        2. Financial Overview 109
        3. Products Offerings 110
        4. SWOT Analysis 111
        5. Key Strategy
      6. Group S.A. 109
      7. 111
      8. Verallia 112
        1. Company Overview 112
        2. Financial
        3. Products Offerings 112
        4. SWOT Analysis 112
        5. Key Strategy 112
      9. overview 112
      10. Vidrala S.A. 113
        1. Company Overview
        2. Financial overview 113
        3. Products Offerings 114
        4. SWOT Analysis 114
        5. Key Strategy 115
      11. 113
      12. 10.4.4
      13. Key Development 114
      14. BA Vidro 116
        1. Company Overview 116
        2. Financial Overview
        3. Products Offerings 117
        4. SWOT Analysis 117
      15. 116
      16. 10.5.5
      17. Key Strategy 117
      18. Gerresheimer AG 118
        1. Company Overview 118
        2. Financial Overview 118
        3. Products Offerings 119
        4. SWOT
        5. Key Strategy 120
      19. Analysis 120
      20. Vetropack Holding Company 121
        1. Company Overview 121
        2. Financial Overview 121
        3. Products
        4. SWOT Analysis 123
        5. Key Strategy 123
        6. Company Overview 124
        7. Financial
        8. Products Offerings 124
        9. SWOT Analysis 125
        10. Key Strategy 125
      21. Offerings 122
      22. 10.8
      23. Stölzle Glass Group 124
      24. Overview 124
      25. Piramal Glass 126
        1. Company Overview
        2. Financial Overview 126
        3. Products Offerings 127
        4. Key Strategy 128
      26. 126
      27. 10.9.4
      28. SWOT Analysis 128
      29. Wiegand-Glas GmbH 129
        1. Company Overview 129
        2. Financial overview 129
        3. Key Developments 129
        4. SWOT Analysis
        5. Key Strategy 129
      30. 10.10.3
      31. Products Offerings 129
      32. 129
      33. Zignago Vetro S.P.A. 130
        1. Financial Overview 130
        2. Products Offerings
        3. SWOT Analysis 131
        4. Key Strategy 132
      34. 10.11.1
      35. Company Overview 130
      36. 131
      37. Verescence
        1. Company Overview 133
        2. Financial overview 133
        3. SWOT Analysis 134
        4. Key Strategy
      38. 133
      39. 10.12.3
      40. Products Offerings 133
      41. 134
      42. Luigi Bormioli Corporation 135
        1. Company Overview 135
        2. Financial Overview 135
        3. Products Offerings 135
        4. Key Strategy 136
      43. 10.13.4
      44. SWOT Analysis 135
      45. Vetrobalsamo Spa 137
        1. Company Overview 137
        2. Financial Overview 137
        3. SWOT Analysis 138
        4. Key Strategy
      46. 10.14.3
      47. Products Offerings 137
      48. 138
      49. Allied Glass Containers Ltd 139
        1. Company Overview 139
        2. Financial Overview 139
        3. Products Offerings 139
      50. 10.15.4
      51. SWOT Analysis 139
      52. Nihon Yamamura Glass Co., Ltd. 140
        1. Company
        2. Financial Overview 140
        3. Products Offerings
        4. SWOT Analysis 141
        5. Key Strategy 141
      53. Overview 140
      54. 140
      55. Vitro
        1. Company Overview 142
        2. Financial Overview 142
        3. SWOT Analysis 143
        4. Key Strategy
      56. 142
      57. 10.17.3
      58. Products Offerings 143
      59. 143
      60. Heinz Glas GmbH & Co. KGAA 144
        1. Company Overview
        2. Financial Overview 144
        3. Products Offerings 144
        4. Key Strategy 145
      61. 144
      62. 10.18.4
      63. SWOT Analysis 145
    13. Glass Packaging Manufacturing
      1. Process, & Marketing Strategy Analysis
      2. Marketing Channel of Glass
      3. Packaging Products 147
      4. Glass Manufacturing process 147
    14. Appendix
      1. References 150
    15. List of Tables
    16. MARKET SYNOPSIS 17
    17. LIST OF ASSUMPTIONS 21
    18. ALCOHOL CONSUMERS, EX-DRINKERS AND
      1. LIFETIME ABSTAINERS, 2020 28
    19. NORTH AMERICA: IMPORT ANALYSIS OF GLASS
      1. PRODUCTS, 2023-2032 (USD THOUSAND) 34
    20. EUROPE: IMPORT ANALYSIS OF GLASS
      1. PRODUCTS, 2023-2032 (USD THOUSAND) 34
    21. ASIA-PACIFIC: IMPORT ANALYSIS
      1. OF GLASS PRODUCTS, 2023-2032 (USD THOUSAND) 34
    22. MIDDLE EAST & AFRICA:
      1. IMPORT ANALYSIS OF GLASS PRODUCTS, 2023-2032 (USD THOUSAND) 35
    23. NORTH
      1. AMERICA: EXPORT ANALYSIS OF GLASS PRODUCTS, 2023-2032 (USD THOUSAND) 35
      2. TABLE
    24. EUROPE: EXPORT ANALYSIS OF GLASS PRODUCTS, 2023-2032 (USD THOUSAND) 35
      1. TABLE
    25. ASIA-PACIFIC: EXPORT ANALYSIS OF GLASS PRODUCTS, 2023-2032 (USD THOUSAND) 36
    26. MIDDLE EAST & AFRICA: EXPORT ANALYSIS OF GLASS PRODUCTS, 2023-2032
      1. (USD THOUSAND) 36
    27. PROPORTION OF MANUFACTURING COST STRUCTURE 37
    28. LABOR COST ANALYSIS 38
    29. GLOBAL GLASS PACKAGING MARKET, BY
      1. PRODUCT, 2023-2032 (USD MILLION) 41
    30. GLOBAL GLASS PACKAGING MARKET,
      1. BY PRODUCT, 2023-2032 (USD MILLION) 41
    31. GLOBAL GLASS PACKAGING MARKET,
      1. BY PRODUCT, 2023-2032 (MILLION TONNES) 41
    32. GLOBAL GLASS PACKAGING MARKET,
      1. BY PRODUCT, 2023-2032 (MILLION TONNES) 41
    33. GLOBAL GLASS PACKAGING MARKET,
      1. BY APPLICATION, 2023-2032 (USD MILLION) 44
    34. GLOBAL GLASS PACKAGING
    35. MARKET, BY APPLICATION, 2023-2032 (USD MILLION) 45
    36. GLOBAL GLASS PACKAGING
    37. MARKET, BY APPLICATION, 2023-2032 (MILLION TONNES) 45
    38. GLOBAL GLASS
    39. PACKAGING MARKET, BY APPLICATION, 2023-2032 (MILLION TONNES) 45
    40. GLOBAL
    41. GLASS PACKAGING MARKET, BY COUNTRY, 2023-2032 (USD MILLION) 47
    42. GLOBAL
    43. GLASS PACKAGING MARKET, BY COUNTRY, 2023-2032 (USD MILLION) 48
    44. GLOBAL
    45. GLASS PACKAGING MARKET, BY COUNTRY, 2023-2032 (MILLION TONNES) 48
      1. TABLE 25
    46. GLOBAL GLASS PACKAGING MARKET, BY COUNTRY, 2023-2032 (MILLION TONNES) 48
      1. TABLE
    47. NORTH AMERICA: GLOBAL GLASS PACKAGING MARKET, BY COUNTRY, 2023-2032 (USD MILLION)
      1. 49
    48. NORTH AMERICA: GLOBAL GLASS PACKAGING MARKET, BY COUNTRY, 2023-2032
      1. (USD MILLION) 49
    49. NORTH AMERICA: GLOBAL GLASS PACKAGING MARKET, BY
      1. COUNTRY, 2023-2032 (MILLION TONNES) 50
    50. NORTH AMERICA: GLOBAL GLASS
    51. PACKAGING MARKET, BY COUNTRY, 2023-2032 (MILLION TONNES) 50
    52. NORTH
    53. AMERICA: GLOBAL GLASS PACKAGING MARKET, BY PRODUCT, 2023-2032 (USD MILLION) 50
    54. NORTH AMERICA: GLOBAL GLASS PACKAGING MARKET, BY PRODUCT, 2023-2032 (USD
      1. MILLION) 50
    55. NORTH AMERICA: GLOBAL GLASS PACKAGING MARKET, BY PRODUCT,
    56. NORTH AMERICA: GLOBAL GLASS PACKAGING
    57. MARKET, BY PRODUCT, 2023-2032 (MILLION TONNES) 51
    58. NORTH AMERICA: GLOBAL
    59. GLASS PACKAGING MARKET, BY APPLICATION, 2023-2032 (USD MILLION) 51
      1. TABLE 35
    60. NORTH AMERICA: GLOBAL GLASS PACKAGING MARKET, BY APPLICATION, 2023-2032 (USD MILLION)
      1. 52
    61. NORTH AMERICA: GLOBAL GLASS PACKAGING MARKET, BY APPLICATION, 2023-2032
      1. (MILLION TONNES) 52
    62. NORTH AMERICA: GLOBAL GLASS PACKAGING MARKET,
      1. BY APPLICATION, 2023-2032 (MILLION TONNES) 53
    63. U.S.: GLOBAL GLASS PACKAGING
    64. MARKET, BY PRODUCT, 2023-2032 (USD MILLION) 53
    65. U.S.: GLOBAL GLASS
    66. PACKAGING MARKET, BY PRODUCT, 2023-2032 (USD MILLION) 53
    67. U.S.: GLOBAL
    68. GLASS PACKAGING MARKET, BY PRODUCT, 2023-2032 (MILLION TONNES) 54
      1. TABLE 41
    69. U.S.: GLOBAL GLASS PACKAGING MARKET, BY PRODUCT, 2023-2032 (MILLION TONNES) 54
    70. U.S.: GLOBAL GLASS PACKAGING MARKET, BY APPLICATION, 2023-2032 (USD MILLION)
      1. 54
    71. U.S.: GLOBAL GLASS PACKAGING MARKET, BY APPLICATION, 2023-2032
      1. (USD MILLION) 55
    72. U.S.: GLOBAL GLASS PACKAGING MARKET, BY APPLICATION,
    73. U.S.: GLOBAL GLASS PACKAGING MARKET,
      1. BY APPLICATION, 2023-2032 (MILLION TONNES) 55
    74. CANADA: GLOBAL GLASS
    75. PACKAGING MARKET, BY PRODUCT, 2023-2032 (USD MILLION) 56
    76. CANADA: GLOBAL
    77. GLASS PACKAGING MARKET, BY PRODUCT, 2023-2032 (USD MILLION) 56
    78. CANADA:
    79. GLOBAL GLASS PACKAGING MARKET, BY PRODUCT, 2023-2032 (MILLION TONNES) 56
      1. TABLE
    80. CANADA: GLOBAL GLASS PACKAGING MARKET, BY PRODUCT, 2023-2032 (MILLION TONNES)
      1. 57
    81. CANADA: GLOBAL GLASS PACKAGING MARKET, BY APPLICATION, 2023-2032
      1. (USD MILLION) 57
    82. CANADA: GLOBAL GLASS PACKAGING MARKET, BY APPLICATION,
    83. CANADA: GLOBAL GLASS PACKAGING MARKET,
      1. BY APPLICATION, 2023-2032 (MILLION TONNES) 58
    84. CANADA: GLOBAL GLASS
    85. PACKAGING MARKET, BY APPLICATION, 2023-2032 (MILLION TONNES) 58
    86. EUROPE:
    87. GLOBAL GLASS PACKAGING MARKET, BY COUNTRY, 2023-2032 (USD MILLION) 59
      1. TABLE
    88. EUROPE: GLOBAL GLASS PACKAGING MARKET, BY COUNTRY, 2023-2032 (USD MILLION) 60
    89. EUROPE: GLOBAL GLASS PACKAGING MARKET, BY COUNTRY, 2023-2032 (MILLION
      1. TONNES) 60
    90. EUROPE: GLOBAL GLASS PACKAGING MARKET, BY COUNTRY, 2023-2032
      1. (MILLION TONNES) 60
    91. EUROPE: GLOBAL GLASS PACKAGING MARKET, BY PRODUCT,
    92. EUROPE: GLOBAL GLASS PACKAGING MARKET,
      1. BY PRODUCT, 2023-2032 (USD MILLION) 61
    93. EUROPE: GLOBAL GLASS PACKAGING
    94. MARKET, BY PRODUCT, 2023-2032 (MILLION TONNES) 61
    95. EUROPE: GLOBAL GLASS
    96. PACKAGING MARKET, BY PRODUCT, 2023-2032 (MILLION TONNES) 61
    97. EUROPE:
    98. GLOBAL GLASS PACKAGING MARKET, BY APPLICATION, 2023-2032 (USD MILLION) 62
      1. TABLE
    99. EUROPE: GLOBAL GLASS PACKAGING MARKET, BY APPLICATION, 2023-2032 (USD MILLION)
      1. 62
    100. EUROPE: GLOBAL GLASS PACKAGING MARKET, BY APPLICATION, 2023-2032
      1. (MILLION TONNES) 62
    101. EUROPE: GLOBAL GLASS PACKAGING MARKET, BY APPLICATION,
    102. GERMANY: GLOBAL GLASS PACKAGING MARKET,
      1. BY PRODUCT, 2023-2032 (USD MILLION) 63
    103. GERMANY: GLOBAL GLASS PACKAGING
    104. MARKET, BY PRODUCT, 2023-2032 (USD MILLION) 63
    105. GERMANY: GLOBAL GLASS
    106. PACKAGING MARKET, BY PRODUCT, 2023-2032 (MILLION TONNES) 64
    107. GERMANY:
    108. GLOBAL GLASS PACKAGING MARKET, BY PRODUCT, 2023-2032 (MILLION TONNES) 64
      1. TABLE
    109. GERMANY: GLOBAL GLASS PACKAGING MARKET, BY APPLICATION, 2023-2032 (USD MILLION)
      1. 64
    110. GERMANY: GLOBAL GLASS PACKAGING MARKET, BY APPLICATION, 2023-2032
      1. (USD MILLION) 65
    111. GERMANY: GLOBAL GLASS PACKAGING MARKET, BY APPLICATION,
    112. GERMANY: GLOBAL GLASS PACKAGING MARKET,
      1. BY APPLICATION, 2023-2032 (MILLION TONNES) 65
    113. U.K: GLOBAL GLASS PACKAGING
    114. MARKET, BY PRODUCT, 2023-2032 (USD MILLION) 66
    115. U.K: GLOBAL GLASS PACKAGING
    116. MARKET, BY PRODUCT, 2023-2032 (USD MILLION) 66
    117. U.K: GLOBAL GLASS PACKAGING
    118. MARKET, BY PRODUCT, 2023-2032 (MILLION TONNES) 66
    119. U.K: GLOBAL GLASS
    120. PACKAGING MARKET, BY PRODUCT, 2023-2032 (MILLION TONNES) 67
    121. U.K: GLOBAL
    122. GLASS PACKAGING MARKET, BY APPLICATION, 2023-2032 (USD MILLION) 67
      1. TABLE 79
    123. U.K: GLOBAL GLASS PACKAGING MARKET, BY APPLICATION, 2023-2032 (USD MILLION) 67
    124. U.K: GLOBAL GLASS PACKAGING MARKET, BY APPLICATION, 2023-2032 (MILLION
      1. TONNES) 68
    125. U.K: GLOBAL GLASS PACKAGING MARKET, BY APPLICATION, 2023-2032
      1. (MILLION TONNES) 68
    126. ITALY: GLOBAL GLASS PACKAGING MARKET, BY PRODUCT,
    127. ITALY: GLOBAL GLASS PACKAGING MARKET, BY
      1. PRODUCT, 2023-2032 (USD MILLION) 69
    128. ITALY: GLOBAL GLASS PACKAGING
    129. MARKET, BY PRODUCT, 2023-2032 (MILLION TONNES) 69
    130. ITALY: GLOBAL GLASS
    131. PACKAGING MARKET, BY PRODUCT, 2023-2032 (MILLION TONNES) 69
    132. ITALY:
    133. GLOBAL GLASS PACKAGING MARKET, BY APPLICATION, 2023-2032 (USD MILLION) 69
      1. TABLE
    134. ITALY: GLOBAL GLASS PACKAGING MARKET, BY APPLICATION, 2023-2032 (USD MILLION)
      1. 70
    135. ITALY: GLOBAL GLASS PACKAGING MARKET, BY APPLICATION, 2023-2032
      1. (MILLION TONNES) 70
    136. ITALY: GLOBAL GLASS PACKAGING MARKET, BY APPLICATION,
    137. SPAIN: GLOBAL GLASS PACKAGING MARKET,
      1. BY PRODUCT, 2023-2032 (USD MILLION) 71
    138. SPAIN: GLOBAL GLASS PACKAGING
    139. MARKET, BY PRODUCT, 2023-2032 (USD MILLION) 71
    140. SPAIN: GLOBAL GLASS
    141. PACKAGING MARKET, BY PRODUCT, 2023-2032 (MILLION TONNES) 71
    142. SPAIN:
    143. GLOBAL GLASS PACKAGING MARKET, BY PRODUCT, 2023-2032 (MILLION TONNES) 72
      1. TABLE
    144. SPAIN: GLOBAL GLASS PACKAGING MARKET, BY APPLICATION, 2023-2032 (USD MILLION)
      1. 72
    145. SPAIN: GLOBAL GLASS PACKAGING MARKET, BY APPLICATION, 2023-2032
      1. (USD MILLION) 72
    146. SPAIN: GLOBAL GLASS PACKAGING MARKET, BY APPLICATION,
    147. SPAIN: GLOBAL GLASS PACKAGING MARKET,
      1. BY APPLICATION, 2023-2032 (MILLION TONNES) 73
    148. FRANCE: GLOBAL GLASS
    149. PACKAGING MARKET, BY PRODUCT, 2023-2032 (USD MILLION) 73
    150. FRANCE: GLOBAL
    151. GLASS PACKAGING MARKET, BY PRODUCT, 2023-2032 (USD MILLION) 74
    152. FRANCE:
    153. GLOBAL GLASS PACKAGING MARKET, BY PRODUCT, 2023-2032 (MILLION TONNES) 74
      1. TABLE
    154. FRANCE: GLOBAL GLASS PACKAGING MARKET, BY PRODUCT, 2023-2032 (MILLION TONNES)
      1. 74
    155. FRANCE: GLOBAL GLASS PACKAGING MARKET, BY APPLICATION, 2023-2032
      1. (USD MILLION) 74
    156. FRANCE: GLOBAL GLASS PACKAGING MARKET, BY APPLICATION,
    157. FRANCE: GLOBAL GLASS PACKAGING MARKET,
      1. BY APPLICATION, 2023-2032 (MILLION TONNES) 75
    158. FRANCE: GLOBAL GLASS
    159. PACKAGING MARKET, BY APPLICATION, 2023-2032 (MILLION TONNES) 75
    160. REST
    161. OF EUROPE: GLOBAL GLASS PACKAGING MARKET, BY PRODUCT, 2023-2032 (USD MILLION) 76
    162. REST OF EUROPE: GLOBAL GLASS PACKAGING MARKET, BY PRODUCT, 2023-2032
      1. (USD MILLION) 76
    163. REST OF EUROPE: GLOBAL GLASS PACKAGING MARKET, BY
      1. PRODUCT, 2023-2032 (MILLION TONNES) 76
    164. REST OF EUROPE: GLOBAL GLASS
    165. PACKAGING MARKET, BY PRODUCT, 2023-2032 (MILLION TONNES) 77
    166. REST
    167. OF EUROPE: GLOBAL GLASS PACKAGING MARKET, BY APPLICATION, 2023-2032 (USD MILLION)
      1. 77
    168. REST OF EUROPE: GLOBAL GLASS PACKAGING MARKET, BY APPLICATION,
    169. REST OF EUROPE: GLOBAL GLASS PACKAGING
    170. MARKET, BY APPLICATION, 2023-2032 (MILLION TONNES) 78
    171. REST OF EUROPE:
    172. GLOBAL GLASS PACKAGING MARKET, BY APPLICATION, 2023-2032 (MILLION TONNES) 78
    173. ASIA-PACIFIC: GLOBAL GLASS PACKAGING MARKET, BY COUNTRY, 2023-2032 (USD
      1. MILLION) 79
    174. ASIA-PACIFIC: GLOBAL GLASS PACKAGING MARKET, BY COUNTRY,
    175. ASIA-PACIFIC: GLOBAL GLASS PACKAGING MARKET,
      1. BY COUNTRY, 2023-2032 (MILLION TONNES) 80
    176. ASIA-PACIFIC: GLOBAL GLASS
    177. PACKAGING MARKET, BY COUNTRY, 2023-2032 (MILLION TONNES) 80
    178. ASIA-PACIFIC:
    179. GLOBAL GLASS PACKAGING MARKET, BY PRODUCT, 2023-2032 (USD MILLION) 80
      1. TABLE
    180. ASIA-PACIFIC: GLOBAL GLASS PACKAGING MARKET, BY PRODUCT, 2023-2032 (USD MILLION)
      1. 81
    181. ASIA-PACIFIC: GLOBAL GLASS PACKAGING MARKET, BY PRODUCT, 2023-2032
      1. (MILLION TONNES) 81
    182. ASIA-PACIFIC: GLOBAL GLASS PACKAGING MARKET,
      1. BY PRODUCT, 2023-2032 (MILLION TONNES) 81
    183. ASIA-PACIFIC: GLOBAL GLASS
    184. PACKAGING MARKET, BY APPLICATION, 2023-2032 (USD MILLION) 81
    185. ASIA-PACIFIC:
    186. GLOBAL GLASS PACKAGING MARKET, BY APPLICATION, 2023-2032 (USD MILLION) 82
      1. TABLE
    187. ASIA-PACIFIC: GLOBAL GLASS PACKAGING MARKET, BY APPLICATION, 2023-2032 (MILLION
      1. TONNES) 82
    188. ASIA-PACIFIC: GLOBAL GLASS PACKAGING MARKET, BY APPLICATION,
    189. CHINA: GLOBAL GLASS PACKAGING MARKET,
      1. BY PRODUCT, 2023-2032 (USD MILLION) 83
    190. CHINA: GLOBAL GLASS PACKAGING
    191. MARKET, BY PRODUCT, 2023-2032 (USD MILLION) 83
    192. CHINA: GLOBAL GLASS
    193. PACKAGING MARKET, BY PRODUCT, 2023-2032 (MILLION TONNES) 83
    194. CHINA:
    195. GLOBAL GLASS PACKAGING MARKET, BY PRODUCT, 2023-2032 (MILLION TONNES) 84
      1. TABLE
    196. CHINA: GLOBAL GLASS PACKAGING MARKET, BY APPLICATION, 2023-2032 (USD MILLION)
      1. 84
    197. CHINA: GLOBAL GLASS PACKAGING MARKET, BY APPLICATION, 2023-2032
      1. (USD MILLION) 84
    198. CHINA: GLOBAL GLASS PACKAGING MARKET, BY APPLICATION,
    199. CHINA: GLOBAL GLASS PACKAGING MARKET,
      1. BY APPLICATION, 2023-2032 (MILLION TONNES) 85
    200. JAPAN: GLOBAL GLASS
    201. PACKAGING MARKET, BY PRODUCT, 2023-2032 (USD MILLION) 85
    202. JAPAN: GLOBAL
    203. GLASS PACKAGING MARKET, BY PRODUCT, 2023-2032 (USD MILLION) 86
    204. JAPAN:
    205. GLOBAL GLASS PACKAGING MARKET, BY PRODUCT, 2023-2032 (MILLION TONNES) 86
      1. TABLE
    206. JAPAN: GLOBAL GLASS PACKAGING MARKET, BY PRODUCT, 2023-2032 (MILLION TONNES)
      1. 86
    207. JAPAN: GLOBAL GLASS PACKAGING MARKET, BY APPLICATION, 2023-2032
      1. (USD MILLION) 86
    208. JAPAN: GLOBAL GLASS PACKAGING MARKET, BY APPLICATION,
    209. JAPAN: GLOBAL GLASS PACKAGING MARKET,
      1. BY APPLICATION, 2023-2032 (MILLION TONNES) 87
    210. JAPAN: GLOBAL GLASS
    211. PACKAGING MARKET, BY APPLICATION, 2023-2032 (MILLION TONNES) 87
    212. INDIA:
    213. GLOBAL GLASS PACKAGING MARKET, BY PRODUCT, 2023-2032 (USD MILLION) 88
      1. TABLE
    214. INDIA: GLOBAL GLASS PACKAGING MARKET, BY PRODUCT, 2023-2032 (USD MILLION) 88
    215. INDIA: GLOBAL GLASS PACKAGING MARKET, BY PRODUCT, 2023-2032 (MILLION
      1. TONNES) 88
    216. INDIA: GLOBAL GLASS PACKAGING MARKET, BY PRODUCT, 2023-2032
      1. (MILLION TONNES) 89
    217. INDIA: GLOBAL GLASS PACKAGING MARKET, BY APPLICATION,
    218. INDIA: GLOBAL GLASS PACKAGING MARKET,
      1. BY APPLICATION, 2023-2032 (USD MILLION) 89
    219. INDIA: GLOBAL GLASS PACKAGING
    220. MARKET, BY APPLICATION, 2023-2032 (MILLION TONNES) 90
    221. INDIA: GLOBAL
    222. GLASS PACKAGING MARKET, BY APPLICATION, 2023-2032 (MILLION TONNES) 90
      1. TABLE
    223. REST OF ASIA-PACIFIC: GLOBAL GLASS PACKAGING MARKET, BY PRODUCT, 2023-2032 (USD
      1. MILLION) 90
    224. REST OF ASIA-PACIFIC: GLOBAL GLASS PACKAGING MARKET,
      1. BY PRODUCT, 2023-2032 (USD MILLION) 91
    225. REST OF ASIA-PACIFIC: GLOBAL
    226. GLASS PACKAGING MARKET, BY PRODUCT, 2023-2032 (MILLION TONNES) 91
      1. TABLE 153
    227. REST OF ASIA-PACIFIC: GLOBAL GLASS PACKAGING MARKET, BY PRODUCT, 2023-2032 (MILLION
      1. TONNES) 91
    228. REST OF ASIA-PACIFIC: GLOBAL GLASS PACKAGING MARKET, BY
      1. APPLICATION, 2023-2032 (USD MILLION) 91
    229. REST OF ASIA-PACIFIC: GLOBAL
    230. GLASS PACKAGING MARKET, BY APPLICATION, 2023-2032 (USD MILLION) 92
      1. TABLE 156
    231. REST OF ASIA-PACIFIC: GLOBAL GLASS PACKAGING MARKET, BY APPLICATION, 2023-2032 (MILLION
      1. TONNES) 92
    232. REST OF ASIA-PACIFIC: GLOBAL GLASS PACKAGING MARKET, BY
      1. APPLICATION, 2023-2032 (MILLION TONNES) 92
    233. REST OF THE WORLD (ROW):
    234. GLOBAL GLASS PACKAGING MARKET, BY COUNTRY, 2023-2032 (USD MILLION) 93
      1. TABLE
    235. REST OF THE WORLD (ROW): GLOBAL GLASS PACKAGING MARKET, BY COUNTRY, 2023-2032
      1. (USD MILLION) 93
    236. REST OF THE WORLD (ROW): GLOBAL GLASS PACKAGING
    237. MARKET, BY COUNTRY, 2023-2032 (MILLION TONNES) 94
    238. REST OF THE WORLD
    239. (ROW): GLOBAL GLASS PACKAGING MARKET, BY COUNTRY, 2023-2032 (MILLION TONNES) 94
    240. REST OF THE WORLD (ROW): GLOBAL GLASS PACKAGING MARKET, BY PRODUCT,
    241. REST OF THE WORLD (ROW): GLOBAL GLASS
    242. PACKAGING MARKET, BY PRODUCT, 2023-2032 (USD MILLION) 94
    243. REST OF
    244. THE WORLD (ROW): GLOBAL GLASS PACKAGING MARKET, BY PRODUCT, 2023-2032 (MILLION TONNES)
      1. 95
    245. REST OF THE WORLD (ROW): GLOBAL GLASS PACKAGING MARKET, BY PRODUCT,
    246. REST OF THE WORLD (ROW): GLOBAL GLASS
    247. PACKAGING MARKET, BY APPLICATION, 2023-2032 (USD MILLION) 95
    248. REST
    249. OF THE WORLD (ROW): GLOBAL GLASS PACKAGING MARKET, BY APPLICATION, 2023-2032 (USD
      1. MILLION) 96
    250. REST OF THE WORLD (ROW): GLOBAL GLASS PACKAGING MARKET,
      1. BY APPLICATION, 2023-2032 (MILLION TONNES) 96
    251. REST OF THE WORLD (ROW):
    252. GLOBAL GLASS PACKAGING MARKET, BY APPLICATION, 2023-2032 (MILLION TONNES) 96
    253. MIDDLE EAST & AFRICA: GLOBAL GLASS PACKAGING MARKET, BY PRODUCT,
    254. MIDDLE EAST & AFRICA: GLOBAL GLASS
    255. PACKAGING MARKET, BY PRODUCT, 2023-2032 (USD MILLION) 97
    256. MIDDLE EAST
    257. & AFRICA: GLOBAL GLASS PACKAGING MARKET, BY PRODUCT, 2023-2032 (MILLION TONNES)
      1. 97
    258. MIDDLE EAST & AFRICA: GLOBAL GLASS PACKAGING MARKET, BY PRODUCT,
    259. MIDDLE EAST & AFRICA: GLOBAL GLASS
    260. PACKAGING MARKET, BY APPLICATION, 2023-2032 (USD MILLION) 98
    261. MIDDLE
    262. EAST & AFRICA: GLOBAL GLASS PACKAGING MARKET, BY APPLICATION, 2023-2032 (USD
      1. MILLION) 98
    263. MIDDLE EAST & AFRICA: GLOBAL GLASS PACKAGING MARKET,
      1. BY APPLICATION, 2023-2032 (MILLION TONNES) 99
    264. MIDDLE EAST & AFRICA:
    265. GLOBAL GLASS PACKAGING MARKET, BY APPLICATION, 2023-2032 (MILLION TONNES) 99
    266. SOUTH AMERICA: GLOBAL GLASS PACKAGING MARKET, BY PRODUCT, 2023-2032
      1. (USD MILLION) 99
    267. SOUTH AMERICA: GLOBAL GLASS PACKAGING MARKET, BY
      1. PRODUCT, 2023-2032 (USD MILLION) 100
    268. SOUTH AMERICA: GLOBAL GLASS
    269. PACKAGING MARKET, BY PRODUCT, 2023-2032 (MILLION TONNES) 100
    270. SOUTH
    271. AMERICA: GLOBAL GLASS PACKAGING MARKET, BY PRODUCT, 2023-2032 (MILLION TONNES) 100
    272. SOUTH AMERICA: GLOBAL GLASS PACKAGING MARKET, BY APPLICATION, 2023-2032
      1. (USD MILLION) 100
    273. SOUTH AMERICA: GLOBAL GLASS PACKAGING MARKET, BY
      1. APPLICATION, 2023-2032 (USD MILLION) 101
    274. SOUTH AMERICA: GLOBAL GLASS
    275. PACKAGING MARKET, BY APPLICATION, 2023-2032 (MILLION TONNES) 101
      1. TABLE 185
    276. SOUTH AMERICA: GLOBAL GLASS PACKAGING MARKET, BY APPLICATION, 2023-2032 (MILLION
      1. TONNES) 101
    277. List of Figures
    278. GLOBAL GLASS PACKAGING MARKET:
      1. MARKET STRUCTURE 20
    279. RESEARCH PROCESS OF MRFR 23
    280. TOP
      1. DOWN & BOTTOM UP APPROACH 25
    281. DRIVERS, RESTRAINTS, AND OPPORTUNITY
      1. OF GLOBAL GLASS PACKAGING MARKET 27
    282. GLOBAL SPENDING ON MEDICINES,
    283. DRIVERS IMPACT ANALYSIS 29
      1. FIGURE
    284. RESTRAINTS IMPACT ANALYSIS 30
    285. PORTER''S FIVE FORCES ANALYSIS OF
      1. GLOBAL GLASS PACKAGING MARKET 32
    286. SUPPLY CHAIN ANALYSIS: GLASS PACKAGING
      1. MARKET 33
    287. PRODUCER PRICE INDEX BY INDUSTRY: GLASS AND GLASS PRODUCT
      1. MANUFACTURING 37
    288. GLOBAL GLASS PACKAGING MARKET SHARE, BY PRODUCT,
    289. GLOBAL GLASS PACKAGING MARKET SHARE, BY APPLICATION,
    290. GLOBAL GLASS PACKAGING MARKET SHARE, BY COUNTRY, 2020
      1. (IN %) 47
    291. NORTH AMERICA: GLASS PACKAGING MARKET SHARE, BY COUNTRY,
    292. EUROPE: GLASS PACKAGING MARKET SHARE, BY COUNTRY,
    293. ASIA-PACIFIC: GLASS PACKAGING MARKET SHARE, BY COUNTRY,
    294. REST OF THE WORLD (ROW): GLASS PACKAGING MARKET SHARE,
      1. BY COUNTRY, 2020 (IN %) 93
    295. GLOBAL GLASS PACKAGING MARKET SHARE ANALYSIS,
    296. BENCHMARKING OF MAJOR COMPETITIORS 104
      1. FIGURE 20
      2. OWENS-ILLINOIS INC.: FINANCIAL OVERVIEW 106
    297. OWENS-ILLINOIS INC.:
      1. GEOGRAPHICAL OVERVIEW 107
    298. ARDAGH GROUP S.A.: FINANCIAL OVERVIEW 109
    299. ARDAGH GROUP S.A.: GEOGRAPHICAL REVENUE (GLASS PACKAGING) 110
      1. FIGURE
    300. ARDAGH GROUP S.A.: SEGMENTAL REVENUE 110
    301. VIDRALA S.A.: FINANCIAL
      1. OVERVIEW 113
    302. VIDRALA S.A.: GEOGRAPHICAL OVERVIEW 114
      1. FIGURE
    303. BA VIDRO: FINANCIAL OVERVIEW 116
    304. BA VIDRO: SEGMENTAL OVERVIEW
      1. 117
    305. GERRESHEIMER AG: FINANCIAL OVERVIEW 118
    306. GERRESHEIMER
      1. AG: GEOGRAPHICAL OVERVIEW 119
    307. GERRESHEIMER SEGMENTATION OVERVIEW
      1. 119
    308. VETROPACK HOLDING COMPANY: FINANCIAL OVERVIEW 121
      1. FIGURE
    309. VETROPACK HOLDING COMPANY: GEOGRAPHICAL OVERVIEW 122
    310. PIRAMAL GLASS
      1. FINANCIAL OVERVIEW 126
    311. PIRAMAL GLASS SEGMENTATION OVERVIEW 127
    312. ZIGNAGO VETRO S.P.A.: FINANCIAL OVERVIEW 130
    313. ZIGNAGO
      1. VETRO S.P.A.: GEOGRAPHICAL REVENUE 131
    314. NIHON YAMAMURA GLASS CO.,
      1. LTD: TOTAL REVENUE VS SEGMENTAL REVENUE 140
    315. VITRO: TOTAL REVENUE
      1. VS SEGMENTAL REVENUE 142
    316. VITRO: GEOGRAPHICAL REVENUE 143
      1. FIGURE
    317. MARKETING CHANNEL OF GLASS PACKAGING PRODUCT 147

    Glass Packaging Product Outlook (USD Billion, 2018-2032)

    • Standard Glass Quality
    • Premium Glass Quality
    • Super Premium Glass Quality

    Glass Packaging Application Outlook (USD Billion, 2018-2032)

    • Beverage Packaging
    • Food Packaging
    • Personal Care Packaging
    • Pharmaceuticals Packaging
    • Others

    Glass Packaging Regional Outlook (USD Billion, 2018-2032)

    • North America Outlook (USD Billion, 2018-2032)

      • North America Glass Packaging by Product
        • Standard Glass Quality
        • Premium Glass Quality
        • Super Premium Glass Quality
      • North America Glass Packaging by Application
        • Beverage Packaging
        • Food Packaging
        • Personal Care Packaging
        • Pharmaceuticals Packaging
        • Others
      • US Outlook (USD Billion, 2018-2032)

      • US Glass Packaging by Product
        • Standard Glass Quality
        • Premium Glass Quality
        • Super Premium Glass Quality
      • US Glass Packaging by Application
        • Beverage Packaging
        • Food Packaging
        • Personal Care Packaging
        • Pharmaceuticals Packaging
        • Others
      • CANADA Outlook (USD Billion, 2018-2032)

      • CANADA Glass Packaging by Product
        • Standard Glass Quality
        • Premium Glass Quality
        • Super Premium Glass Quality
      • CANADA Glass Packaging by Application
        • Beverage Packaging
        • Food Packaging
        • Personal Care Packaging
        • Pharmaceuticals Packaging
        • Others
    • Europe Outlook (USD Billion, 2018-2032)

      • Europe Glass Packaging by Product
        • Standard Glass Quality
        • Premium Glass Quality
        • Super Premium Glass Quality
      • Europe Glass Packaging by Application
        • Beverage Packaging
        • Food Packaging
        • Personal Care Packaging
        • Pharmaceuticals Packaging
        • Others
      • Germany Outlook (USD Billion, 2018-2032)

      • Germany Glass Packaging by Product
        • Standard Glass Quality
        • Premium Glass Quality
        • Super Premium Glass Quality
      • Germany Glass Packaging by Application
        • Beverage Packaging
        • Food Packaging
        • Personal Care Packaging
        • Pharmaceuticals Packaging
        • Others
      • France Outlook (USD Billion, 2018-2032)

      • France Glass Packaging by Product
        • Standard Glass Quality
        • Premium Glass Quality
        • Super Premium Glass Quality
      • France Glass Packaging by Application
        • Beverage Packaging
        • Food Packaging
        • Personal Care Packaging
        • Pharmaceuticals Packaging
        • Others
      • UK Outlook (USD Billion, 2018-2032)

      • UK Glass Packaging by Product
        • Standard Glass Quality
        • Premium Glass Quality
        • Super Premium Glass Quality
      • UK Glass Packaging by Application
        • Beverage Packaging
        • Food Packaging
        • Personal Care Packaging
        • Pharmaceuticals Packaging
        • Others
      • ITALY Outlook (USD Billion, 2018-2032)

      • ITALY Glass Packaging by Product
        • Standard Glass Quality
        • Premium Glass Quality
        • Super Premium Glass Quality
      • ITALY Glass Packaging by Application
        • Beverage Packaging
        • Food Packaging
        • Personal Care Packaging
        • Pharmaceuticals Packaging
        • Others
      • SPAIN Outlook (USD Billion, 2018-2032)

      • Spain Glass Packaging by Product
        • Standard Glass Quality
        • Premium Glass Quality
        • Super Premium Glass Quality
      • Spain Glass Packaging by Application
        • Beverage Packaging
        • Food Packaging
        • Personal Care Packaging
        • Pharmaceuticals Packaging
        • Others
      • Rest Of Europe Outlook (USD Billion, 2018-2032)

      • Rest Of Europe Glass Packaging by Product
        • Standard Glass Quality
        • Premium Glass Quality
        • Super Premium Glass Quality
      • REST OF EUROPE Glass Packaging by Application
        • Beverage Packaging
        • Food Packaging
        • Personal Care Packaging
        • Pharmaceuticals Packaging
        • Others
    • Asia-Pacific Outlook (USD Billion, 2018-2032)

      • Asia-Pacific Glass Packaging by Product
        • Standard Glass Quality
        • Premium Glass Quality
        • Super Premium Glass Quality
      • Asia-Pacific Glass Packaging by Application
        • Beverage Packaging
        • Food Packaging
        • Personal Care Packaging
        • Pharmaceuticals Packaging
        • Others
      • China Outlook (USD Billion, 2018-2032)

      • China Glass Packaging by Product
        • Standard Glass Quality
        • Premium Glass Quality
        • Super Premium Glass Quality
      • China Glass Packaging by Application
        • Beverage Packaging
        • Food Packaging
        • Personal Care Packaging
        • Pharmaceuticals Packaging
        • Others
      • Japan Outlook (USD Billion, 2018-2032)

      • Japan Glass Packaging by Product
        • Standard Glass Quality
        • Premium Glass Quality
        • Super Premium Glass Quality
      • Japan Glass Packaging by Application
        • Beverage Packaging
        • Food Packaging
        • Personal Care Packaging
        • Pharmaceuticals Packaging
        • Others
      • India Outlook (USD Billion, 2018-2032)

      • India Glass Packaging by Product
        • Standard Glass Quality
        • Premium Glass Quality
        • Super Premium Glass Quality
      • India Glass Packaging by Application
        • Beverage Packaging
        • Food Packaging
        • Personal Care Packaging
        • Pharmaceuticals Packaging
        • Others
      • Australia Outlook (USD Billion, 2018-2032)

      • Australia Glass Packaging by Product
        • Standard Glass Quality
        • Premium Glass Quality
        • Super Premium Glass Quality
      • Australia Glass Packaging by Application
        • Beverage Packaging
        • Food Packaging
        • Personal Care Packaging
        • Pharmaceuticals Packaging
        • Others
      • Rest of Asia-Pacific Outlook (USD Billion, 2018-2032)

      • Rest of Asia-Pacific Glass Packaging by Product
        • Standard Glass Quality
        • Premium Glass Quality
        • Super Premium Glass Quality
      • Rest of Asia-Pacific Glass Packaging by Application
        • Beverage Packaging
        • Food Packaging
        • Personal Care Packaging
        • Pharmaceuticals Packaging
        • Others
    • Rest of the World Outlook (USD Billion, 2018-2032)

      • Rest of the World Glass Packaging by Product
        • Standard Glass Quality
        • Premium Glass Quality
        • Super Premium Glass Quality
      • Rest of the World Glass Packaging by Application
        • Beverage Packaging
        • Food Packaging
        • Personal Care Packaging
        • Pharmaceuticals Packaging
        • Others
      • Middle East Outlook (USD Billion, 2018-2032)

      • Middle East Glass Packaging by Product
        • Standard Glass Quality
        • Premium Glass Quality
        • Super Premium Glass Quality
      • Middle East Glass Packaging by Application
        • Beverage Packaging
        • Food Packaging
        • Personal Care Packaging
        • Pharmaceuticals Packaging
        • Others
      • Africa Outlook (USD Billion, 2018-2032)

      • Africa Glass Packaging by Product
        • Standard Glass Quality
        • Premium Glass Quality
        • Super Premium Glass Quality
      • Africa Glass Packaging by Application
        • Beverage Packaging
        • Food Packaging
        • Personal Care Packaging
        • Pharmaceuticals Packaging
        • Others
      • Latin America Outlook (USD Billion, 2018-2032)

      • Latin America Glass Packaging by Product
        • Standard Glass Quality
        • Premium Glass Quality
        • Super Premium Glass Quality
      • Latin America Glass Packaging by Application
        • Beverage Packaging
        • Food Packaging
        • Personal Care Packaging
        • Pharmaceuticals Packaging
        • Others
    Infographic

    Free Sample Request

    Kindly complete the form below to receive a free sample of this Report

    Get Free Sample

    Customer Strories

    “I am very pleased with how market segments have been defined in a relevant way for my purposes (such as "Portable Freezers & refrigerators" and "last-mile"). In general the report is well structured. Thanks very much for your efforts.”

    Victoria Milne

    Founder
    Case Study
    Chemicals and Materials