• Cat-intel
  • MedIntelliX
  • Resources
  • About Us
  • Hero Background
    English
    Chinese
    French
    Japanese
    Korean
    German
    Spanish

    Gene Therapy Market Size

    ID: MRFR/Pharma/6927-CR
    167 Pages
    Rahul Gotadki
    June 2025

    Gene Therapy Market Research Report Information by Vector Type (Viral Vector (Lentiviral Vectors (LVVs), Retrovirus Vectors, Adenoviral Vectors (AdVs), Adeno-associated Viral Vectors (AAVs)) and Non-Viral Vector (Physical Vector, Chemical Vector)), by Gene Type (Antigen, Cytokine, Tumor Suppressor, Suicide, Deficiency, Growth Factors, Receptors, and Others), by Application (Oncological Disorder...

    Share:
    Download PDF ×

    We do not share your information with anyone. However, we may send you emails based on your report interest from time to time. You may contact us at any time to opt-out.

    Gene Therapy Market Infographic
    $ 4,950.0
    $ 5,950.0
    $ 7,250.0

    Gene Therapy Size

    Gene Therapy Market Growth Projections and Opportunities

    The gene therapy market is expected to reach USD 2.1 billion by 2032 at 6% CAGR from 2023-2032. Many factors form and advance the Gene Therapy Market. One of the main factors is the growing understanding of genetic issues and gene therapy's capacity to treat them. As logic advances, interest in creative genetic disease treatments has grown. Genetic design, delivery, and gene therapy preliminary' positive clinical findings support this trend, demonstrating its potential. Technical advances in genetic exploration and biotechnology shape the industry. Gene therapy interventions become more accurate, effective, and safe as gene modifying tools, viral vectors, and delivery systems improve. These mechanical advances are expected to expand gene therapy applications, improve treatment outcomes, and prepare for customized genetic medicine, boosting market growth. Medical care expenditure plans, payback arrangements, and gene treatment cost affect the acceptance of these sophisticated remedies. Gene therapies can be expensive, but medical providers and payers like them because they can reduce dependency on traditional drugs and improve patient outcomes. Financial factors influence market dynamics and gene therapy innovation. The gene therapy business is competitive because biotechnology and pharma companies are experts in genetic medicine. Serious competition drives innovation, with companies developing cures for a variety of genetic disorders, speeding delivery, and improving gene changing technologies. The range of contributions allows doctors to choose gene therapies that meet patient needs, creating a dynamic market. Medical services sector educational campaigns raise gene therapy awareness among professionals and the public, affecting market factors. Preparing programs, instructional missions, and patient support efforts demonstrate gene therapy's capacity to transform genetic disease treatment, enabling educated decision-making for those considering high-level mediations. These motivations make gene therapy seem promising in modern medicine. Social attitudes concerning medical services and therapeutic mediations also shape the gene therapy business. Acknowledgement of innovative and high-level medications, morality, and social perception of genetic alteration affect patient preferences and gene therapy consideration. Social factors affect medical service provider-patient communication, creating the gene therapy dynamic cycle. Medical service foundation and availability vary geologically, adding market factors. Different districts may have different access to cutting-edge gene therapy. To reduce these differences, efforts to improve medical care foundation, raise awareness of therapeutic options, and address financial barriers will affect the global gene therapy business.
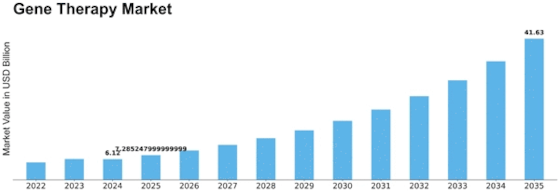
    Gene Therapy Market Size Graph

    Market Summary

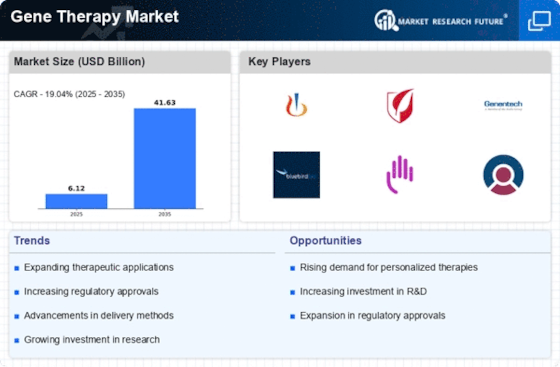
    The Global Gene Therapy Market is projected to grow from 6.12 USD Billion in 2024 to 41.63 USD Billion by 2035, reflecting a robust growth trajectory.

    Key Market Trends & Highlights

    Gene Therapy Key Trends and Highlights

    • The market is expected to experience a compound annual growth rate (CAGR) of 20.36% from 2025 to 2035.
    • By 2035, the market valuation is anticipated to reach 46.9 USD Billion, indicating substantial growth potential.
    • in 2024, the market is valued at 6.12 USD Billion, highlighting its current significance in the healthcare sector.
    • Growing adoption of gene therapy due to advancements in genetic research is a major market driver.

    Market Size & Forecast

    2024 Market Size 6.12 (USD Billion)
    2035 Market Size 41.63 (USD Billion)
    CAGR (2025-2035) 19.04%
    Largest Regional Market Share in 2024 latin_america)

    Major Players

    Bristol-Myers Squibb Company, Lonza, UniQure N.V., Bluebird Bio, Inc., Orchard Therapeutics Plc, GenSight Biologics, Novartis AG, Amgen Inc., Sarepta Therapeutics Inc., Spark Therapeutics, Inc.

    Market Trends

    The Global Gene Therapy Market is poised for transformative growth, driven by advancements in genetic engineering and increasing regulatory support for innovative therapies.

    U.S. Food and Drug Administration (FDA)

    Gene Therapy Market Market Drivers

    Market Growth Projections

    The Global Gene Therapy Market Industry is projected to experience remarkable growth in the coming years. With an estimated market value of 6.11 USD Billion in 2024, the industry is on a trajectory to reach 46.9 USD Billion by 2035. This growth is underpinned by a compound annual growth rate of 20.36% from 2025 to 2035, reflecting the increasing demand for innovative therapeutic solutions. The expansion is driven by various factors, including advancements in technology, rising prevalence of genetic disorders, and supportive regulatory frameworks. As the market evolves, it is poised to become a cornerstone of modern medicine, offering hope to patients worldwide.

    Expanding Applications of Gene Therapy

    The applications of gene therapy are expanding beyond rare genetic disorders to include more common diseases, such as cancer and cardiovascular conditions. This diversification is a key driver for the Global Gene Therapy Market Industry, as it opens new avenues for treatment and patient populations. For instance, recent studies have demonstrated the efficacy of gene therapy in targeting specific cancer cells, leading to promising clinical outcomes. As the understanding of gene therapy's potential broadens, the market is likely to attract a wider range of stakeholders, contributing to its growth trajectory. The increasing recognition of gene therapy's versatility is expected to play a pivotal role in shaping the industry's future.

    Rising Prevalence of Genetic Disorders

    The Global Gene Therapy Market Industry is witnessing a surge in demand due to the increasing prevalence of genetic disorders. Conditions such as hemophilia, muscular dystrophy, and cystic fibrosis are becoming more common, prompting a need for innovative treatment solutions. For instance, the World Health Organization indicates that genetic disorders affect millions globally, leading to a growing patient population seeking effective therapies. This trend is likely to drive the market's growth, as gene therapy offers potential cures rather than symptomatic treatments. As the industry evolves, the market is projected to reach 6.11 USD Billion in 2024, reflecting the urgent need for advanced therapeutic options.

    Growing Regulatory Support and Approvals

    Regulatory bodies are increasingly supportive of gene therapy advancements, facilitating the approval process for new treatments. The Global Gene Therapy Market Industry benefits from streamlined regulatory pathways, which encourage the development and commercialization of innovative therapies. For instance, the U.S. Food and Drug Administration has introduced expedited review processes for gene therapies, allowing faster access to life-saving treatments for patients. This regulatory environment not only enhances the market's growth potential but also instills confidence among investors and developers. As more therapies gain approval, the market is poised for substantial expansion, reflecting the evolving landscape of gene therapy.

    Advancements in Gene Editing Technologies

    Technological advancements in gene editing tools, such as CRISPR-Cas9 and TALENs, are propelling the Global Gene Therapy Market Industry forward. These innovations enable precise modifications of genetic material, enhancing the efficacy and safety of gene therapies. The ability to target specific genes with high accuracy has led to breakthroughs in treating previously untreatable conditions. As these technologies continue to evolve, they are expected to expand the range of diseases that can be addressed through gene therapy. This momentum is anticipated to contribute to a significant market expansion, with projections indicating a growth to 46.9 USD Billion by 2035.

    Increased Investment in Research and Development

    Investment in research and development is a critical driver of the Global Gene Therapy Market Industry. Governments and private entities are allocating substantial funds to explore novel gene therapies and improve existing ones. For example, the National Institutes of Health has prioritized funding for gene therapy research, recognizing its potential to revolutionize treatment paradigms. This influx of capital fosters innovation, leading to the development of new therapies and clinical trials. As a result, the market is expected to experience a compound annual growth rate of 20.36% from 2025 to 2035, underscoring the importance of sustained investment in this field.

    Market Segment Insights

    Gene Therapy

    Based on Vector Type, this segment includes Viral Vector (Lentiviral Vectors (LVVs), Retrovirus Vectors, Adenoviral Vectors (AdVs) and Adeno-associated Viral Vectors (AAVs)) and Non-Viral Vector (Physical Vector, Chemical Vector). The Viral Vector segment dominated the global market in 2024, while the Non-Viral Vector is projected to be the fastest–growing segment during the forecast period. Among viral vectors, adeno-associated viruses (AAVs) and lentiviral vectors (LVVs) are widely used for their safety profiles and long-term gene expression. 

    Non-viral vectors, including physical methods (like electroporation) and chemical carriers (like lipid nanoparticles), offer lower immunogenicity and easier large-scale manufacturing. The success of lipid nanoparticle-based mRNA vaccines during the COVID-19 pandemic has accelerated interest and innovation in non-viral delivery systems. Additionally, advancements in nanotechnology and material sciences are enhancing the efficiency and targeting capability of non-viral vectors, making them an attractive option for next-generation gene therapies and expanding their potential across various therapeutic areas.

    FIGURE 2: GENE THERAPY MARKET SHARE BY VECTOR TYPE 2024 AND 2035 (USD BILLION)

    Source: Secondary Research, Primary Research, MRFR Database and Analyst Review

    Gene Therapy

    Based on Gene Type, this segment includes Antigen, Cytokine, Tumor Suppressor, Suicide, Deficiency, Growth Factors, Receptors, and Others. The Antigen segment dominated the global market in 2024, while it is projected to be the fastest–growing segment during the forecast period. These therapies have shown remarkable clinical success and have received regulatory approvals, boosting market confidence. Additionally, antigen-based approaches are expanding into other areas such as infectious diseases and autoimmune disorders, supported by advancements in gene delivery technologies and personalized medicine. 

    The segment benefits from a robust pipeline, significant investment, and favorable regulatory designations like orphan drug and breakthrough therapy status, which accelerate development and commercialization. Overall, the antigen segment's ability to deliver targeted, effective, and personalized treatments positions it as a key driver of innovation and growth in the gene therapy landscape.

    Gene Therapy

    Based on Application, this segment includes Oncological Disorders, Rare Diseases, Cardiovascular Diseases, Neurological Disorders, Infectious Diseases, and Others. The Oncological Disorders segment dominated the global market in 2024, while it is projected to be the fastest–growing segment during the forecast period. This is primarily due to the rising global cancer burden and the increasing adoption of gene therapies like CAR-T cell therapy and oncolytic viruses, which offer targeted and effective treatment options. 

    Advances in personalized medicine and immune-based gene therapies have shown significant success in treating hematologic and solid tumors, driving demand. Additionally, strong clinical pipelines, regulatory approvals, and substantial investments in cancer gene therapy research are fueling growth. The high unmet need for more effective cancer treatments and the ability of gene therapy to address previously untreatable cancers further strengthen this segment’s market position.

    Gene Therapy

    Based on the Delivery Method, this segment includes In Vivo Gene Therapy and Ex Vivo Gene Therapy. The In Vivo Gene Therapy segment dominated the global market in 2024, while it is projected to be the fastest–growing segment during the forecast period. This method involves directly delivering genetic material into a patient’s body, allowing for simpler, less invasive procedures compared to Ex Vivo approaches. In Vivo therapies are particularly effective for treating genetic and rare diseases, especially those affecting the liver, muscles, and central nervous system. 

    The rise of adeno-associated viral (AAV) vectors and lipid nanoparticles has improved the safety and precision of in vivo delivery. Additionally, reduced complexity, lower treatment costs, and faster clinical translation are driving increased adoption. Growing research investments and successful clinical trials continue to accelerate development in this segment.

    Get more detailed insights about Gene Therapy Market Research Report – Forecast Till 2035

    Regional Insights

    Based on the Region, the global Gene Therapy is segmented into North America, Europe, Asia-Pacific and Rest of the World. Major demand factors driving the North America market are the growing incidences and prevalence of cancer and rare disorders and increasing approval for gene therapy products and favourable government support for gene therapy. Additionally, the availability of reimbursements and insurance coverage is making gene therapies more accessible to patients. Increased healthcare expenditure and investment in research and development are further fueling market expansion. 

    Supportive regulatory frameworks and incentives are streamlining the approval process, while strategic partnerships and collaborations are accelerating innovation. The pipeline of gene therapy drugs includes a wide range of treatments for various genetic and acquired diseases, such as rare genetic disorders, cancer, and autoimmune diseases. The potential of these drugs to provide targeted and personalized treatments for patients with complex medical conditions has generated significant interest from biopharmaceutical companies, investors, and healthcare providers.

    The competitive landscape features established players who have adopted strategies such as acquisition, agreement, strategic alliance, collaboration, clinical trial, expansion, joint venture, new product development, and product approval to expand their product portfolio.

    FIGURE 3: GENE THERAPY MARKET VALUE BY REGION 2024 AND 2035 (USD BILLION)

     GENE THERAPY MARKET VALUE BY REGION 2024 AND 2035

    Source: Secondary Research, Primary Research, MRFR Database, and Analyst Review

    Further, the countries considered in the scope of the Application Tracking System Market are the US, Canada, Germany, France, the UK, Italy, Spain, China, India, Japan, South Korea, Australia, Middle East & Africa, South America and others.

    Key Players and Competitive Insights

    Many global, regional, and local vendors characterize the Gene Therapy Market. The market is highly competitive, with all the players competing to gain market share. Intense competition, rapid advances in technology, frequent changes in government policies, and environmental regulations are key factors that confront market growth. The vendors compete based on cost, product quality, reliability, and government regulations. Vendors must provide cost-efficient, high-quality products to survive and succeed in an intensely competitive market.

    The major competitors in the market are Bristol-Myers Squibb Company, Lonza, UniQure N.V., Bluebird Bio, Inc., Orchard Therapeutics Plc, GenSight Biologics, Novartis AG, Amgen Inc., Sarepta Therapeutics Inc., Spark Therapeutics, Inc., are among others. The Gene Therapy Market is a consolidated market due to increasing competition, acquisitions, mergers and other strategic market developments and decisions to improve operational effectiveness.

    Key Companies in the Gene Therapy Market market include

    Industry Developments

    January 2024: Novartis AG has entered into a strategic partnership with Voyager Therapeutics, Inc., which includes an exclusive license for Voyager's TRACER capsids and related intellectual property. This collaboration will focus on developing a preclinical gene therapy candidate for Huntington's Disease (HD).

    October 2023: SpliceBio, a genetic medicines company specializing in Protein Splicing to advance gene therapies, has announced an exclusive collaboration and licensing agreement with Spark Therapeutics. This partnership will leverage SpliceBio's proprietary Protein Splicing platform to develop a gene therapy for an undisclosed inherited retinal disease.

    December 2023: Bluebird bio, Inc. (US) received an approval from US Food Drug and Administration for Lyfgenia representing the first cell-based gene therapies for the treatment of sickle cell disease (SCD) in patients 12 years and older.

    September 2021: GenSight Biologics announced that the UK's Medicines and Healthcare Products Regulatory Agency (MHRA) has designated its gene therapy LUMEVOQ as a Promising Innovative Medicine (PIM) for the treatment of vision loss caused by Leber Hereditary Optic Neuropathy (LHON), which is caused by a confirmed G11778A mutation in the ND4 mitochondrial gene.

    Gene Therapy Market Segmentation

    Gene Therapy by Vector Type Outlook

    • Viral Vector
      • Lentiviral Vectors (LVVs)
      • Retrovirus Vectors
      • Adenoviral Vectors (AdVs)
      • Adeno-associated Viral Vectors (AAVs)
    • Non-Viral Vector
      • Physical Vector
      • Chemical Vector

    Gene Therapy by Gene Type Outlook

    • Antigen
    • Cytokine
    • Tumor Suppressor
    • Suicide
    • Deficiency
    • Growth Factors
    • Receptors
    • Others

    Gene Therapy by Application Outlook

    • Oncological Disorders
    • Rare Diseases
    • Cardiovascular Diseases
    • Neurological Disorders
    • Infectious Diseas
    • Others

    Gene Therapy by Delivery Method Outlook

    • In Vivo Gene Therapy
    • Ex Vivo Gene Therapy

    Gene Therapy Regional Outlook

    • North America
      • US
      • Canada
    • Europe
      • Germany
      • France
      • UK
      • Italy
      • Spain
      • Rest of Europe
    • Asia-Pacific
      • China
      • India
      • Japan
      • South Korea
      • Australia
      • Rest of Asia-Pacific
    • Rest of the world
      • Middle East & Africa
      • South America

    Future Outlook

    Gene Therapy Market Future Outlook

    The Global Gene Therapy Market is poised for robust growth at a 19.04% CAGR from 2025 to 2035, driven by advancements in technology, increasing investment, and rising prevalence of genetic disorders.

    New opportunities lie in:

    • Develop targeted gene therapies for rare diseases to capture niche markets.
    • Invest in CRISPR technology to enhance precision and efficacy of treatments.
    • Form strategic partnerships with biotech firms to accelerate product development and market entry.

    By 2035, the Gene Therapy Market is expected to achieve substantial growth, reflecting its critical role in modern medicine.

    Market Segmentation

    Regional Outlook

    • US
    • Canada

    Gene Therapy Regional Outlook

    • US
    • Canada

    Gene Therapy by Gene Type Outlook

    • Antigen
    • Cytokine
    • Tumor Suppressor
    • Suicide
    • Deficiency
    • Growth Factors
    • Receptors
    • Others

    Gene Therapy by Application Outlook

    • Oncological Disorders
    • Rare Diseases
    • Cardiovascular Diseases
    • Neurological Disorders
    • Infectious Diseas
    • Others

    Gene Therapy by Vector Type Outlook

    • Lentiviral Vectors (LVVs)
    • Retrovirus Vectors
    • Adenoviral Vectors (AdVs)
    • Adeno-associated Viral Vectors (AAVs)

    Gene Therapy by Delivery Method Outlook

    • In Vivo Gene Therapy
    • Ex Vivo Gene Therapy

    Report Scope

    Report Attribute/Metric Details
    Market Size 2024 USD 6.11 Billion
    Market Size 2025 USD 7.24 Billion
    Market Size 2035 41.63
    Compound Annual Growth Rate (CAGR) 19.04% (2025 - 2035)
    Base Year 2024
    Forecast Period 2025 - 2035
    Historical Data 2019-2023
    Forecast Units Value (USD Billion)
    Report Coverage Revenue Forecast, Competitive Landscape, Growth Factors, and Trends
    Segments Covered By Vector Type, By Gene Type, By Application, By Delivery Method
    Geographies Covered North America, Europe, Asia Pacific, Rest of the World
    Countries Covered The US, Canada, Germany, France, the UK, Italy, Spain, China, India, Japan, South Korea, Australia, Middle East & Africa, South America
    Key Companies Profiled Bristol-Myers Squibb Company, Lonza, UniQure N.V., Bluebird Bio, Inc., Orchard Therapeutics Plc, GenSight Biologics, Novartis AG, Amgen Inc., Sarepta Therapeutics Inc., Spark Therapeutics, Inc.
    Key Market Opportunities ·         Growing investment in the field of gene therapy ·         Ongoing clinical trials associated with gene therapy
    Key Market Dynamics ·         Growing incidences and prevalence of cancer and rare disorders ·         Increasing approval for gene therapy products ·         Favourable government support for gene therapy

    Market Highlights

    Author

    Rahul Gotadki
    Assistant Manager

    She holds an experience of about 6+ years in market research and business consulting, working under the spectrum of information communication technology, telecommunications and semiconductor domains. aarti conceptualizes and implements a scalable business strategy and provides strategic leadership to the clients. her expertise lies in market estimation, competitive intelligence, pipeline analysis, customer assessment, etc.

    Leave a Comment

    Latest Comments

    John Doe
    john@example.com

    This is a great article! Really helped me understand the topic better.

    Posted on July 23, 2025, 10:15 AM
    Jane Smith
    jane@domain.com

    Thanks for sharing this. I’ve bookmarked it for later reference.

    Posted on July 22, 2025, 7:45 PM

    FAQs

    What is the projected growth of the Gene Therapy market?

    The Gene Therapy market is the expected increase in total market value of 41.63 USD billion over a defined forecast period 2025–2035. It is driven by factors such as demand trends, technological advances, regulatory changes, and geographic expansion.

    What is the size of the Gene Therapy market?

    Gene Therapy market size was valued at approximately 6.12 billion USD in 2024. This figure will reach 41.63 billion USD covering all regions (America, Europe, Asia, MEA and ROW), focusing its segments / services / distribution channels till 2035.

    What is the CAGR of the Gene Therapy market?

    Gene Therapy market is expected to grow at a CAGR of 19.04% between 2025 and 2035.

    How much will the Gene Therapy market be worth by 2035?

    Gene Therapy market is expected to be worth of 41.63 billion USD, reflecting growth driven by usage, technology and global demands by the end of 2035.

    How will the Gene Therapy market perform over the next 10 years?

    Over the next 10 years the Gene Therapy market is expected to shift from usd billion 6.12 to 41.63 billion USD, led by adoption of advanced tech, demographic trends, regulatory approvals, with potential headwinds from 2025 to 2035.

    1. Table of Contents
    2. Executive Summary
    3. Market Introduction
      1. DEFINITION
      2. Scope of the Study
      3. RESEARCH OBJECTIVE
      4. MARKET STRUCTURE
    4. Research Methodology
      1. OVERVIEW
      2. DATA FLOW
        1. DATA MINING PROCESS
      3. PURCHASED DATABASE:
      4. SECONDARY SOURCES:
        1. SECONDARY RESEARCH DATA FLOW:
      5. PRIMARY RESEARCH:
        1. PRIMARY RESEARCH DATA FLOW:
      6. APPROACHES FOR MARKET SIZE ESTIMATION:
        1. REVENUE ANALYSIS APPROACH
      7. DATA FORECASTING
        1. DATA FORECASTING TYPE
      8. DATA MODELING
        1. MICROECONOMIC FACTOR ANALYSIS:
        2. DATA MODELING:
      9. TEAMS AND ANALYST CONTRIBUTION
    5. MARKET DYNAMICS
      1. INTRODUCTION
      2. DRIVERS
        1. GROWING INCIDENCES AND PREVALENCE OF CANCER AND RARE DISORDERS
        2. INCREASING APPROVAL FOR GENE THERAPY PRODUCTS
        3. FAVOURABLE GOVERNMENT SUPPORT FOR GENE THERAPY
      3. RESTRAINTS
        1. CLINICAL TRIAL FAILURE ASSOCIATED WITH GENE THERAPY
        2. CHALLENGES ASSOCIATED WITH GENE THERAPY DELIVERY
      4. OPPORTUNITY
        1. GROWING INVESTMENT IN THE FIELD OF GENE THERAPY
        2. ONGOING CLINICAL TRIALS ASSOCIATED WITH GENE THERAPY
    6. MARKET FACTOR ANALYSIS
      1. PORTER'S FIVE FORCES MODEL
        1. THREAT OF NEW ENTRANTS
        2. BARGAINING POWER OF SUPPLIERS
        3. THREAT OF SUBSTITUTES
        4. BARGAINING POWER OF BUYERS
        5. INTENSITY OF RIVALRY
      2. IMPACT OF COVID-19 ON THE GLOBAL GENE THERAPY MARKET
    7. GLOBAL GENE THERAPY MARKET, BY VECTOR TYPE
      1. OVERVIEW
      2. VIRAL VECTOR
        1. LENTIVIRAL VECTORS (LVVS)
        2. RETROVIRUS VECTORS
        3. ADENOVIRAL VECTORS (ADVS)
        4. ADENO-ASSOCIATED VIRAL VECTORS (AAVS)
      3. NON-VIRAL VECTOR
        1. PHYSICAL VECTOR
        2. CHEMICAL VECTOR
    8. GLOBAL GENE THERAPY MARKET, BY GENE TYPE
      1. OVERVIEW
      2. ANTIGEN
      3. CYTOKINE
      4. TUMOR SUPPRESSOR
      5. SUICIDE
      6. DEFICIENCY
      7. GROWTH FACTORS
      8. RECEPTORS
      9. OTHERS
    9. GLOBAL GENE THERAPY MARKET, BY APPLICATION
      1. OVERVIEW
      2. ONCOLOGICAL DISORDERS
      3. RARE DISEASES
      4. CARDIOVASCULAR DISEASES
      5. NEUROLOGICAL DISORDERS
      6. INFECTIOUS DISEASES
      7. OTHERS
    10. GLOBAL GENE THERAPY MARKET, BY DELIVERY METHOD
      1. OVERVIEW
      2. IN VIVO GENE THERAPY
      3. EX VIVO GENE THERAPY
    11. GLOBAL GENE THERAPY MARKET, BY REGION
      1. OVERVIEW
      2. NORTH AMERICA
        1. US
        2. CANADA
      3. EUROPE
        1. GERMANY
        2. FRANCE
        3. UK
        4. ITALY
        5. SPAIN
        6. REST OF EUROPE
      4. ASIA-PACIFIC
        1. CHINA
        2. INDIA
        3. JAPAN
        4. SOUTH KOREA
        5. AUSTRALIA
        6. REST OF ASIA-PACIFIC
      5. REST OF THE WORLD
        1. MIDDLE EAST & AFRICA
        2. SOUTH AMERICA
    12. Competitive Landscape
      1. INTRODUCTION
      2. MARKET SHARE ANALYSIS, 2024
      3. COMPETITOR DASHBOARD
      4. PUBLIC PLAYERS STOCK SUMMARY
      5. COMPARATIVE ANALYSIS: KEY PLAYERS FINANICAL
      6. KEY DEVELOPMENTS & GROWTH STRATEGIES
        1. PRODUCT APPROVAL/ PRODUCT LAUNCH
        2. ACQUISITION/ EXPANSION
        3. AGREEMENT/PARTNERSHIP/COLLABORATION
    13. COMPANY PROFILES
      1. BRISTOL-MYERS SQUIBB COMPANY
        1. COMPANY OVERVIEW
        2. FINANCIAL OVERVIEW
        3. PRODUCTS OFFERED
        4. KEY DEVELOPMENTS
        5. SWOT ANALYSIS
        6. KEY STRATEGIES
      2. LONZA
        1. COMPANY OVERVIEW
        2. FINANCIAL OVERVIEW
        3. PRODUCT OFFERED
        4. KEY DEVELOPMENTS
        5. SWOT ANALYSIS
        6. KEY STRATEGIES
      3. UNIQURE N.V.
        1. COMPANY OVERVIEW
        2. FINANCIAL OVERVIEW
        3. PRODUCTS OFFERED
        4. KEY DEVELOPMENTS
        5. SWOT ANALYSIS
        6. KEY STRATEGIES
      4. BLUEBIRD BIO, INC.
        1. COMPANY OVERVIEW
        2. PRODUCTS OFFERED
        3. KEY DEVELOPMENTS
        4. KEY STRATEGIES
      5. ORCHARD THERAPEUTICS PLC
        1. COMPANY OVERVIEW
        2. FINANCIAL OVERVIEW
        3. PRODUCTS OFFERED
        4. KEY DEVELOPMENTS
        5. KEY STRATEGIES
      6. GENSIGHT BIOLOGICS
        1. COMPANY OVERVIEW
        2. PRODUCTS OFFERED
        3. KEY DEVELOPMENTS
        4. KEY STRATEGIES
      7. NOVARTIS AG
        1. COMPANY OVERVIEW
        2. FINANCIAL OVERVIEW
        3. PRODUCTS OFFERED
        4. KEY DEVELOPMENTS
        5. SWOT ANALYSIS
        6. KEY STRATEGIES
      8. AMGEN INC.
        1. COMPANY OVERVIEW
        2. FINANCIAL OVERVIEW
        3. PRODUCTS OFFERED
        4. KEY DEVELOPMENTS
        5. SWOT ANALYSIS
        6. KEY STRATEGIES
      9. SAREPTA THERAPEUTICS INC.
        1. COMPANY OVERVIEW
        2. FINANCIAL OVERVIEW
        3. PRODUCT OFFERED
        4. KEY DEVELOPMENTS
        5. KEY STRATEGIES
      10. SPARK THERAPEUTICS, INC.
        1. COMPANY OVERVIEW
        2. FINANCIAL OVERVIEW
        3. PRODUCTS OFFERED
        4. KEY DEVELOPMENTS
        5. KEY STRATEGIES
      11. DATA CITATIONS            
    14. List of Tables and Figures
      1. LIST OF TABLES
      2. TABLE 1 QFD MODELING FOR MARKET SHARE ASSESSMENT
      3. TABLE 2 GLOBAL GENE THERAPY MARKET, BY VECTOR TYPE, 2019–2035 (USD BILLION)
      4. TABLE 3 GLOBAL GENE THERAPY MARKET, FOR VIRAL VECTOR, BY REGION, 2019–2035 (USD BILLION)
      5. TABLE 4 GLOBAL GENE THERAPY MARKET, FOR VIRAL VECTOR, BY TYPE, 2019–2035 (USD BILLION)
      6. TABLE 5 GLOBAL GENE THERAPY MARKET, FOR LENTIVIRAL VECTORS (LVVS), BY REGION, 2019–2035 (USD BILLION)
      7. TABLE 6 GLOBAL GENE THERAPY MARKET, FOR RETROVIRUS VECTORS, BY REGION, 2019–2035 (USD BILLION)
      8. TABLE 7 GLOBAL GENE THERAPY MARKET, FOR ADENOVIRAL VECTORS (ADVS), BY REGION, 2019–2035 (USD BILLION)
      9. TABLE 8 GLOBAL GENE THERAPY MARKET, FOR ADENO-ASSOCIATED VIRAL VECTORS (AAVS), BY REGION, 2019–2035 (USD BILLION)
      10. TABLE 9 GLOBAL GENE THERAPY MARKET, FOR NON-VIRAL VECTOR, BY REGION, 2019–2035 (USD BILLION)
      11. TABLE 10 GLOBAL GENE THERAPY MARKET, FOR NON- VIRAL VECTORS, BY TYPE, 2019–2035 (USD BILLION)
      12. TABLE 11 GLOBAL GENE THERAPY MARKET, FOR PHYSICAL VECTOR, BY REGION, 2019–2035 (USD BILLION)
      13. TABLE 12 GLOBAL GENE THERAPY MARKET, FOR CHEMICAL VECTOR, BY REGION, 2019–2035 (USD BILLION)
      14. TABLE 13 GLOBAL GENE THERAPY MARKET, BY GENE TYPE, 2019–2035 (USD BILLION)
      15. TABLE 14 GLOBAL GENE THERAPY MARKET, FOR ANTIGEN, BY REGION, 2019–2035 (USD BILLION)
      16. TABLE 15 GLOBAL GENE THERAPY MARKET, FOR CYTOKINE, BY REGION, 2019–2035 (USD BILLION)
      17. TABLE 16 GLOBAL GENE THERAPY MARKET, FOR TUMOR SUPPRESSOR, BY REGION, 2019–2035 (USD BILLION)
      18. TABLE 17 GLOBAL GENE THERAPY MARKET, FOR SUICIDE, BY REGION, 2019–2035 (USD BILLION)
      19. TABLE 18 GLOBAL GENE THERAPY MARKET, FOR DEFICIENCY, BY REGION, 2019–2035 (USD BILLION)
      20. TABLE 19 GLOBAL GENE THERAPY MARKET, FOR GROWTH FACTORS, BY REGION, 2019–2035 (USD BILLION)
      21. TABLE 20 GLOBAL GENE THERAPY MARKET, FOR RECEPTORS, BY REGION, 2019–2035 (USD BILLION)
      22. TABLE 21 GLOBAL GENE THERAPY MARKET, FOR OTHERS, BY REGION, 2019–2035 (USD BILLION)
      23. TABLE 22 GLOBAL GENE THERAPY MARKET, BY APPLICATION, 2019–2035 (USD BILLION)
      24. TABLE 23 GLOBAL GENE THERAPY MARKET, FOR ONCOLOGICAL DISORDERS, BY REGION, 2019–2035 (USD BILLION)
      25. TABLE 24 GLOBAL GENE THERAPY MARKET, FOR RARE DISEASES, BY REGION, 2019–2035 (USD BILLION)
      26. TABLE 25 GLOBAL GENE THERAPY MARKET, FOR CARDIOVASCULAR DISEASES, BY REGION, 2019–2035 (USD BILLION)
      27. TABLE 26 GLOBAL GENE THERAPY MARKET, FOR NEUROLOGICAL DISORDERS, BY REGION, 2019–2035 (USD BILLION)
      28. TABLE 27 GLOBAL GENE THERAPY MARKET, FOR INFECTIOUS DISEASES, BY REGION, 2019–2035 (USD BILLION)
      29. TABLE 28 GLOBAL GENE THERAPY MARKET, FOR OTHERS, BY REGION, 2019–2035 (USD BILLION)
      30. TABLE 29 GLOBAL GENE THERAPY MARKET, BY DELIVERY METHOD, 2019–2035 (USD BILLION)
      31. TABLE 30 GLOBAL GENE THERAPY MARKET, FOR IN VIVO GENE THERAPY, BY REGION, 2019–2035 (USD BILLION)
      32. TABLE 31 GLOBAL GENE THERAPY MARKET, FOR EX VIVO GENE THERAPY, BY REGION, 2019–2035 (USD BILLION)
      33. TABLE 32 GLOBAL GENE THERAPY MARKET, BY REGION, 2019–2035 (USD BILLION)
      34. TABLE 33 NORTH AMERICA: GENE THERAPY MARKET, BY COUNTRY, 2019–2035 (USD BILLION)
      35. TABLE 34 NORTH AMERICA: GENE THERAPY MARKET, BY VECTOR TYPE, 2019–2035 (USD BILLION)
      36. TABLE 35 NORTH AMERICA: GENE THERAPY MARKET, FOR VIRAL VECTOR, BY TYPE, 2019–2035 (USD BILLION)
      37. TABLE 36 NORTH AMERICA: GENE THERAPY MARKET, FOR NON-VIRAL VECTOR, BY TYPE, 2019–2035 (USD BILLION)
      38. TABLE 37 NORTH AMERICA: GENE THERAPY MARKET, BY GENE TYPE, 2019–2035 (USD BILLION)
      39. TABLE 38 NORTH AMERICA: GENE THERAPY MARKET, BY APPLICATION, 2019–2035 (USD BILLION)
      40. TABLE 39 NORTH AMERICA: GENE THERAPY MARKET, BY DELIVERY METHOD, 2019–2035 (USD BILLION)
      41. TABLE 40 US: GENE THERAPY MARKET, BY VECTOR TYPE, 2019–2035 (USD BILLION)
      42. TABLE 41 US: GENE THERAPY MARKET, FOR VIRAL VECTOR, BY TYPE, 2019–2035 (USD BILLION)
      43. TABLE 42 US: GENE THERAPY MARKET, FOR NON-VIRAL VECTOR, BY TYPE, 2019–2035 (USD BILLION)
      44. TABLE 43 US: GENE THERAPY MARKET, BY GENE TYPE, 2019–2035 (USD BILLION)
      45. TABLE 44 US: GENE THERAPY MARKET, BY APPLICATION, 2019–2035 (USD BILLION)
      46. TABLE 45 US: GENE THERAPY MARKET, BY DELIVERY METHOD, 2019–2035 (USD BILLION)
      47. TABLE 46 CANADA: GENE THERAPY MARKET, BY VECTOR TYPE, 2019–2035 (USD BILLION)
      48. TABLE 47 CANADA: GENE THERAPY MARKET, FOR VIRAL VECTOR, BY TYPE, 2019–2035 (USD BILLION)
      49. TABLE 48 CANADA: GENE THERAPY MARKET, FOR NON-VIRAL VECTOR, BY TYPE, 2019–2035 (USD BILLION)
      50. TABLE 49 CANADA: GENE THERAPY MARKET, BY GENE TYPE, 2019–2035 (USD BILLION)
      51. TABLE 50 CANADA: GENE THERAPY MARKET, BY APPLICATION, 2019–2035 (USD BILLION)
      52. TABLE 51 CANADA: GENE THERAPY MARKET, BY DELIVERY METHOD, 2019–2035 (USD BILLION)
      53. TABLE 52 EUROPE: GENE THERAPY MARKET, BY COUNTRY, 2019–2035 (USD BILLION)
      54. TABLE 53 EUROPE: GENE THERAPY MARKET, BY VECTOR TYPE, 2019–2035 (USD BILLION)
      55. TABLE 54 EUROPE: GENE THERAPY MARKET, FOR VIRAL VECTOR, BY TYPE, 2019–2035 (USD BILLION)
      56. TABLE 55 EUROPE: GENE THERAPY MARKET, FOR NON-VIRAL VECTOR, BY TYPE, 2019–2035 (USD BILLION)
      57. TABLE 56 EUROPE: GENE THERAPY MARKET, BY GENE TYPE, 2019–2035 (USD BILLION)
      58. TABLE 57 EUROPE: GENE THERAPY MARKET, BY APPLICATION, 2019–2035 (USD BILLION)
      59. TABLE 58 EUROPE: GENE THERAPY MARKET, BY DELIVERY METHOD, 2019–2035 (USD BILLION)
      60. TABLE 59 GERMANY: GENE THERAPY MARKET, BY VECTOR TYPE, 2019–2035 (USD BILLION)
      61. TABLE 60 GERMANY: GENE THERAPY MARKET, FOR VIRAL VECTOR, BY TYPE, 2019–2035 (USD BILLION)
      62. TABLE 61 GERMANY: GENE THERAPY MARKET, FOR NON-VIRAL VECTOR, BY TYPE, 2019–2035 (USD BILLION)
      63. TABLE 62 GERMANY: GENE THERAPY MARKET, BY GENE TYPE, 2019–2035 (USD BILLION)
      64. TABLE 63 GERMANY: GENE THERAPY MARKET, BY APPLICATION, 2019–2035 (USD BILLION)
      65. TABLE 64 GERMANY: GENE THERAPY MARKET, BY DELIVERY METHOD, 2019–2035 (USD BILLION)
      66. TABLE 65 FRANCE: GENE THERAPY MARKET, BY VECTOR TYPE, 2019–2035 (USD BILLION)
      67. TABLE 66 FRANCE: GENE THERAPY MARKET, FOR VIRAL VECTOR, BY TYPE, 2019–2035 (USD BILLION)
      68. TABLE 67 FRANCE: GENE THERAPY MARKET, FOR NON-VIRAL VECTOR, BY TYPE, 2019–2035 (USD BILLION)
      69. TABLE 68 FRANCE: GENE THERAPY MARKET, BY GENE TYPE, 2019–2035 (USD BILLION)
      70. TABLE 69 FRANCE: GENE THERAPY MARKET, BY APPLICATION, 2019–2035 (USD BILLION)
      71. TABLE 70 FRANCE: GENE THERAPY MARKET, BY DELIVERY METHOD, 2019–2035 (USD BILLION)
      72. TABLE 71 UK: GENE THERAPY MARKET, BY VECTOR TYPE, 2019–2035 (USD BILLION)
      73. TABLE 72 UK: GENE THERAPY MARKET, FOR VIRAL VECTOR, BY TYPE, 2019–2035 (USD BILLION)
      74. TABLE 73 UK: GENE THERAPY MARKET, FOR NON-VIRAL VECTOR, BY TYPE, 2019–2035 (USD BILLION)
      75. TABLE 74 UK: GENE THERAPY MARKET, BY GENE TYPE, 2019–2035 (USD BILLION)
      76. TABLE 75 UK: GENE THERAPY MARKET, BY APPLICATION, 2019–2035 (USD BILLION)
      77. TABLE 76 UK: GENE THERAPY MARKET, BY DELIVERY METHOD, 2019–2035 (USD BILLION)
      78. TABLE 77 ITALY: GENE THERAPY MARKET, BY VECTOR TYPE, 2019–2035 (USD BILLION)
      79. TABLE 78 ITALY: GENE THERAPY MARKET, FOR VIRAL VECTOR, BY TYPE, 2019–2035 (USD BILLION)
      80. TABLE 79 ITALY: GENE THERAPY MARKET, FOR NON-VIRAL VECTOR, BY TYPE, 2019–2035 (USD BILLION)
      81. TABLE 80 ITALY: GENE THERAPY MARKET, BY GENE TYPE, 2019–2035 (USD BILLION)
      82. TABLE 81 ITALY: GENE THERAPY MARKET, BY APPLICATION, 2019–2035 (USD BILLION)
      83. TABLE 82 ITALY: GENE THERAPY MARKET, BY DELIVERY METHOD, 2019–2035 (USD BILLION)
      84. TABLE 83 SPAIN: GENE THERAPY MARKET, BY VECTOR TYPE, 2019–2035 (USD BILLION)
      85. TABLE 84 SPAIN: GENE THERAPY MARKET, FOR VIRAL VECTOR, BY TYPE, 2019–2035 (USD BILLION)
      86. TABLE 85 SPAIN: GENE THERAPY MARKET, FOR NON-VIRAL VECTOR, BY TYPE, 2019–2035 (USD BILLION)
      87. TABLE 86 SPAIN: GENE THERAPY MARKET, BY GENE TYPE, 2019–2035 (USD BILLION)
      88. TABLE 87 SPAIN: GENE THERAPY MARKET, BY APPLICATION, 2019–2035 (USD BILLION)
      89. TABLE 88 SPAIN: GENE THERAPY MARKET, BY DELIVERY METHOD, 2019–2035 (USD BILLION)
      90. TABLE 89 REST OF EUROPE: GENE THERAPY MARKET, BY VECTOR TYPE, 2019–2035 (USD BILLION)
      91. TABLE 90 REST OF EUROPE: GENE THERAPY MARKET, FOR VIRAL VECTOR, BY TYPE, 2019–2035 (USD BILLION)
      92. TABLE 91 REST OF EUROPE: GENE THERAPY MARKET, FOR NON-VIRAL VECTOR, BY TYPE, 2019–2035 (USD BILLION)
      93. TABLE 92 REST OF EUROPE: GENE THERAPY MARKET, BY GENE TYPE, 2019–2035 (USD BILLION)
      94. TABLE 93 REST OF EUROPE: GENE THERAPY MARKET, BY APPLICATION, 2019–2035 (USD BILLION)
      95. TABLE 94 REST OF EUROPE: GENE THERAPY MARKET, BY DELIVERY METHOD, 2019–2035 (USD BILLION)
      96. TABLE 95 ASIA-PACIFIC: GENE THERAPY MARKET, BY COUNTRY, 2019–2035 (USD BILLION)
      97. TABLE 96 ASIA-PACIFIC: GENE THERAPY MARKET, BY VECTOR TYPE, 2019–2035 (USD BILLION)
      98. TABLE 97 ASIA-PACIFIC: GENE THERAPY MARKET, FOR VIRAL VECTOR, BY TYPE, 2019–2035 (USD BILLION)
      99. TABLE 98 ASIA-PACIFIC: GENE THERAPY MARKET, FOR NON-VIRAL VECTOR, BY TYPE, 2019–2035 (USD BILLION)
      100. TABLE 99 ASIA-PACIFIC: GENE THERAPY MARKET, BY GENE TYPE, 2019–2035 (USD BILLION)
      101. TABLE 100 ASIA-PACIFIC: GENE THERAPY MARKET, BY APPLICATION, 2019–2035 (USD BILLION)
      102. TABLE 101 ASIA-PACIFIC: GENE THERAPY MARKET, BY DELIVERY METHOD, 2019–2035 (USD BILLION)
      103. TABLE 102 CHINA: GENE THERAPY MARKET, BY VECTOR TYPE, 2019–2035 (USD BILLION)
      104. TABLE 103 CHINA: GENE THERAPY MARKET, FOR VIRAL VECTOR, BY TYPE, 2019–2035 (USD BILLION)
      105. TABLE 104 CHINA: GENE THERAPY MARKET, FOR NON-VIRAL VECTOR, BY TYPE, 2019–2035 (USD BILLION)
      106. TABLE 105 CHINA: GENE THERAPY MARKET, BY GENE TYPE, 2019–2035 (USD BILLION)
      107. TABLE 106 CHINA: GENE THERAPY MARKET, BY APPLICATION, 2019–2035 (USD BILLION)
      108. TABLE 107 CHINA: GENE THERAPY MARKET, BY DELIVERY METHOD, 2019–2035 (USD BILLION)
      109. TABLE 108 INDIA: GENE THERAPY MARKET, BY VECTOR TYPE, 2019–2035 (USD BILLION)
      110. TABLE 109 INDIA: GENE THERAPY MARKET, FOR VIRAL VECTOR, BY TYPE, 2019–2035 (USD BILLION)
      111. TABLE 110 INDIA: GENE THERAPY MARKET, FOR NON-VIRAL VECTOR, BY TYPE, 2019–2035 (USD BILLION)
      112. TABLE 111 INDIA: GENE THERAPY MARKET, BY GENE TYPE, 2019–2035 (USD BILLION)
      113. TABLE 112 INDIA: GENE THERAPY MARKET, BY APPLICATION, 2019–2035 (USD BILLION)
      114. TABLE 113 INDIA: GENE THERAPY MARKET, BY DELIVERY METHOD, 2019–2035 (USD BILLION)
      115. TABLE 114 JAPAN: GENE THERAPY MARKET, BY VECTOR TYPE, 2019–2035 (USD BILLION)
      116. TABLE 115 JAPAN: GENE THERAPY MARKET, FOR VIRAL VECTOR, BY TYPE, 2019–2035 (USD BILLION)
      117. TABLE 116 JAPAN: GENE THERAPY MARKET, FOR NON-VIRAL VECTOR, BY TYPE, 2019–2035 (USD BILLION)
      118. TABLE 117 JAPAN: GENE THERAPY MARKET, BY GENE TYPE, 2019–2035 (USD BILLION)
      119. TABLE 118 JAPAN: GENE THERAPY MARKET, BY APPLICATION, 2019–2035 (USD BILLION)
      120. TABLE 119 JAPAN: GENE THERAPY MARKET, BY DELIVERY METHOD, 2019–2035 (USD BILLION)
      121. TABLE 120 SOUTH KOREA: GENE THERAPY MARKET, BY VECTOR TYPE, 2019–2035 (USD BILLION)
      122. TABLE 121 SOUTH KOREA: GENE THERAPY MARKET, FOR VIRAL VECTOR, BY TYPE, 2019–2035 (USD BILLION)
      123. TABLE 122 SOUTH KOREA: GENE THERAPY MARKET, FOR NON-VIRAL VECTOR, BY TYPE, 2019–2035 (USD BILLION)
      124. TABLE 123 SOUTH KOREA: GENE THERAPY MARKET, BY GENE TYPE, 2019–2035 (USD BILLION)
      125. TABLE 124 SOUTH KOREA: GENE THERAPY MARKET, BY APPLICATION, 2019–2035 (USD BILLION)
      126. TABLE 125 SOUTH KOREA: GENE THERAPY MARKET, BY DELIVERY METHOD, 2019–2035 (USD BILLION)
      127. TABLE 126 AUSTRALIA: GENE THERAPY MARKET, BY VECTOR TYPE, 2019–2035 (USD BILLION)
      128. TABLE 127 AUSTRALIA: GENE THERAPY MARKET, FOR VIRAL VECTOR, BY TYPE, 2019–2035 (USD BILLION)
      129. TABLE 128 AUSTRALIA: GENE THERAPY MARKET, FOR NON-VIRAL VECTOR, BY TYPE, 2019–2035 (USD BILLION)
      130. TABLE 129 AUSTRALIA: GENE THERAPY MARKET, BY GENE TYPE, 2019–2035 (USD BILLION)
      131. TABLE 130 AUSTRALIA: GENE THERAPY MARKET, BY APPLICATION, 2019–2035 (USD BILLION)
      132. TABLE 131 AUSTRALIA: GENE THERAPY MARKET, BY DELIVERY METHOD, 2019–2035 (USD BILLION)
      133. TABLE 132 REST OF ASIA-PACIFIC: GENE THERAPY MARKET, BY VECTOR TYPE, 2019–2035 (USD BILLION)
      134. TABLE 133 REST OF ASIA-PACIFIC: GENE THERAPY MARKET, FOR VIRAL VECTOR, BY TYPE, 2019–2035 (USD BILLION)
      135. TABLE 134 REST OF ASIA-PACIFIC: GENE THERAPY MARKET, FOR NON-VIRAL VECTOR, BY TYPE, 2019–2035 (USD BILLION)
      136. TABLE 135 REST OF ASIA-PACIFIC: GENE THERAPY MARKET, BY GENE TYPE, 2019–2035 (USD BILLION)
      137. TABLE 136 REST OF ASIA-PACIFIC: GENE THERAPY MARKET, BY APPLICATION, 2019–2035 (USD BILLION)
      138. TABLE 137 REST OF ASIA-PACIFIC: GENE THERAPY MARKET, BY DELIVERY METHOD, 2019–2035 (USD BILLION)
      139. TABLE 138 REST OF THE WORLD: GENE THERAPY MARKET, BY COUNTRY, 2019–2035 (USD BILLION)
      140. TABLE 139 REST OF THE WORLD: GENE THERAPY MARKET, BY VECTOR TYPE, 2019–2035 (USD BILLION)
      141. TABLE 140 REST OF THE WORLD: GENE THERAPY MARKET, FOR VIRAL VECTOR, BY TYPE, 2019–2035 (USD BILLION)
      142. TABLE 141 REST OF THE WORLD: GENE THERAPY MARKET, FOR NON-VIRAL VECTOR, BY TYPE, 2019–2035 (USD BILLION)
      143. TABLE 142 REST OF THE WORLD: GENE THERAPY MARKET, BY GENE TYPE, 2019–2035 (USD BILLION)
      144. TABLE 143 REST OF THE WORLD: GENE THERAPY MARKET, BY APPLICATION, 2019–2035 (USD BILLION)
      145. TABLE 144 REST OF THE WORLD: GENE THERAPY MARKET, BY DELIVERY METHOD, 2019–2035 (USD BILLION)
      146. TABLE 145 MIDDLE EAST & AFRICA: GENE THERAPY MARKET, BY VECTOR TYPE, 2019–2035 (USD BILLION)
      147. TABLE 146 MIDDLE EAST & AFRICA: GENE THERAPY MARKET, FOR VIRAL VECTOR, BY TYPE, 2019–2035 (USD BILLION)
      148. TABLE 147 MIDDLE EAST & AFRICA: GENE THERAPY MARKET, FOR NON-VIRAL VECTOR, BY TYPE, 2019–2035 (USD BILLION)
      149. TABLE 148 MIDDLE EAST & AFRICA: GENE THERAPY MARKET, BY GENE TYPE, 2019–2035 (USD BILLION)
      150. TABLE 149 MIDDLE EAST & AFRICA: GENE THERAPY MARKET, BY APPLICATION, 2019–2035 (USD BILLION)
      151. TABLE 150 MIDDLE EAST & AFRICA: GENE THERAPY MARKET, BY DELIVERY METHOD, 2019–2035 (USD BILLION)
      152. TABLE 151 SOUTH AMERICA: GENE THERAPY MARKET, BY VECTOR TYPE, 2019–2035 (USD BILLION)
      153. TABLE 152 SOUTH AMERICA: GENE THERAPY MARKET, FOR VIRAL VECTOR, BY TYPE, 2019–2035 (USD BILLION)
      154. TABLE 153 SOUTH AMERICA: GENE THERAPY MARKET, FOR NON-VIRAL VECTOR, BY TYPE, 2019–2035 (USD BILLION)
      155. TABLE 154 SOUTH AMERICA: GENE THERAPY MARKET, BY GENE TYPE, 2019–2035 (USD BILLION)
      156. TABLE 155 SOUTH AMERICA: GENE THERAPY MARKET, BY APPLICATION, 2019–2035 (USD BILLION)
      157. TABLE 156 SOUTH AMERICA: GENE THERAPY MARKET, BY DELIVERY METHOD, 2019–2035 (USD BILLION)
      158. TABLE 157 PUBLIC PLAYERS STOCK SUMMARY
      159. TABLE 158 PRODUCT APROVAL/ PRODUCT LAUNCH
      160. TABLE 159 ACQUISITION/ EXPANSION
      161. TABLE 160 AGREEMENT/PARTNERSHIP/COLLABORATION
      162. TABLE 161 BRISTOL-MYERS SQUIBB COMPANY: PRODUCT OFFERED
      163. TABLE 162 BRISTOL-MYERS SQUIBB COMPANY: KEY DEVELOPMENTS
      164. TABLE 163 LONZA: PRODUCTS OFFERED
      165. TABLE 164 LONZA: KEY DEVELOPMENTS
      166. TABLE 165 UNIQURE N.V.: PRODUCTS OFFERED
      167. TABLE 166 UNIQURE N.V.: KEY DEVELOPMENTS
      168. TABLE 167 BLUEBIRD BIO, INC.: PRODUCTS OFFERED
      169. TABLE 168 BLUEBIRD BIO, INC.: KEY DEVELOPMENTS
      170. TABLE 169 ORCHARD THERAPEUTICS PLC: PRODUCTS OFFERED
      171. TABLE 170 ORCHARD THERAPEUTICS PLC: KEY DEVELOPMENTS
      172. TABLE 171 GENSIGHT BIOLOGICS: PRODUCTS OFFERED
      173. TABLE 172 GENSIGHT BIOLOGICS: KEY DEVELOPMENTS
      174. TABLE 173 NOVARTIS AG: PRODUCTS OFFERED
      175. TABLE 174 NOVARTIS AG: KEY DEVELOPMENTS
      176. TABLE 175 AMGEN INC.: PRODUCTS OFFERED
      177. TABLE 176 SAREPTA THERAPEUTICS INC.: PRODUCTS OFFERED
      178. TABLE 177 SAREPTA THERAPEUTICS INC.: KEY DEVELOPMENTS
      179. TABLE 178 SPARK THERAPEUTICS, INC.: PRODUCTS OFFERED
      180. TABLE 179 SPARK THERAPEUTICS, INC.: KEY DEVELOPMENTS           LIST OF FIGURES
      181. FIGURE 1 GLOBAL GENE THERAPY MARKET: STRUCTURE
      182. FIGURE 2 GLOBAL GENE THERAPY MARKET: MARKET GROWTH FACTOR ANALYSIS (2024-2035)
      183. FIGURE 3 DRIVER IMPACT ANALYSIS (2024-2035)
      184. FIGURE 4 RESTRAINT IMPACT ANALYSIS (2024-2035)
      185. FIGURE 5 Porter's Five Forces Analysis: GLOBAL GENE THERAPY MARKET
      186. FIGURE 6 GLOBAL GENE THERAPY MARKET, VECTOR TYPE SEGMENT, 2024-2035 (USD BILLION)
      187. FIGURE 7 GLOBAL GENE THERAPY MARKET, BY VECTOR TYPE, 2024-2035 (USD BILLION)
      188. FIGURE 8 GLOBAL GENE THERAPY MARKET SHARE (%), BY VECTOR TYPE, 2023
      189. FIGURE 9 GLOBAL GENE THERAPY MARKET, GENE TYPE SEGMENT, 2024-2035 (USD BILLION)
      190. FIGURE 10 GLOBAL GENE THERAPY MARKET, BY GENE TYPE, 2024-2035 (USD BILLION)
      191. FIGURE 11 GLOBAL GENE THERAPY MARKET SHARE (%), BY GENE TYPE, 2024
      192. FIGURE 12 GLOBAL GENE THERAPY MARKET, APPLICATION SEGMENT, 2024-2035 (USD BILLION)
      193. FIGURE 13 GLOBAL GENE THERAPY MARKET, BY APPLICATION, 2024-2035 (USD BILLION)
      194. FIGURE 14 GLOBAL GENE THERAPY MARKET SHARE (%), BY GENE TYPE, 2023
      195. FIGURE 15 GLOBAL GENE THERAPY MARKET, DELIVERY METHOD SEGMENT, 2024-2035 (USD BILLION)
      196. FIGURE 16 GLOBAL GENE THERAPY MARKET, BY DELIVERY METHOD, 2024-2035 (USD BILLION)
      197. FIGURE 17 GLOBAL GENE THERAPY MARKET SHARE (%), BY DELIVERY METHOD, 2023
      198. FIGURE 18 GLOBAL GENE THERAPY MARKET, BY REGION, 2024-2035 (USD BILLION)
      199. FIGURE 19 GLOBAL GENE THERAPY MARKET SHARE (%), BY REGION, 2023
      200. FIGURE 20 NORTH AMERICA MARKET ANALYSIS: GENE THERAPY MARKET, 2019-2035
      201. FIGURE 21 NORTH AMERICA: GENE THERAPY MARKET, BY COUNTRY, 2024-2035 (USD BILLION)
      202. FIGURE 22 NORTH AMERICA: GENE THERAPY MARKET SHARE (%), BY COUNTRY, 2024
      203. FIGURE 23 EUROPE MARKET ANALYSIS: GENE THERAPY MARKET, 2019-2035
      204. FIGURE 24 EUROPE: GENE THERAPY MARKET, BY COUNTRY, 2024-2035 (USD BILLION)
      205. FIGURE 25 EUROPE: GENE THERAPY MARKET SHARE (%), BY COUNTRY, 2023
      206. FIGURE 26 ASIA-PACIFIC MARKET ANALYSIS: GENE THERAPY MARKET, 2019-2035 (USD BILLION)
      207. FIGURE 27 ASIA-PACIFIC: GENE THERAPY MARKET SHARE, BY COUNTRY, 2024-2035 (USD BILLION)
      208. FIGURE 28 ASIA-PACIFIC: GENE THERAPY MARKET SHARE, BY COUNTRY, 2023 (%)
      209. FIGURE 29 REST OF THE WORLD MARKET ANALYSIS: GENE THERAPY MARKET, 2019-2035 (USD BILLION)
      210. FIGURE 30 REST OF THE WORLD: GENE THERAPY MARKET SHARE, BY COUNTRY, 2024-2035 (USD BILLION)
      211. FIGURE 31 REST OF THE WORLD: GENE THERAPY MARKET SHARE, BY COUNTRY, 2024 (%)
      212. FIGURE 32 GLOBAL GENE THERAPY MARKET PLAYERS: COMPETITIVE ANALYSIS, 2024
      213. FIGURE 33 COMPETITOR DASHBOARD: GLOBAL GENE THERAPY MARKET
      214. FIGURE 34 BRISTOL-MYERS SQUIBB COMPANY: FINANCIAL OVERVIEW SNAPSHOT
      215. FIGURE 35 BRISTOL-MYERS SQUIBB COMPANY: SWOT ANALYSIS
      216. FIGURE 36 LONZA: FINANCIAL OVERVIEW SNAPSHOT
      217. FIGURE 37 LONZA: SWOT ANALYSIS
      218. FIGURE 38 UNIQURE N.V.: FINANCIAL OVERVIEW SNAPSHOT
      219. FIGURE 39 UNIQURE N.V.: SWOT ANALYSIS
      220. FIGURE 40 BLUEBIRD BIO, INC.: FINANCIAL OVERVIEW SNAPSHOT
      221. FIGURE 41 GENSIGHT BIOLOGICS: FINANCIAL OVERVIEW SNAPSHOT
      222. FIGURE 42 NOVARTIS AG: FINANCIAL OVERVIEW SNAPSHOT
      223. FIGURE 43 NOVARTIS AG: SWOT ANALYSIS
      224. FIGURE 44 AMGEN INC.: FINANCIAL OVERVIEW SNAPSHOT
      225. FIGURE 45 AMGEN INC.: SWOT ANALYSIS
      226. FIGURE 46 SAREPTA THERAPEUTICS INC.: FINANCIAL OVERVIEW SNAPSHOT  

    Global Outlook (USD Billion,2019-2035)

    Global Gene Therapy, By Vector Type (USD Billion,2019-2035)

    • Viral Vector
    • Lentiviral Vectors (LVVs)
    • Retrovirus Vectors
    • Adenoviral Vectors (AdVs)
    • Adeno-associated Viral Vectors (AAVs)
    • Non-Viral Vector
    • Physical Vector
    • Chemical Vector

    Global Gene Therapy, By Gene Type (USD Billion,2019-2035)

    • Antigen
    • Cytokine
    • Tumor Suppressor
    • Suicide
    • Deficiency
    • Growth Factors
    • Receptors
    • Others

    Global Gene Therapy, By Application (USD Billion,2019-2035)

    • Oncological Disorders
    • Rare Diseases
    • Cardiovascular Diseases
    • Neurological Disorders
    • Infectious Diseas
    • Others


    Global Gene Therapy, By Delivery Method (USD Billion,2019-2035)

    • In Vivo Gene Therapy
    • Ex Vivo Gene Therapy

    North America Outlook (USD Billion,2019-2035)

    North America Gene Therapy, By Vector Type (USD Billion,2019-2035)

    • Viral Vector
    • Lentiviral Vectors (LVVs)
    • Retrovirus Vectors
    • Adenoviral Vectors (AdVs)
    • Adeno-associated Viral Vectors (AAVs)
    • Non-Viral Vector
    • Physical Vector
    • Chemical Vector

    North America Gene Therapy, By Gene Type (USD Billion,2019-2035)

    • Antigen
    • Cytokine
    • Tumor Suppressor
    • Suicide
    • Deficiency
    • Growth Factors
    • Receptors
    • Others

    North America Gene Therapy, By Application (USD Billion,2019-2035)

    • Oncological Disorders
    • Rare Diseases
    • Cardiovascular Diseases
    • Neurological Disorders
    • Infectious Diseas
    • Others

    North America Gene Therapy, By Delivery Method (USD Billion,2019-2035)

    • In Vivo Gene Therapy
    • Ex Vivo Gene Therapy

    US Outlook (USD Billion,2019-2035)

    US Gene Therapy, By Vector Type (USD Billion,2019-2035)

    • Viral Vector
    • Lentiviral Vectors (LVVs)
    • Retrovirus Vectors
    • Adenoviral Vectors (AdVs)
    • Adeno-associated Viral Vectors (AAVs)
    • Non-Viral Vector
    • Physical Vector
    • Chemical Vector

    US Gene Therapy, By Gene Type (USD Billion,2019-2035)

    • Antigen
    • Cytokine
    • Tumor Suppressor
    • Suicide
    • Deficiency
    • Growth Factors
    • Receptors
    • Others

    US Gene Therapy, By Application (USD Billion,2019-2035)

    • Oncological Disorders
    • Rare Diseases
    • Cardiovascular Diseases
    • Neurological Disorders
    • Infectious Diseas
    • Others

    US Gene Therapy, By Delivery Method (USD Billion,2019-2035)

    • In Vivo Gene Therapy
    • Ex Vivo Gene Therapy

    Canada Outlook (USD Billion,2019-2035)

    Canada Gene Therapy, By Vector Type (USD Billion,2019-2035)

    • Viral Vector
    • Lentiviral Vectors (LVVs)
    • Retrovirus Vectors
    • Adenoviral Vectors (AdVs)
    • Adeno-associated Viral Vectors (AAVs)
    • Non-Viral Vector
    • Physical Vector
    • Chemical Vector

    Canada Gene Therapy, By Gene Type (USD Billion,2019-2035)

    • Antigen
    • Cytokine
    • Tumor Suppressor
    • Suicide
    • Deficiency
    • Growth Factors
    • Receptors
    • Others

    Canada Gene Therapy, By Application (USD Billion,2019-2035)

    • Oncological Disorders
    • Rare Diseases
    • Cardiovascular Diseases
    • Neurological Disorders
    • Infectious Diseas
    • Others

    Canada Gene Therapy, By Delivery Method (USD Billion,2019-2035)

    • In Vivo Gene Therapy
    • Ex Vivo Gene Therapy

    Europe Outlook (USD Billion,2019-2035)

    Europe Gene Therapy, By Vector Type (USD Billion,2019-2035)

    • Viral Vector
    • Lentiviral Vectors (LVVs)
    • Retrovirus Vectors
    • Adenoviral Vectors (AdVs)
    • Adeno-associated Viral Vectors (AAVs)
    • Non-Viral Vector
    • Physical Vector
    • Chemical Vector

    Europe Gene Therapy, By Gene Type (USD Billion,2019-2035)

    • Antigen
    • Cytokine
    • Tumor Suppressor
    • Suicide
    • Deficiency
    • Growth Factors
    • Receptors
    • Others

    Europe Gene Therapy, By Application (USD Billion,2019-2035)

    • Oncological Disorders
    • Rare Diseases
    • Cardiovascular Diseases
    • Neurological Disorders
    • Infectious Diseas
    • Others

    Europe Gene Therapy, By Delivery Method (USD Billion,2019-2035)

    • In Vivo Gene Therapy
    • Ex Vivo Gene Therapy

    Germany Outlook (USD Billion,2019-2035)

    Germany Gene Therapy, By Vector Type (USD Billion,2019-2035)

    • Viral Vector
    • Lentiviral Vectors (LVVs)
    • Retrovirus Vectors
    • Adenoviral Vectors (AdVs)
    • Adeno-associated Viral Vectors (AAVs)
    • Non-Viral Vector
    • Physical Vector
    • Chemical Vector

    Germany Gene Therapy, By Gene Type (USD Billion,2019-2035)

    • Antigen
    • Cytokine
    • Tumor Suppressor
    • Suicide
    • Deficiency
    • Growth Factors
    • Receptors
    • Others

    Germany Gene Therapy, By Application (USD Billion,2019-2035)

    • Oncological Disorders
    • Rare Diseases
    • Cardiovascular Diseases
    • Neurological Disorders
    • Infectious Diseas
    • Others

    Germany Gene Therapy, By Delivery Method (USD Billion,2019-2035)

    • In Vivo Gene Therapy
    • Ex Vivo Gene Therapy


    • France Outlook (USD Billion,2019-2035)

    France Gene Therapy, By Vector Type (USD Billion,2019-2035)

    • Viral Vector
    • Lentiviral Vectors (LVVs)
    • Retrovirus Vectors
    • Adenoviral Vectors (AdVs)
    • Adeno-associated Viral Vectors (AAVs)
    • Non-Viral Vector
    • Physical Vector
    • Chemical Vector

    France Gene Therapy, By Gene Type (USD Billion,2019-2035)

    • Antigen
    • Cytokine
    • Tumor Suppressor
    • Suicide
    • Deficiency
    • Growth Factors
    • Receptors
    • Others

    France Gene Therapy, By Application (USD Billion,2019-2035)

    • Oncological Disorders
    • Rare Diseases
    • Cardiovascular Diseases
    • Neurological Disorders
    • Infectious Diseas
    • Others


    France Gene Therapy, By Delivery Method (USD Billion,2019-2035)

    • In Vivo Gene Therapy
    • Ex Vivo Gene Therapy

    UK Outlook (USD Billion,2019-2035)

    UK Gene Therapy, By Vector Type (USD Billion,2019-2035)

    • Viral Vector
    • Lentiviral Vectors (LVVs)
    • Retrovirus Vectors
    • Adenoviral Vectors (AdVs)
    • Adeno-associated Viral Vectors (AAVs)
    • Non-Viral Vector
    • Physical Vector
    • Chemical Vector

    UK Gene Therapy, By Gene Type (USD Billion,2019-2035)

    • Antigen
    • Cytokine
    • Tumor Suppressor
    • Suicide
    • Deficiency
    • Growth Factors
    • Receptors
    • Others

    UK Gene Therapy, By Application (USD Billion,2019-2035)

    • Oncological Disorders
    • Rare Diseases
    • Cardiovascular Diseases
    • Neurological Disorders
    • Infectious Diseas
    • Others

    UK Gene Therapy, By Delivery Method (USD Billion,2019-2035)

    • In Vivo Gene Therapy
    • Ex Vivo Gene Therapy

    Italy Outlook (USD Billion,2019-2035)

    Italy Gene Therapy, By Vector Type (USD Billion,2019-2035)

    • Viral Vector
    • Lentiviral Vectors (LVVs)
    • Retrovirus Vectors
    • Adenoviral Vectors (AdVs)
    • Adeno-associated Viral Vectors (AAVs)
    • Non-Viral Vector
    • Physical Vector
    • Chemical Vector

    Italy Gene Therapy, By Gene Type (USD Billion,2019-2035)

    • Antigen
    • Cytokine
    • Tumor Suppressor
    • Suicide
    • Deficiency
    • Growth Factors
    • Receptors
    • Others

    Italy Gene Therapy, By Application (USD Billion,2019-2035)

    • Oncological Disorders
    • Rare Diseases
    • Cardiovascular Diseases
    • Neurological Disorders
    • Infectious Diseas
    • Others

    Italy Gene Therapy, By Delivery Method (USD Billion,2019-2035)

    • In Vivo Gene Therapy
    • Ex Vivo Gene Therapy

    Spain Outlook (USD Billion,2019-2035)

    Spain Gene Therapy, By Vector Type (USD Billion,2019-2035)

    • Viral Vector
    • Lentiviral Vectors (LVVs)
    • Retrovirus Vectors
    • Adenoviral Vectors (AdVs)
    • Adeno-associated Viral Vectors (AAVs)
    • Non-Viral Vector
    • Physical Vector
    • Chemical Vector

    Spain Gene Therapy, By Gene Type (USD Billion,2019-2035)

    • Antigen
    • Cytokine
    • Tumor Suppressor
    • Suicide
    • Deficiency
    • Growth Factors
    • Receptors
    • Others

    Spain Gene Therapy, By Application (USD Billion,2019-2035)

    • Oncological Disorders
    • Rare Diseases
    • Cardiovascular Diseases
    • Neurological Disorders
    • Infectious Diseas
    • Others

    Spain Gene Therapy, By Delivery Method (USD Billion,2019-2035)

    • In Vivo Gene Therapy
    • Ex Vivo Gene Therapy

    Rest of Europe Outlook (USD Billion,2019-2035)

    Rest of Europe Gene Therapy, By Vector Type (USD Billion,2019-2035)

    • Viral Vector
    • Lentiviral Vectors (LVVs)
    • Retrovirus Vectors
    • Adenoviral Vectors (AdVs)
    • Adeno-associated Viral Vectors (AAVs)
    • Non-Viral Vector
    • Physical Vector
    • Chemical Vector

    Rest of Europe Gene Therapy, By Gene Type (USD Billion,2019-2035)

    • Antigen
    • Cytokine
    • Tumor Suppressor
    • Suicide
    • Deficiency
    • Growth Factors
    • Receptors
    • Others

    Rest of Europe Gene Therapy, By Application (USD Billion,2019-2035)

    • Oncological Disorders
    • Rare Diseases
    • Cardiovascular Diseases
    • Neurological Disorders
    • Infectious Diseas
    • Others

    Rest of Europe Gene Therapy, By Delivery Method (USD Billion,2019-2035)

    • In Vivo Gene Therapy
    • Ex Vivo Gene Therapy

    Asia-Pacific Outlook (USD Billion,2019-2035)

    Asia-Pacific Gene Therapy, By Vector Type (USD Billion,2019-2035)

    • Viral Vector
    • Lentiviral Vectors (LVVs)
    • Retrovirus Vectors
    • Adenoviral Vectors (AdVs)
    • Adeno-associated Viral Vectors (AAVs)
    • Non-Viral Vector
    • Physical Vector
    • Chemical Vector

    Asia-Pacific Gene Therapy, By Gene Type (USD Billion,2019-2035)

    • Antigen
    • Cytokine
    • Tumor Suppressor
    • Suicide
    • Deficiency
    • Growth Factors
    • Receptors
    • Others

    Asia-Pacific Gene Therapy, By Application (USD Billion,2019-2035)

    • Oncological Disorders
    • Rare Diseases
    • Cardiovascular Diseases
    • Neurological Disorders
    • Infectious Diseas
    • Others

    Asia-Pacific Gene Therapy, By Delivery Method (USD Billion,2019-2035)

    • In Vivo Gene Therapy
    • Ex Vivo Gene Therapy

    China Outlook (USD Billion,2019-2035)

    China Gene Therapy, By Vector Type (USD Billion,2019-2035)

    • Viral Vector
    • Lentiviral Vectors (LVVs)
    • Retrovirus Vectors
    • Adenoviral Vectors (AdVs)
    • Adeno-associated Viral Vectors (AAVs)
    • Non-Viral Vector
    • Physical Vector
    • Chemical Vector

    China Gene Therapy, By Gene Type (USD Billion,2019-2035)

    • Antigen
    • Cytokine
    • Tumor Suppressor
    • Suicide
    • Deficiency
    • Growth Factors
    • Receptors
    • Others

    China Gene Therapy, By Application (USD Billion,2019-2035)

    • Oncological Disorders
    • Rare Diseases
    • Cardiovascular Diseases
    • Neurological Disorders
    • Infectious Diseas
    • Others

    China Gene Therapy, By Delivery Method (USD Billion,2019-2035)

    • In Vivo Gene Therapy
    • Ex Vivo Gene Therapy

    India Outlook (USD Billion,2019-2035)

    India Gene Therapy, By Vector Type (USD Billion,2019-2035)

    • Viral Vector
    • Lentiviral Vectors (LVVs)
    • Retrovirus Vectors
    • Adenoviral Vectors (AdVs)
    • Adeno-associated Viral Vectors (AAVs)
    • Non-Viral Vector
    • Physical Vector
    • Chemical Vector

    India Gene Therapy, By Gene Type (USD Billion,2019-2035)

    • Antigen
    • Cytokine
    • Tumor Suppressor
    • Suicide
    • Deficiency
    • Growth Factors
    • Receptors
    • Others

    India Gene Therapy, By Application (USD Billion,2019-2035)

    • Oncological Disorders
    • Rare Diseases
    • Cardiovascular Diseases
    • Neurological Disorders
    • Infectious Diseas
    • Others

    India Gene Therapy, By Delivery Method (USD Billion,2019-2035)

    • In Vivo Gene Therapy
    • Ex Vivo Gene Therapy

    Japan Outlook (USD Billion,2019-2035)

    Japan Gene Therapy, By Vector Type (USD Billion,2019-2035)

    • Viral Vector
    • Lentiviral Vectors (LVVs)
    • Retrovirus Vectors
    • Adenoviral Vectors (AdVs)
    • Adeno-associated Viral Vectors (AAVs)
    • Non-Viral Vector
    • Physical Vector
    • Chemical Vector

    Japan Gene Therapy, By Gene Type (USD Billion,2019-2035)

    • Antigen
    • Cytokine
    • Tumor Suppressor
    • Suicide
    • Deficiency
    • Growth Factors
    • Receptors
    • Others


    Japan Gene Therapy, By Application (USD Billion,2019-2035)

    • Oncological Disorders
    • Rare Diseases
    • Cardiovascular Diseases
    • Neurological Disorders
    • Infectious Diseas
    • Others

    Japan Gene Therapy, By Delivery Method (USD Billion,2019-2035)

    • In Vivo Gene Therapy
    • Ex Vivo Gene Therapy

    South Korea Outlook (USD Billion,2019-2035)

    South Korea Gene Therapy, By Vector Type (USD Billion,2019-2035)

    • Viral Vector
    • Lentiviral Vectors (LVVs)
    • Retrovirus Vectors
    • Adenoviral Vectors (AdVs)
    • Adeno-associated Viral Vectors (AAVs)
    • Non-Viral Vector
    • Physical Vector
    • Chemical Vector

    South Korea Gene Therapy, By Gene Type (USD Billion,2019-2035)

    • Antigen
    • Cytokine
    • Tumor Suppressor
    • Suicide
    • Deficiency
    • Growth Factors
    • Receptors
    • Others

    South Korea Gene Therapy, By Application (USD Billion,2019-2035)

    • Oncological Disorders
    • Rare Diseases
    • Cardiovascular Diseases
    • Neurological Disorders
    • Infectious Diseas
    • Others

    South Korea Gene Therapy, By Delivery Method (USD Billion,2019-2035)

    • In Vivo Gene Therapy
    • Ex Vivo Gene Therapy

    Australia Outlook (USD Billion,2019-2035)

    Australia Gene Therapy, By Vector Type (USD Billion,2019-2035)

    • Viral Vector
    • Lentiviral Vectors (LVVs)
    • Retrovirus Vectors
    • Adenoviral Vectors (AdVs)
    • Adeno-associated Viral Vectors (AAVs)
    • Non-Viral Vector
    • Physical Vector
    • Chemical Vector


    Australia Gene Therapy, By Gene Type (USD Billion,2019-2035)

    • Antigen
    • Cytokine
    • Tumor Suppressor
    • Suicide
    • Deficiency
    • Growth Factors
    • Receptors
    • Others

    Australia Gene Therapy, By Application (USD Billion,2019-2035)

    • Oncological Disorders
    • Rare Diseases
    • Cardiovascular Diseases
    • Neurological Disorders
    • Infectious Diseas
    • Others

    Australia Gene Therapy, By Delivery Method (USD Billion,2019-2035)

    • In Vivo Gene Therapy
    • Ex Vivo Gene Therapy

    Rest of Asia-Pacific Outlook (USD Billion,2019-2035)

    Rest of Asia-Pacific Gene Therapy, By Vector Type (USD Billion,2019-2035)

    • Viral Vector
    • Lentiviral Vectors (LVVs)
    • Retrovirus Vectors
    • Adenoviral Vectors (AdVs)
    • Adeno-associated Viral Vectors (AAVs)
    • Non-Viral Vector
    • Physical Vector
    • Chemical Vector

    Rest of Asia-Pacific Gene Therapy, By Gene Type (USD Billion,2019-2035)

    • Antigen
    • Cytokine
    • Tumor Suppressor
    • Suicide
    • Deficiency
    • Growth Factors
    • Receptors
    • Others

    Rest of Asia-Pacific Gene Therapy, By Application (USD Billion,2019-2035)

    • Oncological Disorders
    • Rare Diseases
    • Cardiovascular Diseases
    • Neurological Disorders
    • Infectious Diseas
    • Others

    Rest of Asia-Pacific Gene Therapy, By Delivery Method (USD Billion,2019-2035)

    • In Vivo Gene Therapy
    • Ex Vivo Gene Therapy


    Rest of the World Outlook (USD Billion,2019-2035)

    Rest of the World Gene Therapy, By Vector Type (USD Billion,2019-2035)

    • Viral Vector
    • Lentiviral Vectors (LVVs)
    • Retrovirus Vectors
    • Adenoviral Vectors (AdVs)
    • Adeno-associated Viral Vectors (AAVs)
    • Non-Viral Vector
    • Physical Vector
    • Chemical Vector

    Rest of the World Gene Therapy, By Gene Type (USD Billion,2019-2035)

    • Antigen
    • Cytokine
    • Tumor Suppressor
    • Suicide
    • Deficiency
    • Growth Factors
    • Receptors
    • Others

    Rest of the World Gene Therapy, By Application (USD Billion,2019-2035)

    • Oncological Disorders
    • Rare Diseases
    • Cardiovascular Diseases
    • Neurological Disorders
    • Infectious Diseas
    • Others


    Rest of the World Gene Therapy, By Delivery Method (USD Billion,2019-2035)

    • In Vivo Gene Therapy
    • Ex Vivo Gene Therapy

    Middle East & Africa Outlook (USD Billion,2019-2035)

    Middle East & Africa Gene Therapy, By Vector Type (USD Billion,2019-2035)

    • Viral Vector
    • Lentiviral Vectors (LVVs)
    • Retrovirus Vectors
    • Adenoviral Vectors (AdVs)
    • Adeno-associated Viral Vectors (AAVs)
    • Non-Viral Vector
    • Physical Vector
    • Chemical Vector

    Middle East & Africa Gene Therapy, By Gene Type (USD Billion,2019-2035)

    • Antigen
    • Cytokine
    • Tumor Suppressor
    • Suicide
    • Deficiency
    • Growth Factors
    • Receptors
    • Others

    Middle East & Africa Gene Therapy, By Application (USD Billion,2019-2035)

    • Oncological Disorders
    • Rare Diseases
    • Cardiovascular Diseases
    • Neurological Disorders
    • Infectious Diseas
    • Others

    Middle East & Africa Gene Therapy, By Delivery Method (USD Billion,2019-2035)

    • In Vivo Gene Therapy
    • Ex Vivo Gene Therapy

    South America Outlook (USD Billion,2019-2035)

    South America Gene Therapy, By Vector Type (USD Billion,2019-2035)

    • Viral Vector
    • Lentiviral Vectors (LVVs)
    • Retrovirus Vectors
    • Adenoviral Vectors (AdVs)
    • Adeno-associated Viral Vectors (AAVs)
    • Non-Viral Vector
    • Physical Vector
    • Chemical Vector

    South America Gene Therapy, By Gene Type (USD Billion,2019-2035)

    • Antigen
    • Cytokine
    • Tumor Suppressor
    • Suicide
    • Deficiency
    • Growth Factors
    • Receptors
    • Others

    South America Gene Therapy, By Application (USD Billion,2019-2035)

    • Oncological Disorders
    • Rare Diseases
    • Cardiovascular Diseases
    • Neurological Disorders
    • Infectious Diseas
    • Others

    South America Gene Therapy, By Delivery Method (USD Billion,2019-2035)

    • In Vivo Gene Therapy
    • Ex Vivo Gene Therapy
    Infographic

    Free Sample Request

    Kindly complete the form below to receive a free sample of this Report

    Get Free Sample

    Customer Strories

    “I am very pleased with how market segments have been defined in a relevant way for my purposes (such as "Portable Freezers & refrigerators" and "last-mile"). In general the report is well structured. Thanks very much for your efforts.”

    Victoria Milne

    Founder
    Case Study
    Chemicals and Materials