Request Free Sample ×

Kindly complete the form below to receive a free sample of this Report

* Please use a valid business email

Leading companies partner with us for data-driven Insights

clients tt-cursor
Hero Background

GCC Computer Aided Design Market

ID: MRFR/ICT/56796-HCR
200 Pages
Apoorva Priyadarshi
Last Updated: April 06, 2026

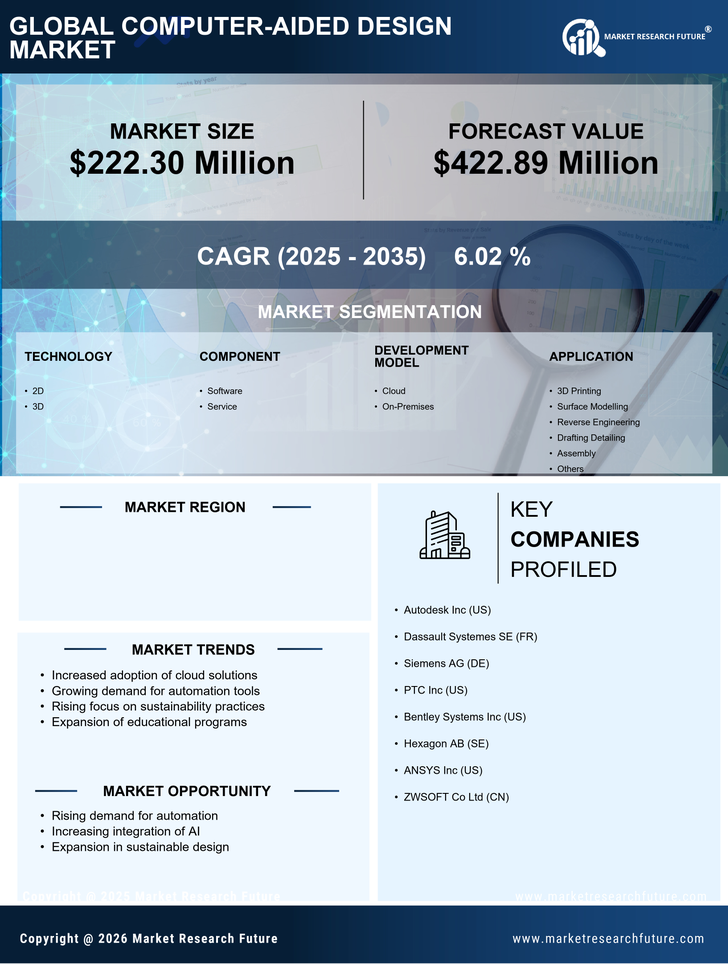
GCC Computer-Aided Design Market Research Report By Technology (2D, 3D), By Component (Software, Services), By Development Model (Cloud, On-Premises), By Application (3D Printing, Surface Modelling, Reverse Engineering, Drafting Detailing, Assembly, Others), and By End-use Vehicle (Electrical, Electronics, Automotive, Civil, Construction, Energy, Materials, Industrial Equipment, Media, Entertainment, Others)- Forecast to 2035

Share:
Download PDF ×

We do not share your information with anyone. However, we may send you emails based on your report interest from time to time. You may contact us at any time to opt-out.

GCC Computer Aided Design Market Infographic
Purchase Options
  1. 1 SECTION I: EXECUTIVE SUMMARY AND KEY HIGHLIGHTS
    1. 1.1 EXECUTIVE SUMMARY
      1. 1.1.1 Market Overview
      2. 1.1.2 Key Findings
      3. 1.1.3 Market Segmentation
      4. 1.1.4 Competitive Landscape
      5. 1.1.5 Challenges and Opportunities
      6. 1.1.6 Future Outlook
  2. 2 SECTION II: SCOPING, METHODOLOGY AND MARKET STRUCTURE
    1. 2.1 MARKET INTRODUCTION
      1. 2.1.1 Definition
      2. 2.1.2 Scope of the study
        1. 2.1.2.1 Research Objective
        2. 2.1.2.2 Assumption
        3. 2.1.2.3 Limitations
    2. 2.2 RESEARCH METHODOLOGY
      1. 2.2.1 Overview
      2. 2.2.2 Data Mining
      3. 2.2.3 Secondary Research
      4. 2.2.4 Primary Research
        1. 2.2.4.1 Primary Interviews and Information Gathering Process
        2. 2.2.4.2 Breakdown of Primary Respondents
      5. 2.2.5 Forecasting Model
      6. 2.2.6 Market Size Estimation
        1. 2.2.6.1 Bottom-Up Approach
        2. 2.2.6.2 Top-Down Approach
      7. 2.2.7 Data Triangulation
      8. 2.2.8 Validation
  3. 3 SECTION III: QUALITATIVE ANALYSIS
    1. 3.1 MARKET DYNAMICS
      1. 3.1.1 Overview
      2. 3.1.2 Drivers
      3. 3.1.3 Restraints
      4. 3.1.4 Opportunities
    2. 3.2 MARKET FACTOR ANALYSIS
      1. 3.2.1 Value chain Analysis
      2. 3.2.2 Porter's Five Forces Analysis
        1. 3.2.2.1 Bargaining Power of Suppliers
        2. 3.2.2.2 Bargaining Power of Buyers
        3. 3.2.2.3 Threat of New Entrants
        4. 3.2.2.4 Threat of Substitutes
        5. 3.2.2.5 Intensity of Rivalry
      3. 3.2.3 COVID-19 Impact Analysis
        1. 3.2.3.1 Market Impact Analysis
        2. 3.2.3.2 Regional Impact
        3. 3.2.3.3 Opportunity and Threat Analysis
  4. 4 SECTION IV: QUANTITATIVE ANALYSIS
    1. 4.1 Information and Communications Technology, BY Technology (USD Million)
      1. 4.1.1 2D
      2. 4.1.2 3D
    2. 4.2 Information and Communications Technology, BY Component (USD Million)
      1. 4.2.1 Software
      2. 4.2.2 Service
    3. 4.3 Information and Communications Technology, BY Development Model (USD Million)
      1. 4.3.1 Cloud
      2. 4.3.2 On-Premises
    4. 4.4 Information and Communications Technology, BY Application (USD Million)
      1. 4.4.1 3D Printing
      2. 4.4.2 Surface Modelling
      3. 4.4.3 Reverse Engineering
      4. 4.4.4 Drafting Detailing
      5. 4.4.5 Assembly
      6. 4.4.6 Others
    5. 4.5 Information and Communications Technology, BY End Use Vertical (USD Million)
      1. 4.5.1 Electrical And Electronics
      2. 4.5.2 Automotive
      3. 4.5.3 Civil And Construction
      4. 4.5.4 Energy And Materials
      5. 4.5.5 Industrial Equipment
      6. 4.5.6 Media And Entertainment
      7. 4.5.7 Others
  5. 5 SECTION V: COMPETITIVE ANALYSIS
    1. 5.1 Competitive Landscape
      1. 5.1.1 Overview
      2. 5.1.2 Competitive Analysis
      3. 5.1.3 Market share Analysis
      4. 5.1.4 Major Growth Strategy in the Information and Communications Technology
      5. 5.1.5 Competitive Benchmarking
      6. 5.1.6 Leading Players in Terms of Number of Developments in the Information and Communications Technology
      7. 5.1.7 Key developments and growth strategies
        1. 5.1.7.1 New Product Launch/Service Deployment
        2. 5.1.7.2 Merger & Acquisitions
        3. 5.1.7.3 Joint Ventures
      8. 5.1.8 Major Players Financial Matrix
        1. 5.1.8.1 Sales and Operating Income
        2. 5.1.8.2 Major Players R&D Expenditure. 2023
    2. 5.2 Company Profiles
      1. 5.2.1 Autodesk Inc (US)
        1. 5.2.1.1 Financial Overview
        2. 5.2.1.2 Products Offered
        3. 5.2.1.3 Key Developments
        4. 5.2.1.4 SWOT Analysis
        5. 5.2.1.5 Key Strategies
      2. 5.2.2 Dassault Systemes SE (FR)
        1. 5.2.2.1 Financial Overview
        2. 5.2.2.2 Products Offered
        3. 5.2.2.3 Key Developments
        4. 5.2.2.4 SWOT Analysis
        5. 5.2.2.5 Key Strategies
      3. 5.2.3 Siemens AG (DE)
        1. 5.2.3.1 Financial Overview
        2. 5.2.3.2 Products Offered
        3. 5.2.3.3 Key Developments
        4. 5.2.3.4 SWOT Analysis
        5. 5.2.3.5 Key Strategies
      4. 5.2.4 PTC Inc (US)
        1. 5.2.4.1 Financial Overview
        2. 5.2.4.2 Products Offered
        3. 5.2.4.3 Key Developments
        4. 5.2.4.4 SWOT Analysis
        5. 5.2.4.5 Key Strategies
      5. 5.2.5 Bentley Systems Inc (US)
        1. 5.2.5.1 Financial Overview
        2. 5.2.5.2 Products Offered
        3. 5.2.5.3 Key Developments
        4. 5.2.5.4 SWOT Analysis
        5. 5.2.5.5 Key Strategies
      6. 5.2.6 Hexagon AB (SE)
        1. 5.2.6.1 Financial Overview
        2. 5.2.6.2 Products Offered
        3. 5.2.6.3 Key Developments
        4. 5.2.6.4 SWOT Analysis
        5. 5.2.6.5 Key Strategies
      7. 5.2.7 ANSYS Inc (US)
        1. 5.2.7.1 Financial Overview
        2. 5.2.7.2 Products Offered
        3. 5.2.7.3 Key Developments
        4. 5.2.7.4 SWOT Analysis
        5. 5.2.7.5 Key Strategies
      8. 5.2.8 ZWSOFT Co Ltd (CN)
        1. 5.2.8.1 Financial Overview
        2. 5.2.8.2 Products Offered
        3. 5.2.8.3 Key Developments
        4. 5.2.8.4 SWOT Analysis
        5. 5.2.8.5 Key Strategies
    3. 5.3 Appendix
      1. 5.3.1 References
      2. 5.3.2 Related Reports
  6. 6 LIST OF FIGURES
    1. 6.1 MARKET SYNOPSIS
    2. 6.2 GCC MARKET ANALYSIS BY TECHNOLOGY
    3. 6.3 GCC MARKET ANALYSIS BY COMPONENT
    4. 6.4 GCC MARKET ANALYSIS BY DEVELOPMENT MODEL
    5. 6.5 GCC MARKET ANALYSIS BY APPLICATION
    6. 6.6 GCC MARKET ANALYSIS BY END USE VERTICAL
    7. 6.7 KEY BUYING CRITERIA OF INFORMATION AND COMMUNICATIONS TECHNOLOGY
    8. 6.8 RESEARCH PROCESS OF MRFR
    9. 6.9 DRO ANALYSIS OF INFORMATION AND COMMUNICATIONS TECHNOLOGY
    10. 6.10 DRIVERS IMPACT ANALYSIS: INFORMATION AND COMMUNICATIONS TECHNOLOGY
    11. 6.11 RESTRAINTS IMPACT ANALYSIS: INFORMATION AND COMMUNICATIONS TECHNOLOGY
    12. 6.12 SUPPLY / VALUE CHAIN: INFORMATION AND COMMUNICATIONS TECHNOLOGY
    13. 6.13 INFORMATION AND COMMUNICATIONS TECHNOLOGY, BY TECHNOLOGY, 2024 (% SHARE)
    14. 6.14 INFORMATION AND COMMUNICATIONS TECHNOLOGY, BY TECHNOLOGY, 2024 TO 2035 (USD Million)
    15. 6.15 INFORMATION AND COMMUNICATIONS TECHNOLOGY, BY COMPONENT, 2024 (% SHARE)
    16. 6.16 INFORMATION AND COMMUNICATIONS TECHNOLOGY, BY COMPONENT, 2024 TO 2035 (USD Million)
    17. 6.17 INFORMATION AND COMMUNICATIONS TECHNOLOGY, BY DEVELOPMENT MODEL, 2024 (% SHARE)
    18. 6.18 INFORMATION AND COMMUNICATIONS TECHNOLOGY, BY DEVELOPMENT MODEL, 2024 TO 2035 (USD Million)
    19. 6.19 INFORMATION AND COMMUNICATIONS TECHNOLOGY, BY APPLICATION, 2024 (% SHARE)
    20. 6.20 INFORMATION AND COMMUNICATIONS TECHNOLOGY, BY APPLICATION, 2024 TO 2035 (USD Million)
    21. 6.21 INFORMATION AND COMMUNICATIONS TECHNOLOGY, BY END USE VERTICAL, 2024 (% SHARE)
    22. 6.22 INFORMATION AND COMMUNICATIONS TECHNOLOGY, BY END USE VERTICAL, 2024 TO 2035 (USD Million)
    23. 6.23 BENCHMARKING OF MAJOR COMPETITORS
  7. 7 LIST OF TABLES
    1. 7.1 LIST OF ASSUMPTIONS
  8. 7.1.1
    1. 7.2 GCC MARKET SIZE ESTIMATES; FORECAST
      1. 7.2.1 BY TECHNOLOGY, 2025-2035 (USD Million)
      2. 7.2.2 BY COMPONENT, 2025-2035 (USD Million)
      3. 7.2.3 BY DEVELOPMENT MODEL, 2025-2035 (USD Million)
      4. 7.2.4 BY APPLICATION, 2025-2035 (USD Million)
      5. 7.2.5 BY END USE VERTICAL, 2025-2035 (USD Million)
    2. 7.3 PRODUCT LAUNCH/PRODUCT DEVELOPMENT/APPROVAL
  9. 7.3.1
    1. 7.4 ACQUISITION/PARTNERSHIP
  10. 7.4.1

GCC Information and Communications Technology Market Segmentation

Information and Communications Technology By Technology (USD Million, 2025-2035)

  • 2D
  • 3D

Information and Communications Technology By Component (USD Million, 2025-2035)

  • Software
  • Service

Information and Communications Technology By Development Model (USD Million, 2025-2035)

  • Cloud
  • On-Premises

Information and Communications Technology By Application (USD Million, 2025-2035)

  • 3D Printing
  • Surface Modelling
  • Reverse Engineering
  • Drafting Detailing
  • Assembly
  • Others

Information and Communications Technology By End Use Vertical (USD Million, 2025-2035)

  • Electrical And Electronics
  • Automotive
  • Civil And Construction
  • Energy And Materials
  • Industrial Equipment
  • Media And Entertainment
  • Others

Compare Licence

×
Features License Type
Single User Multiuser License Enterprise User
Price $4,950 $5,950 $7,250
Maximum User Access Limit 1 User Upto 10 Users Unrestricted Access Throughout the Organization
Free Customization
Direct Access to Analyst
Deliverable Format
Platform Access
Discount on Next Purchase 10% 15% 15%
Printable Versions