Market Segmentation Tab
- Global Gas Turbine Market by Type Outlook (USD Million, 2019-2035)
- Industrial
- Heavy-Duty
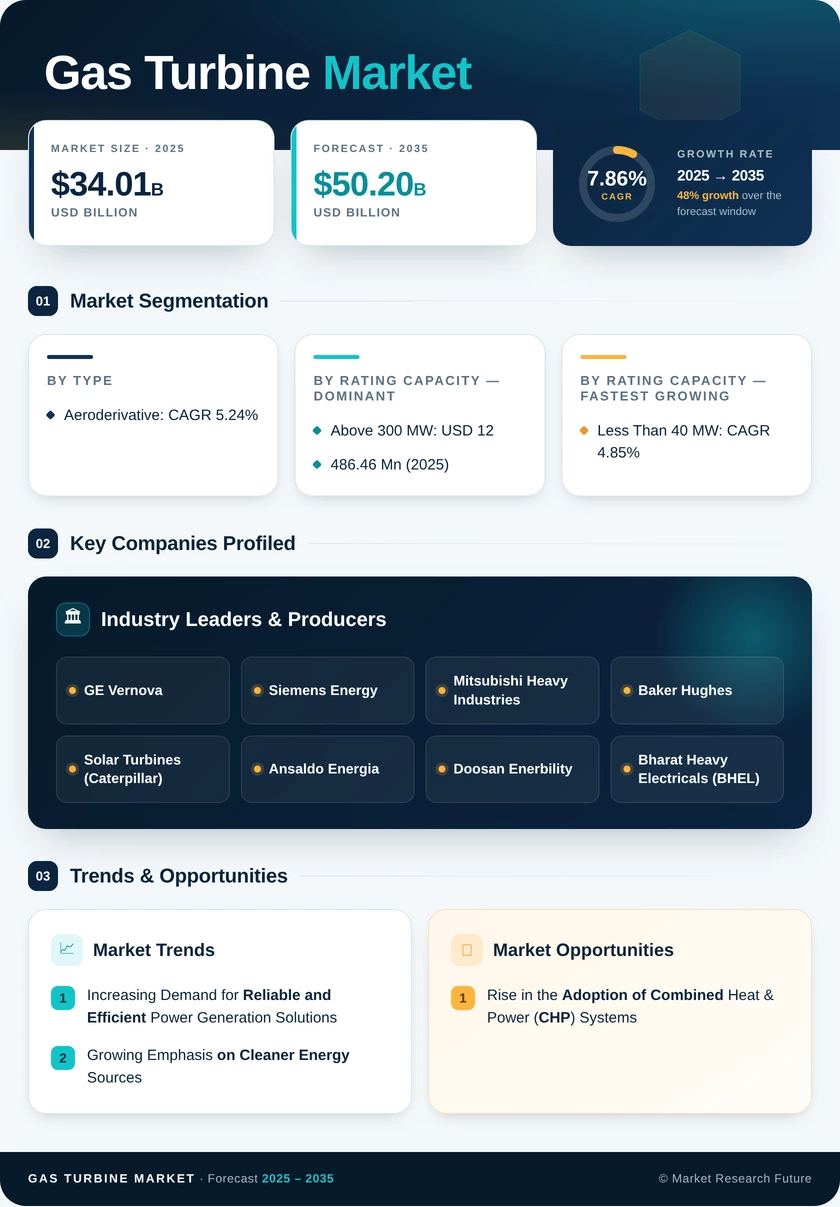
- Aeroderivative
- Global Gas Turbine Market by Rating Capacity Outlook (USD Million, 2019-2035)
- Less Than 40 MW
- 40 TO 120 MW
- 121 TO 300 MW
- ABOVE 300 MW
- Global Gas Turbine Market by End-User Outlook (USD Million, 2019-2035)
- Power Generation
- Oil & Gas
- Marine
- Process Plants
- Others
- Global Gas Turbine Market, By Technology (USD Million, 2019-2035)
- Open Cycle
- Combined Cycle
Gas Turbine Market Regional Outlook (USD Million, 2019-2035)
- North America Outlook (USD Million, 2019-2035)
- North America Gas Turbine Market by Type Outlook (USD Million, 2019-2035)
- Industrial
- Heavy-Duty
- Aeroderivative
- North America Gas Turbine Market by Rating Capacity Outlook (USD Million, 2019-2035)
- Less Than 40 MW
- 40 TO 120 MW
- 121 TO 300 MW
- ABOVE 300 MW
- North America Gas Turbine Market by End-User Outlook (USD Million, 2019-2035)
- Power Generation
- Oil & Gas
- Marine
- Process Plants
- Others
- North America Gas Turbine Market, By Technology (USD Million, 2019-2035)
- Open Cycle
- Combined Cycle
- US Outlook (USD Million, 2019-2035)
- US Gas Turbine Market by Type Outlook (USD Million, 2019-2035)
- Industrial
- Heavy-Duty
- Aeroderivative
- US Gas Turbine Market by Rating Capacity Outlook (USD Million, 2019-2035)
- Less Than 40 MW
- 40 TO 120 MW
- 121 TO 300 MW
- ABOVE 300 MW
- US Gas Turbine Market by End-User Outlook (USD Million, 2019-2035)
- Power Generation
- Oil & Gas
- Marine
- Process Plants
- Others
- US Gas Turbine Market, By Technology (USD Million, 2019-2035)
- Open Cycle
- Combined Cycle
- Canada Outlook (USD Million, 2019-2035)
- Canada Gas Turbine Market by Type Outlook (USD Million, 2019-2035)
- Industrial
- Heavy-Duty
- Aeroderivative
- Canada Gas Turbine Market by Rating Capacity Outlook (USD Million, 2019-2035)
- Less Than 40 MW
- 40 TO 120 MW
- 121 TO 300 MW
- ABOVE 300 MW
- Canada Gas Turbine Market by End-User Outlook (USD Million, 2019-2035)
- Power Generation
- Oil & Gas
- Marine
- Process Plants
- Others
- Canada Gas Turbine Market, By Technology (USD Million, 2019-2035)
- Open Cycle
- Combined Cycle
- Mexico Outlook (USD Million, 2019-2035)
- Mexico Gas Turbine Market by Type Outlook (USD Million, 2019-2035)
- Industrial
- Heavy-Duty
- Aeroderivative
- Mexico Gas Turbine Market by Rating Capacity Outlook (USD Million, 2019-2035)
- Less Than 40 MW
- 40 TO 120 MW
- 121 TO 300 MW
- ABOVE 300 MW
- Mexico Gas Turbine Market by End-User Outlook (USD Million, 2019-2035)
- Power Generation
- Oil & Gas
- Marine
- Process Plants
- Others
- MexicoGas Turbine Market, By Technology (USD Million, 2019-2035)
- Open Cycle
- Combined Cycle
- Europe Outlook (USD Million, 2019-2035)
- Europe Gas Turbine Market by Type Outlook (USD Million, 2019-2035)
- Industrial
- Heavy-Duty
- Aeroderivative
- Europe Gas Turbine Market by Rating Capacity Outlook (USD Million, 2019-2035)
- Less Than 40 MW
- 40 TO 120 MW
- 121 TO 300 MW
- ABOVE 300 MW
- Europe Gas Turbine Market by End-User Outlook (USD Million, 2019-2035)
- Power Generation
- Oil & Gas
- Marine
- Process Plants
- Others
- Europe Gas Turbine Market, By Technology (USD Million, 2019-2035)
- Open Cycle
- Combined Cycle
- GermanyOutlook (USD Million, 2019-2035)
- Germany Gas Turbine Market by Type Outlook (USD Million, 2019-2035)
- Industrial
- Heavy-Duty
- Aeroderivative
- Germany Gas Turbine Market by Rating Capacity Outlook (USD Million, 2019-2035)
- Less Than 40 MW
- 40 TO 120 MW
- 121 TO 300 MW
- ABOVE 300 MW
- Germany Gas Turbine Market by End-User Outlook (USD Million, 2019-2035)
- Power Generation
- Oil & Gas
- Marine
- Process Plants
- Others
- GermanyGas Turbine Market, By Technology (USD Million, 2019-2035)
- Open Cycle
- Combined Cycle
- UK Outlook (USD Million, 2019-2035)
- UK Gas Turbine Market by Type Outlook (USD Million, 2019-2035)
- Industrial
- Heavy-Duty
- Aeroderivative
- UK Gas Turbine Market by Rating Capacity Outlook (USD Million, 2019-2035)
- Less Than 40 MW
- 40 TO 120 MW
- 121 TO 300 MW
- ABOVE 300 MW
- UK Gas Turbine Market by End-User Outlook (USD Million, 2019-2035)
- Power Generation
- Oil & Gas
- Marine
- Process Plants
- Others
- UK Gas Turbine Market, By Technology (USD Million, 2019-2035)
- Open Cycle
- Combined Cycle
- France Outlook (USD Million, 2019-2035)
- France Gas Turbine Market by Type Outlook (USD Million, 2019-2035)
- Industrial
- Heavy-Duty
- Aeroderivative
- France Gas Turbine Market by Rating Capacity Outlook (USD Million, 2019-2035)
- Less Than 40 MW
- 40 TO 120 MW
- 121 TO 300 MW
- ABOVE 300 MW
- France Gas Turbine Market by End-User Outlook (USD Million, 2019-2035)
- Power Generation
- Oil & Gas
- Marine
- Process Plants
- Others
- France Gas Turbine Market, By Technology (USD Million, 2019-2035)
- Open Cycle
- Combined Cycle
- Italy Outlook (USD Million, 2019-2035)
- Italy Gas Turbine Market by Type Outlook (USD Million, 2019-2035)
- Industrial
- Heavy-Duty
- Aeroderivative
- Italy Gas Turbine Market by Rating Capacity Outlook (USD Million, 2019-2035)
- Less Than 40 MW
- 40 TO 120 MW
- 121 TO 300 MW
- ABOVE 300 MW
- Italy Gas Turbine Market by End-User Outlook (USD Million, 2019-2035)
- Power Generation
- Oil & Gas
- Marine
- Process Plants
- Others
- ItalyGas Turbine Market, By Technology (USD Million, 2019-2035)
- Open Cycle
- Combined Cycle
- Spain Outlook (USD Million, 2019-2035)
- Spain Gas Turbine Market by Type Outlook (USD Million, 2019-2035)
- Industrial
- Heavy-Duty
- Aeroderivative
- Spain Gas Turbine Market by Rating Capacity Outlook (USD Million, 2019-2035)
- Less Than 40 MW
- 40 TO 120 MW
- 121 TO 300 MW
- ABOVE 300 MW
- Spain Gas Turbine Market by End-User Outlook (USD Million, 2019-2035)
- Power Generation
- Oil & Gas
- Marine
- Process Plants
- Others
- Spain Gas Turbine Market, By Technology (USD Million, 2019-2035)
- Open Cycle
- Combined Cycle
- Rest Of Europe Outlook (USD Million, 2019-2035)
- Rest Of Europe Gas Turbine Market by Type Outlook (USD Million, 2019-2035)
- Industrial
- Heavy-Duty
- Aeroderivative
- Rest Of Europe Gas Turbine Market by Rating Capacity Outlook (USD Million, 2019-2035)
- Less Than 40 MW
- 40 TO 120 MW
- 121 TO 300 MW
- ABOVE 300 MW
- Rest Of Europe Gas Turbine Market by End-User Outlook (USD Million, 2019-2035)
- Power Generation
- Oil & Gas
- Marine
- Process Plants
- Others
- Rest Of Europe Gas Turbine Market, By Technology (USD Million, 2019-2035)
- Open Cycle
- Combined Cycle
- Asia-Pacific Outlook (USD Million, 2019-2035)
- Asia-Pacific Gas Turbine Market by Type Outlook (USD Million, 2019-2035)
- Industrial
- Heavy-Duty
- Aeroderivative
- Asia-Pacific Gas Turbine Market by Rating Capacity Outlook (USD Million, 2019-2035)
- Less Than 40 MW
- 40 TO 120 MW
- 121 TO 300 MW
- ABOVE 300 MW
- Asia-Pacific Gas Turbine Market by End-User Outlook (USD Million, 2019-2035)
- Power Generation
- Oil & Gas
- Marine
- Process Plants
- Others
- Asia-Pacific Gas Turbine Market, By Technology (USD Million, 2019-2035)
- Open Cycle
- Combined Cycle
- China Outlook (USD Million, 2019-2035)
- China Gas Turbine Market by Type Outlook (USD Million, 2019-2035)
- Industrial
- Heavy-Duty
- Aeroderivative
- China Gas Turbine Market by Rating Capacity Outlook (USD Million, 2019-2035)
- Less Than 40 MW
- 40 TO 120 MW
- 121 TO 300 MW
- ABOVE 300 MW
- China Gas Turbine Market by End-User Outlook (USD Million, 2019-2035)
- Power Generation
- Oil & Gas
- Marine
- Process Plants
- Others
- China Gas Turbine Market, By Technology (USD Million, 2019-2035)
- Open Cycle
- Combined Cycle
- India Outlook (USD Million, 2019-2035)
- India Gas Turbine Market by Type Outlook (USD Million, 2019-2035)
- Industrial
- Heavy-Duty
- Aeroderivative
- India Gas Turbine Market by Rating Capacity Outlook (USD Million, 2019-2035)
- Less Than 40 MW
- 40 TO 120 MW
- 121 TO 300 MW
- ABOVE 300 MW
- India Gas Turbine Market by End-User Outlook (USD Million, 2019-2035)
- Power Generation
- Oil & Gas
- Marine
- Process Plants
- Others
- IndiaGas Turbine Market, By Technology (USD Million, 2019-2035)
- Open Cycle
- Combined Cycles
- Japan Outlook (USD Million, 2019-2035)
- Japan Gas Turbine Market by Type Outlook (USD Million, 2019-2035)
- Industrial
- Heavy-Duty
- Aeroderivative
- Japan Gas Turbine Market by Rating Capacity Outlook (USD Million, 2019-2035)
- Less Than 40 MW
- 40 TO 120 MW
- 121 TO 300 MW
- ABOVE 300 MW
- Japan Gas Turbine Market by End-User Outlook (USD Million, 2019-2035)
- Power Generation
- Oil & Gas
- Marine
- Process Plants
- Others
- Japan Gas Turbine Market, By Technology (USD Million, 2019-2035)
- Open Cycle
- Combined Cycle
- South Korea Outlook (USD Million, 2019-2035)
- South Korea Gas Turbine Market by Type Outlook (USD Million, 2019-2035)
- Industrial
- Heavy-Duty
- Aeroderivative
- South Korea Gas Turbine Market by Rating Capacity Outlook (USD Million, 2019-2035)
- Less Than 40 MW
- 40 TO 120 MW
- 121 TO 300 MW
- ABOVE 300 MW
- South Korea Gas Turbine Market by End-User Outlook (USD Million, 2019-2035)
- Power Generation
- Oil & Gas
- Marine
- Process Plants
- Others
- South Korea Gas Turbine Market, By Technology (USD Million, 2019-2035)
- Open Cycle
- Combined Cycle
- Malaysia Outlook (USD Million, 2019-2035)
- Malaysia Gas Turbine Market by Type Outlook (USD Million, 2019-2035)
- Industrial
- Heavy-Duty
- Aeroderivative
- Malaysia Gas Turbine Market by Rating Capacity Outlook (USD Million, 2019-2035)
- Less Than 40 MW
- 40 TO 120 MW
- 121 TO 300 MW
- ABOVE 300 MW
- Malaysia Gas Turbine Market by End-User Outlook (USD Million, 2019-2035)
- Power Generation
- Oil & Gas
- Marine
- Process Plants
- Others
- MalaysiaGas Turbine Market, By Technology (USD Million, 2019-2035)
- Open Cycle
- Combined Cycle
- Thailand Outlook (USD Million, 2019-2035)
- Thailand Gas Turbine Market by Type Outlook (USD Million, 2019-2035)
- Industrial
- Heavy-Duty
- Aeroderivative
- Thailand Gas Turbine Market by Rating Capacity Outlook (USD Million, 2019-2035)
- Less Than 40 MW
- 40 TO 120 MW
- 121 TO 300 MW
- ABOVE 300 MW
- Thailand Gas Turbine Market by End-User Outlook (USD Million, 2019-2035)
- Power Generation
- Oil & Gas
- Marine
- Process Plants
- Others
- ThailandGas Turbine Market, By Technology (USD Million, 2019-2035)
- Open Cycle
- Combined Cycle
- Indonesia Outlook (USD Million, 2019-2035)
- Indonesia Gas Turbine Market by Type Outlook (USD Million, 2019-2035)
- Industrial
- Heavy-Duty
- Aeroderivative
- Indonesia Gas Turbine Market by Rating Capacity Outlook (USD Million, 2019-2035)
- Less Than 40 MW
- 40 TO 120 MW
- 121 TO 300 MW
- ABOVE 300 MW
- Indonesia Gas Turbine Market by End-User Outlook (USD Million, 2019-2035)
- Power Generation
- Oil & Gas
- Marine
- Process Plants
- Others
- Indonesia Gas Turbine Market, By Technology (USD Million, 2019-2035)
- Open Cycle
- Combined Cycle
- Myanmar Outlook (USD Million, 2019-2035)
- Myanmar Gas Turbine Market by Type Outlook (USD Million, 2019-2035)
- Industrial
- Heavy-Duty
- Aeroderivative
- Myanmar Gas Turbine Market by Rating Capacity Outlook (USD Million, 2019-2035)
- Less Than 40 MW
- 40 TO 120 MW
- 121 TO 300 MW
- ABOVE 300 MW
- Myanmar Gas Turbine Market by End-User Outlook (USD Million, 2019-2035)
- Power Generation
- Oil & Gas
- Marine
- Process Plants
- Others
- Myanmar Gas Turbine Market, By Technology (USD Million, 2019-2035)
- Open Cycle
- Combined Cycle
- Rest of Asia-Pacific Outlook (USD Million, 2019-2035)
- Rest of Asia-Pacific Gas Turbine Market by Type Outlook (USD Million, 2019-2035)
- Industrial
- Heavy-Duty
- Aeroderivative
- Rest of Asia-Pacific Gas Turbine Market by Rating Capacity Outlook (USD Million, 2019-2035)
- Less Than 40 MW
- 40 TO 120 MW
- 121 TO 300 MW
- ABOVE 300 MW
- Rest of Asia-Pacific Gas Turbine Market by End-User Outlook (USD Million, 2019-2035)
- Power Generation
- Oil & Gas
- Marine
- Process Plants
- Others
- Rest of Asia-Pacific Gas Turbine Market, By Technology (USD Million, 2019-2035)
- Open Cycle
- Combined Cycle
- South America Outlook (USD Million, 2019-2035)
- South America Gas Turbine Market by Type Outlook (USD Million, 2019-2035)
- Industrial
- Heavy-Duty
- Aeroderivative
- South America Gas Turbine Market by Rating Capacity Outlook (USD Million, 2019-2035)
- Less Than 40 MW
- 40 TO 120 MW
- 121 TO 300 MW
- ABOVE 300 MW
- South America Gas Turbine Market by End-User Outlook (USD Million, 2019-2035)
- Power Generation
- Oil & Gas
- Marine
- Process Plants
- Others
- South America Gas Turbine Market, By Technology (USD Million, 2019-2035)
- Open Cycle
- Combined Cycle
- Brazil Outlook (USD Million, 2019-2035)
- Brazil Gas Turbine Market by Type Outlook (USD Million, 2019-2035)
- Industrial
- Heavy-Duty
- Aeroderivative
- Brazil Gas Turbine Market by Rating Capacity Outlook (USD Million, 2019-2035)
- Less Than 40 MW
- 40 TO 120 MW
- 121 TO 300 MW
- ABOVE 300 MW
- Brazil Gas Turbine Market by End-User Outlook (USD Million, 2019-2035)
- Power Generation
- Oil & Gas
- Marine
- Process Plants
- Others
- Brazil Gas Turbine Market, By Technology (USD Million, 2019-2035)
- Open Cycle
- Combined Cycle
- Argentina Outlook (USD Million, 2019-2035)
- Argentina Gas Turbine Market by Type Outlook (USD Million, 2019-2035)
- Industrial
- Heavy-Duty
- Aeroderivative
- Argentina Gas Turbine Market by Rating Capacity Outlook (USD Million, 2019-2035)
- Less Than 40 MW
- 40 TO 120 MW
- 121 TO 300 MW
- ABOVE 300 MW
- Argentina Gas Turbine Market by End-User Outlook (USD Million, 2019-2035)
- Power Generation
- Oil & Gas
- Marine
- Process Plants
- Others
- Argentina Gas Turbine Market, By Technology (USD Million, 2019-2035)
- Open Cycle
- Combined Cycle
- Rest of South America Outlook (USD Million, 2019-2035)
- Rest of South America Gas Turbine Market by Type Outlook (USD Million, 2019-2035)
- Industrial
- Heavy-Duty
- Aeroderivative
- Rest of South America Gas Turbine Market by Rating Capacity Outlook (USD Million, 2019-2035)
- Less Than 40 MW
- 40 TO 120 MW
- 121 TO 300 MW
- ABOVE 300 MW
- Rest of South America Gas Turbine Market by End-User Outlook (USD Million, 2019-2035)
- Power Generation
- Oil & Gas
- Marine
- Process Plants
- Others
- Rest of South America Gas Turbine Market, By Technology (USD Million, 2019-2035)
- Open Cycle
- Combined Cycle
- Middle East & Africa Outlook (USD Million, 2019-2035)
- Middle East & Africa Gas Turbine Market by Type Outlook (USD Million, 2019-2035)
- Industrial
- Heavy-Duty
- Aeroderivative
- Middle East & Africa Gas Turbine Market by Rating Capacity Outlook (USD Million, 2019-2035)
- Less Than 40 MW
- 40 TO 120 MW
- 121 TO 300 MW
- ABOVE 300 MW
- Middle East & Africa Gas Turbine Market by End-User Outlook (USD Million, 2019-2035)
- Power Generation
- Oil & Gas
- Marine
- Process Plants
- Others
- Middle East & Africa Gas Turbine Market, By Technology (USD Million, 2019-2035)
- Open Cycle
- Combined Cycle
- GCC Countries Outlook (USD Million, 2019-2035)
- GCC Countries Gas Turbine Market by Type Outlook (USD Million, 2019-2035)
- Industrial
- Heavy-Duty
- Aeroderivative
- GCC Countries Gas Turbine Market by Rating Capacity Outlook (USD Million, 2019-2035)
- Less Than 40 MW
- 40 TO 120 MW
- 121 TO 300 MW
- ABOVE 300 MW
- GCC Countries Gas Turbine Market by End-User Outlook (USD Million, 2019-2035)
- Power Generation
- Oil & Gas
- Marine
- Process Plants
- Others
- GCC Countries Gas Turbine Market, By Technology (USD Million, 2019-2035)
- Open Cycle
- Combined Cycle
- South Africa Outlook (USD Million, 2019-2035)
- South Africa Gas Turbine Market by Type Outlook (USD Million, 2019-2035)
- Industrial
- Heavy-Duty
- Aeroderivative
- South Africa Gas Turbine Market by Rating Capacity Outlook (USD Million, 2019-2035)
- Less Than 40 MW
- 40 TO 120 MW
- 121 TO 300 MW
- ABOVE 300 MW
- South Africa Gas Turbine Market by End-User Outlook (USD Million, 2019-2035)
- Power Generation
- Oil & Gas
- Marine
- Process Plants
- Others
- South Africa Gas Turbine Market, By Technology (USD Million, 2019-2035)
- Open Cycle
- Combined Cycle
- Rest of Middle East & Africa Outlook (USD Million, 2019-2035)
- Rest of Middle East & Africa Gas Turbine Market by Type Outlook (USD Million, 2019-2035)
- Industrial
- Heavy-Duty
- Aeroderivative
- Rest of Middle East & Africa Gas Turbine Market by Rating Capacity Outlook (USD Million, 2019-2035)
- Less Than 40 MW
- 40 TO 120 MW
- 121 TO 300 MW
- ABOVE 300 MW
- Rest of Middle East & Africa Gas Turbine Market by End-User Outlook (USD Million, 2019-2035)
- Power Generation
- Oil & Gas
- Marine
- Process Plants
- Others
- Rest of Middle East & Africa Gas Turbine Market, By Technology (USD Million, 2019-2035)
- Open Cycle
- Combined Cycle