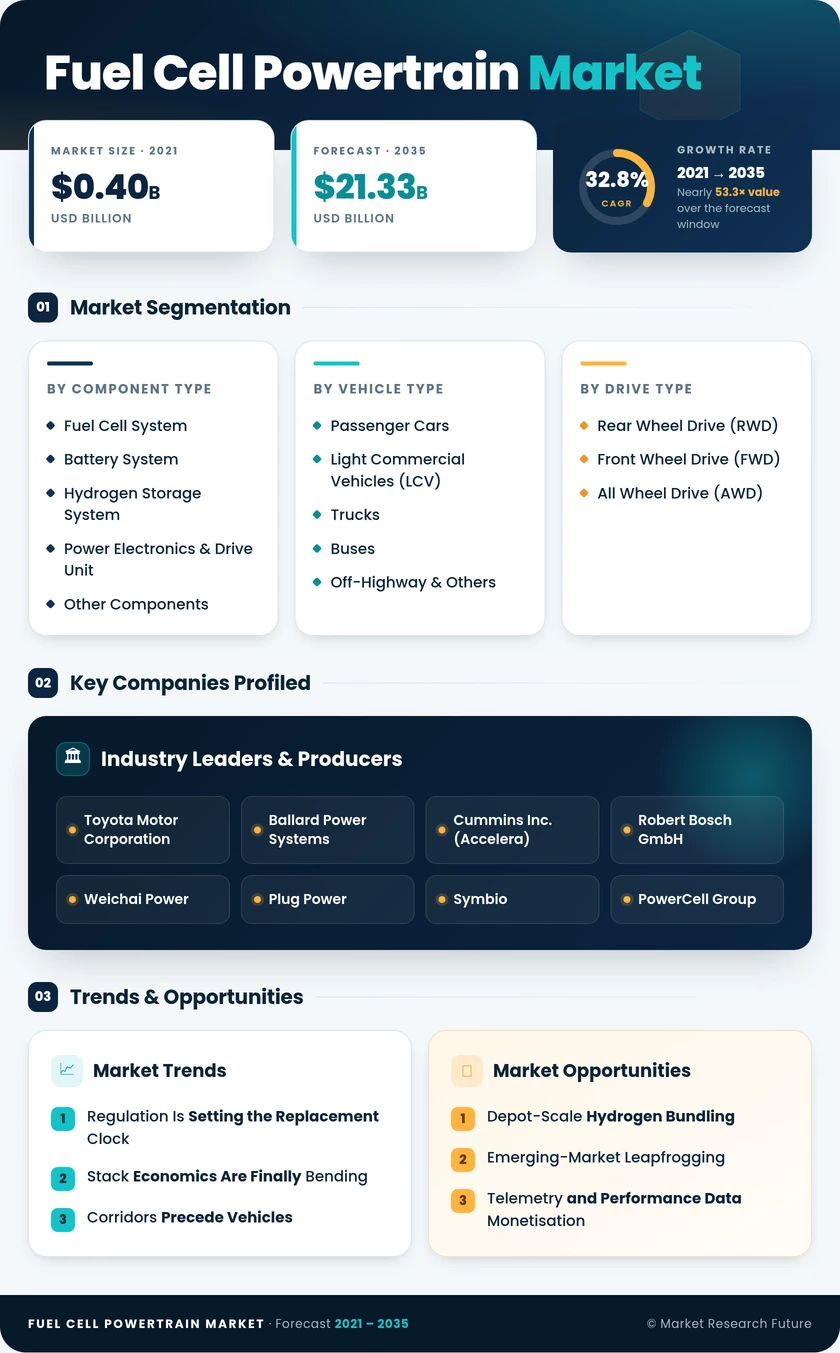
Fuel Cell Powertrain Market (2026 - 2035)

ID: MRFR/AT/8915-HCR 188 Pages Triveni Bhoyar Last Updated: October 16, 2026
Fuel Cell Powertrain Market Research Report By Component Type (Fuel Cell System, Battery System, Hydrogen Storage System, Power Electronics & Drive Unit, Other Components), By Vehicle Type (Passenger Cars, Light Commercial Vehicles (LCV), Trucks, Buses, Off-Highway & Others), By Drive Type (Rear Wheel Drive (RWD), Front Wheel Drive (FWD), All Wheel Drive (AWD)), By Power Output (Less Than 150 kW, 150–250 kW, Above 250 kW) and By Regional (North America, Europe, South America, Asia Pacific, Middle East and Africa) - Forecast to 2035
Fuel Cell Powertrain Market
Market Size
Forecast Period2026-2035
CAGR (2026-2035)32.8%
2025 Market SizeUSD 1.22 Billion
2035 Market SizeUSD 21.33 Billion
Key Players
Toyota Motor Corporation
Ballard Power Systems
Cummins Inc.
Robert Bosch GmbH
Weichai Power
Plug Power
Opportunities
  • Depot-Scale Hydrogen Bundling
  • Emerging-Market Leapfrogging
  • Telemetry and Performance Data Monetisation
  1. 1 Market Summary | |
    1. 1.1 Study Assumptions & Market Definition | |
    2. 1.2 Scope of the Study | |
    3. 1.3 Research Methodology | |
  2. 2 Key Report Takeaways | |
    1. 2.1 By Technology | |
    2. 2.2 By Sector | |
    3. 2.3 By Geography | |
  3. 3 Market Size & Forecast (2021–2035) | |
    1. 3.1 Historical Market Size (2021–2025) | |
    2. 3.2 Current & Forecast Market Size (2026–2035) | |
    3. 3.3 Year-over-Year Growth Analysis | |
  4. 4 Driver Impact Analysis | |
    1. 4.1 Regulation Is Setting the Replacement Clock | |
    2. 4.2 Stack Economics Are Finally Bending | |
    3. 4.3 Corridors Precede Vehicles | |
    4. 4.4 Sovereign Hydrogen Programmes Create Anchor Demand | |
  5. 5 Restraints Impact Analysis | |
    1. 5.1 Fuel Price Remains the Binding Constraint | |
    2. 5.2 Durability Expectations Outpace Field Evidence | |
    3. 5.3 Codes and Standards Lag the Hardware | |
  6. 6 Opportunities | |
    1. 6.1 Depot-Scale Hydrogen Bundling | |
    2. 6.2 Emerging-Market Leapfrogging | |
    3. 6.3 Telemetry and Performance Data Monetisation | |
    4. 6.4 Retrofit and Repower Channels | |
    5. 6.5 Off-Highway and Rail Adjacencies | |
  7. 7 Regional Market Share & Country-Level Analysis | |
    1. 7.1 North America | | |
      1. 7.1.1 US | | |
      2. 7.1.2 Canada | | |
      3. 7.1.3 Mexico | |
    2. 7.2 Europe | | |
      1. 7.2.1 Germany | | |
      2. 7.2.2 UK | | |
      3. 7.2.3 France | | |
      4. 7.2.4 Italy | | |
      5. 7.2.5 Spain | | |
      6. 7.2.6 Nordic Countries | | |
      7. 7.2.7 Russia | | |
      8. 7.2.8 Rest of Europe | |
    3. 7.3 Asia-Pacific | | |
      1. 7.3.1 China | | |
      2. 7.3.2 India | | |
      3. 7.3.3 Japan | | |
      4. 7.3.4 South Korea | | |
      5. 7.3.5 ASEAN | | |
      6. 7.3.6 Rest of Asia-Pacific | |
    4. 7.4 South America | | |
      1. 7.4.1 Brazil | | |
      2. 7.4.2 Argentina | | |
      3. 7.4.3 Rest of South America | |
    5. 7.5 Middle East & Africa | | |
      1. 7.5.1 Saudi Arabia | | |
      2. 7.5.2 UAE | | |
      3. 7.5.3 South Africa | | |
      4. 7.5.4 Egypt | | |
      5. 7.5.5 Rest of Middle East & Africa | |
  8. 8 Future Outlook (2026–2035) | |
    1. 8.1 Autonomy Meets Hydrogen Range | |
    2. 8.2 Fuel-as-a-Service Reshapes Procurement | |
    3. 8.3 The Electrolysis Supercycle | |
    4. 8.4 Scope 3 Reporting Becomes a Purchase Trigger | |
  9. 9 Segmentation Analysis | |
    1. 9.1 By Component Type | | |
      1. 9.1.1 Fuel Cell System | | |
      2. 9.1.2 Battery System | | |
      3. 9.1.3 Hydrogen Storage System | | |
      4. 9.1.4 Power Electronics & Drive Unit | | |
      5. 9.1.5 Other Components | |
    2. 9.2 By Vehicle Type | | |
      1. 9.2.1 Passenger Cars | | |
      2. 9.2.2 Light Commercial Vehicles (LCV) | | |
      3. 9.2.3 Trucks | | |
      4. 9.2.4 Buses | | |
      5. 9.2.5 Off-Highway & Others | |
    3. 9.3 By Drive Type | | |
      1. 9.3.1 Rear Wheel Drive (RWD) | | |
      2. 9.3.2 Front Wheel Drive (FWD) | | |
      3. 9.3.3 All Wheel Drive (AWD) | |
    4. 9.4 By Power Output | | |
      1. 9.4.1 Less Than 150 kW | | |
      2. 9.4.2 150–250 kW | | |
      3. 9.4.3 Above 250 kW | |
  10. 10 Competitive Landscape | |
    1. 10.1 Market Concentration Analysis (2026) | |
    2. 10.2 Competitive Benchmarking Matrix | |
    3. 10.3 Company Profiles | | |
      1. 10.3.1 Toyota Motor Corporation | | |
      2. 10.3.2 Hyundai Motor Company | | |
      3. 10.3.3 Ballard Power Systems | | |
      4. 10.3.4 Cummins Inc. (Accelera) | | |
      5. 10.3.5 Robert Bosch GmbH | | |
      6. 10.3.6 Weichai Power | | |
      7. 10.3.7 Plug Power | | |
      8. 10.3.8 Symbio | | |
      9. 10.3.9 PowerCell Group | | |
      10. 10.3.10 Nuvera Fuel Cells | | |
      11. 10.3.11 Denso Corporation | |
  11. 11 Recent News & Developments | |
  12. 12 Report Scope & Methodology | |
    1. 12.1 Study Period & Base Year | |
    2. 12.2 Valuation Currency & Conventions | |
    3. 12.3 Abbreviations | |
  13. 13 Detailed Sources & Citations | |
  14. 14 Frequently Asked Questions | | LIST OF TABLES | |
  15. TABLE 1 Global Fuel Cell Powertrain Market Size & Forecast, by Revenue (USD Billion), 2021–2035 | |
  16. TABLE 2 Global Fuel Cell Powertrain Market – Year-over-Year Growth Analysis, 2021–2035 | |
  17. TABLE 3 Driver Impact Analysis Matrix, 2026–2035 | |
  18. TABLE 4 Restraint Impact Analysis Matrix, 2026–2035 | |
  19. TABLE 5 Global Market Size, by Region, 2021–2035 (USD Billion) | |
  20. TABLE 6 North America Market Size, by Country, 2021–2035 (USD Billion) | |
  21. TABLE 7 Europe Market Size, by Country, 2021–2035 (USD Billion) | |
  22. TABLE 8 Asia-Pacific Market Size, by Country, 2021–2035 (USD Billion) | |
  23. TABLE 9 South America Market Size, by Country, 2021–2035 (USD Billion) | |
  24. TABLE 10 Middle East & Africa Market Size, by Country, 2021–2035 (USD Billion) | |
  25. TABLE 11 Global Market Size, by Component Type, 2021–2035 (USD Billion) | |
  26. TABLE 12 Global Market Size, by Vehicle Type, 2021–2035 (USD Billion) | |
  27. TABLE 13 Global Market Size, by Drive Type, 2021–2035 (USD Billion) | |
  28. TABLE 14 Global Market Size, by Power Output, 2021–2035 (USD Billion) | |
  29. TABLE 15 North America Market Size, by Component Type, 2021–2035 (USD Billion) | |
  30. TABLE 16 North America Market Size, by Vehicle Type, 2021–2035 (USD Billion) | |
  31. TABLE 17 Europe Market Size, by Component Type, 2021–2035 (USD Billion) | |
  32. TABLE 18 Europe Market Size, by Vehicle Type, 2021–2035 (USD Billion) | |
  33. TABLE 19 Asia-Pacific Market Size, by Component Type, 2021–2035 (USD Billion) | |
  34. TABLE 20 Asia-Pacific Market Size, by Vehicle Type, 2021–2035 (USD Billion) | |
  35. TABLE 21 South America Market Size, by Component Type, 2021–2035 (USD Billion) | |
  36. TABLE 22 Middle East & Africa Market Size, by Component Type, 2021–2035 (USD Billion) | |
  37. TABLE 23 Competitive Benchmarking Matrix, 2026 | |
  38. TABLE 24 Company Profiles – Key Players | |
  39. TABLE 25 Recent Developments & Strategic Announcements, 2023–2025 | |
  40. TABLE 26 Report Scope & Methodology Summary | |
  41. TABLE 27 Detailed Sources & Citations Index | | LIST OF FIGURES | |
  42. FIGURE 1 Market Dynamics Overview – Drivers, Restraints, Opportunities | |
  43. FIGURE 2 Industry Value Chain Analysis – Hydrogen Supply to Vehicle Integration | |
  44. FIGURE 3 Porter's Five Forces Analysis | |
  45. FIGURE 4 Global Market Size Trend, 2021–2035 (USD Billion) | |
  46. FIGURE 5 Year-over-Year Growth Trajectory, 2022–2035 | |
  47. FIGURE 6 Market Share by Component Type, 2025 vs 2035 | |
  48. FIGURE 7 Market Share by Vehicle Type, 2025 vs 2035 | |
  49. FIGURE 8 Market Share by Drive Type, 2025 | |
  50. FIGURE 9 Market Share by Power Output, 2025 vs 2035 | |
  51. FIGURE 10 Regional Revenue Share Distribution, 2025 | |
  52. FIGURE 11 Regional CAGR Comparison, 2026–2035 | |
  53. FIGURE 12 Country-Level Share Within Asia-Pacific, 2025 | |
  54. FIGURE 13 Country-Level Share Within Europe, 2025 | |
  55. FIGURE 14 Competitive Landscape – Estimated Revenue Share Bands, 2026 | |
  56. FIGURE 15 Competitive Positioning Matrix – Capability vs Scale | |
  57. FIGURE 16 Delivered Hydrogen Cost Sensitivity vs Adoption Rate

Segmentation Quick Reference

DimensionSub-SegmentsDominant SegmentFastest Growing Segment
By Component TypeFuel Cell System; Battery System; Hydrogen Storage System; Power Electronics & Drive Unit; Other ComponentsFuel Cell SystemHydrogen Storage System
By Vehicle TypePassenger Cars; Light Commercial Vehicles (LCV); Trucks; Buses; Off-Highway & OthersPassenger CarsTrucks
By Drive TypeRear Wheel Drive (RWD); Front Wheel Drive (FWD); All Wheel Drive (AWD)Rear Wheel Drive (RWD)All Wheel Drive (AWD)
By Power OutputLess Than 150 kW; 150–250 kW; Above 250 kW150–250 kWAbove 250 kW
By GeographyNorth America; Europe; Asia-Pacific; South America; Middle East & AfricaAsia-PacificMiddle East & Africa


Market Segmentation Overview

By Component Type

Sub-SegmentKey Trend
Fuel Cell SystemRoll-to-roll membrane manufacturing cutting per-kilowatt cost
Battery SystemBuffer packs shrinking as stack transient response improves
Hydrogen Storage SystemType IV carbon-fibre tanks displacing metal-lined designs
Power Electronics & Drive UnitSilicon-carbide inverters raising drivetrain efficiency
Other ComponentsAir compressors and humidifiers moving to automotive-grade tooling


Component value is migrating outward from the stack. As membrane and catalyst costs fall, storage and power electronics claim a rising share of bill-of-material spend, which reshapes which suppliers capture margin over the forecast decade.

By Vehicle Type

Sub-SegmentKey Trend
Passenger CarsVolumes plateau as OEMs redirect capital toward commercial platforms
Light Commercial Vehicles (LCV)Municipal and parcel fleets adopting depot-refuelled vans
TrucksLinehaul tractors driving the steepest volume ramp to 2035
BusesTransit authority mandates sustaining steady replacement demand
Off-Highway & OthersMining and port handling adopting for altitude and duty-cycle reasons


Commercial vehicles take over the growth narrative. Trucks and off-highway equipment share the payload sensitivity and depot-based refuelling patterns that make hydrogen economics work, while passenger adoption stays tied to a handful of incentive-rich geographies.

By Drive Type

Sub-SegmentKey Trend
Rear Wheel Drive (RWD)Default architecture for commercial chassis packaging
Front Wheel Drive (FWD)Carried over from existing passenger platforms
All Wheel Drive (AWD)Growing with off-highway traction and premium passenger demand


Drive architecture follows chassis convention rather than propulsion requirements. All-wheel configurations gain ground as off-highway and premium passenger applications expand, but rear-wheel layouts stay dominant on commercial platforms.

By Power Output

Sub-SegmentKey Trend
Less Than 150 kWSingle-stack systems serving cars and light vans
150–250 kWSweet spot for regional haul and transit duty cycles
Above 250 kWMulti-stack integration maturing for long-haul tractors


Power banding tracks application economics closely. The mid band captures the largest installed fleet population today, while the high-output band grows fastest as multi-stack thermal and control integration becomes routine engineering rather than bespoke development.




Download PDF ×

We do not share your information with anyone. However, we may send you emails based on your report interest from time to time. You may contact us at any time to opt-out.